Market Momentum: Your Weekly Financial Forecast & Market Prep
Issue 30 / What to expect Jan 27, 2025 thru Jan 31, 2025

In This Issue
Market-On-Close: All of last week’s market-moving news and macro context in under 5 minutes + futures-snapshots
Special Coverage: The Trump-Trade - Anticipated Policy Changes Under Donald Trump’s Presidency and Their Market Impacts
The Latest Investor Sentiment Readings
Institutional Support & Resistance Levels For Major Indices: Exactly where to look for support and resistance this week in SPY, QQQ, IWM & DIA
Institutional Activity By Sector: Institutional order flow by sector including the top institutionally-backed names in those sectors. We break it all down and provide the key insights and take-aways you need to navigate institutional positioning this week.
Top Institutional Order Flow In Individual Names: All of the largest sweeps and blocks on lit exchanges and hidden dark pools
Investments In Focus: Bull vs Bear arguments for QSR, CVX & LB
Top Institutionally-Backed Gainers & Losers: An explosive watchlist for day traders seeking high-volatility
Normalized Performance By Thematics YTD (Sector, Industry, Factor, Energy, Metals, Currencies, and more): which corners of the markets are beating benchmarks, which ones are overlooked and which ones are over-crowded
Key Econ Events and Earnings On-Deck For This Week

Market-On-Close
Markets, Policy, and Potential in 2025's Opening Act
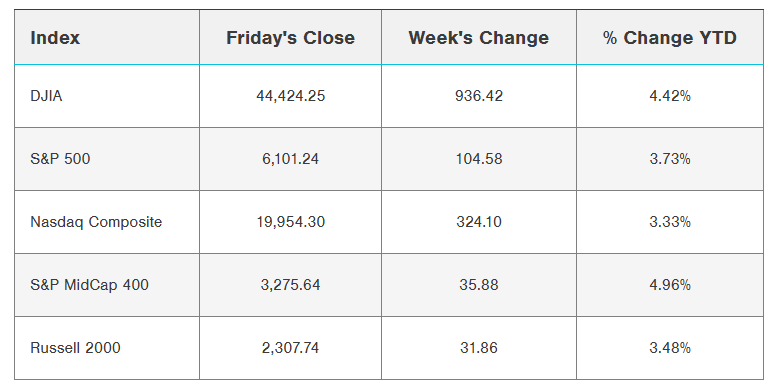
With only a week left in the first month of 2025, the United States financial markets revealed a complex tapestry of economic signals, technological aspirations, and political recalibration. The stock market's performance painted a nuanced picture of resilience and challenge, with major indices experiencing modest declines yet holding near historical highs.
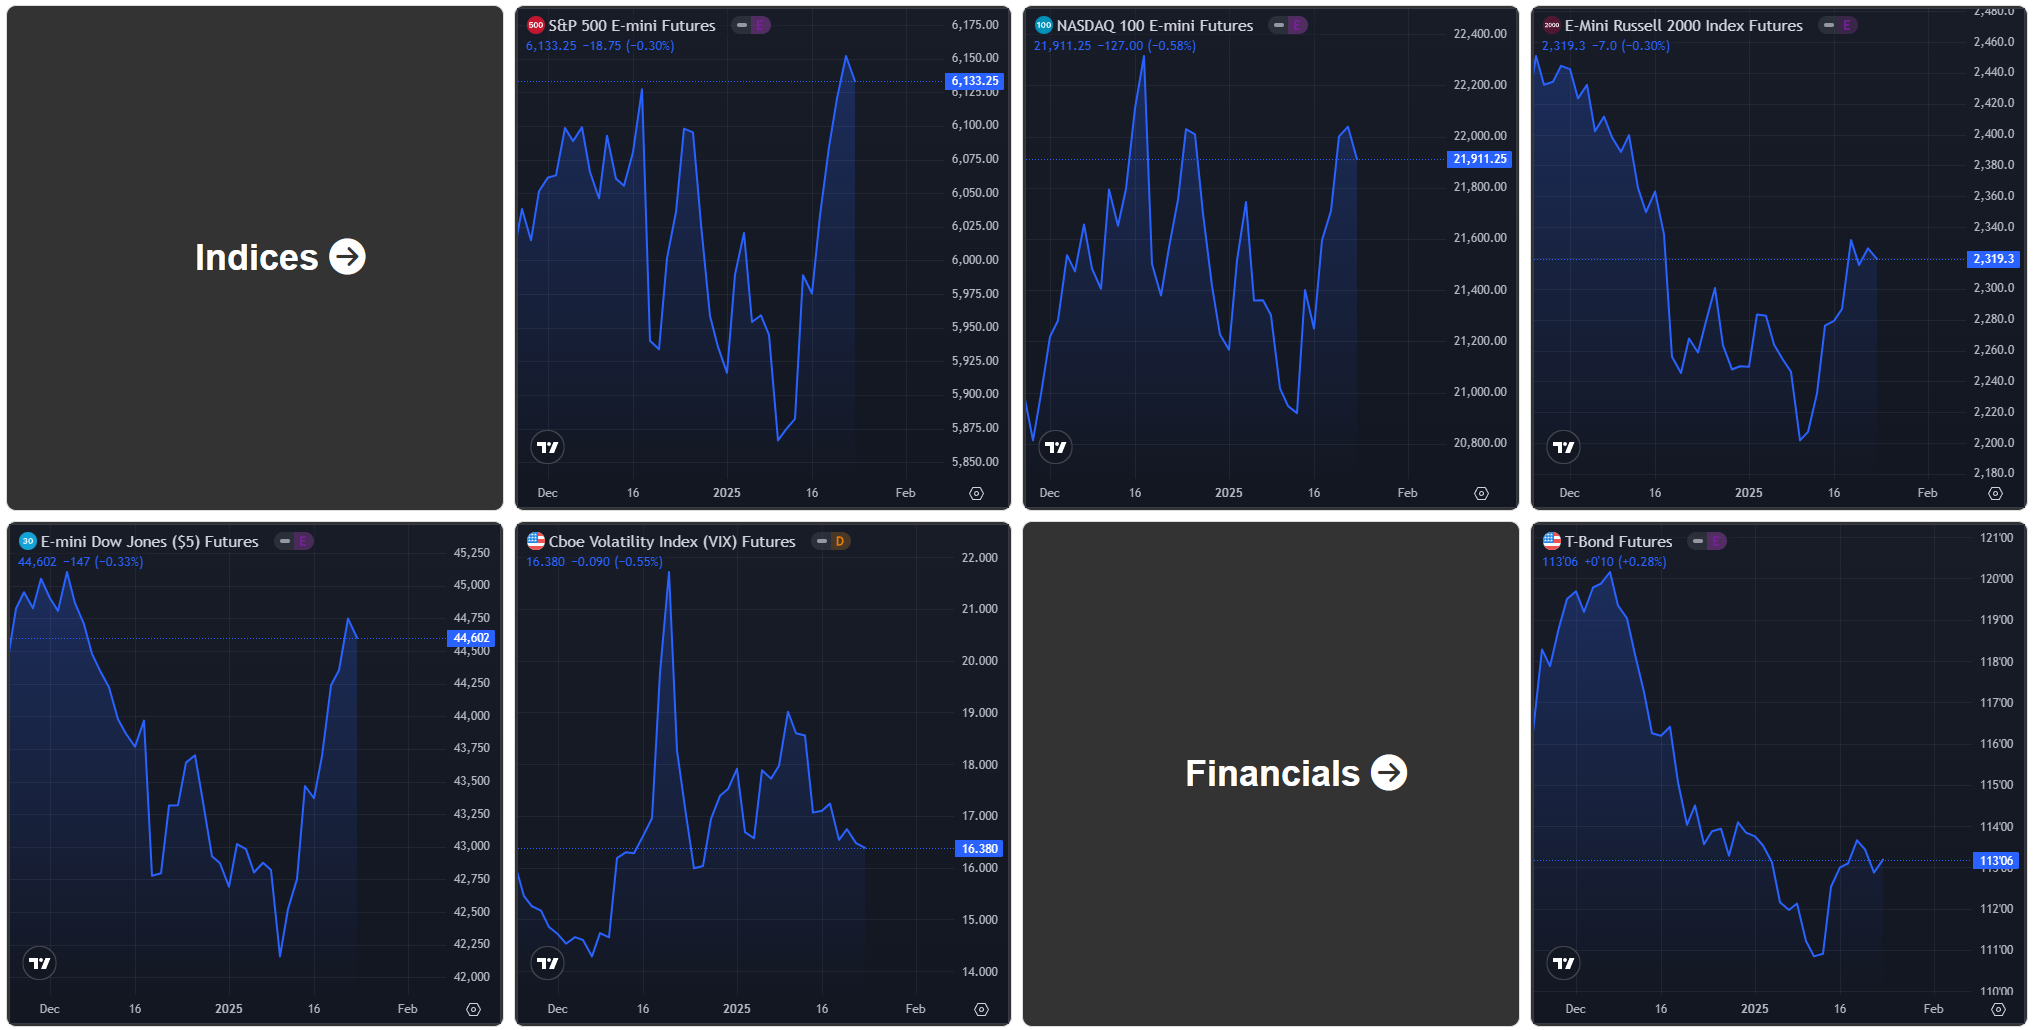
The S&P 500, despite closing down 0.29% for the week, achieved a remarkable milestone by establishing a new record high. This seemingly contradictory performance encapsulates the current market's intricate dynamics—a blend of cautious optimism and underlying strength. The Dow Jones Industrial Average and Nasdaq 100 followed similar trajectories, with respective declines of 0.32% and 0.58%, reflecting a market carefully navigating multiple economic crosscurrents.
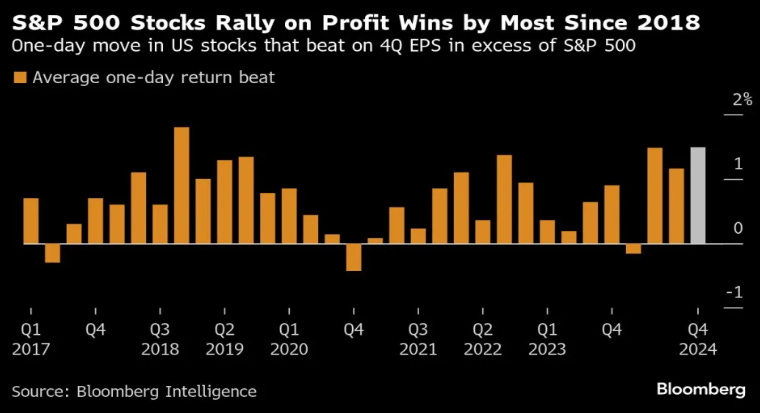
At the heart of this week's market narrative was the ongoing quarterly earnings season, which emerged as a critical driver of investor sentiment. Analysts projected a robust 7.5% year-over-year earnings growth for S&P 500 companies—the most substantial increase since 2021. This projection suggests that corporate America continues to demonstrate remarkable adaptive capacity in an increasingly complex global environment.
The technology sector, particularly the so-called "Magnificent Seven" stocks, remained a focal point of market attention. With impending earnings reports from industry titans like Microsoft, Tesla, Apple, and Meta Platforms, investors are keenly assessing the potential for continued technological momentum. The sector's performance carries significant weight, given that these companies have been primary engines of market growth, collectively driving nearly 65% of recent market gains.

Semiconductor stocks experienced notable turbulence during the week. Texas Instruments' disappointing forward guidance sent ripples through the sector, with multiple chip manufacturers—including Nvidia, Microchip Technology, and Analog Devices—experiencing a good shake. This downturn highlighted the ongoing challenges in the semiconductor industry, particularly within automotive and consumer electronics markets.
The macroeconomic landscape presented an equally intricate tableau. The S&P Global economic activity report revealed nuanced indicators of economic health. The manufacturing sector, after months of contraction, showed signs of revival—returning to growth for the first time in six months. Meanwhile, service sector activity continued, albeit at a more measured pace, suggesting a cautious but resilient economic foundation.
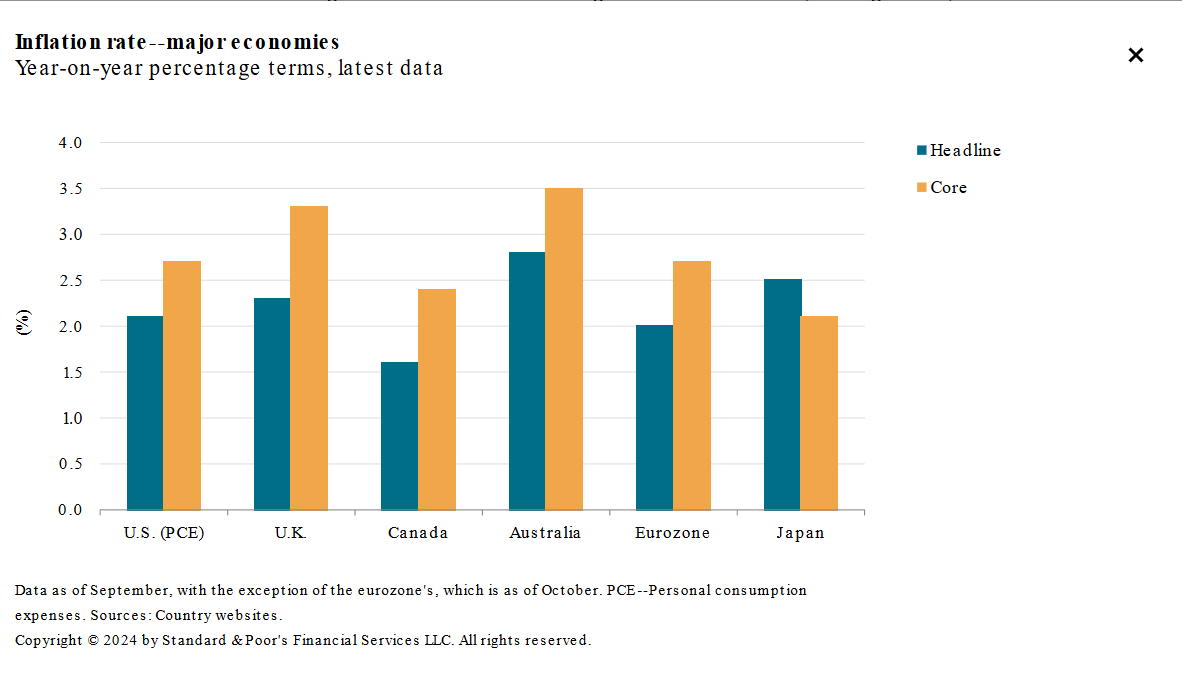
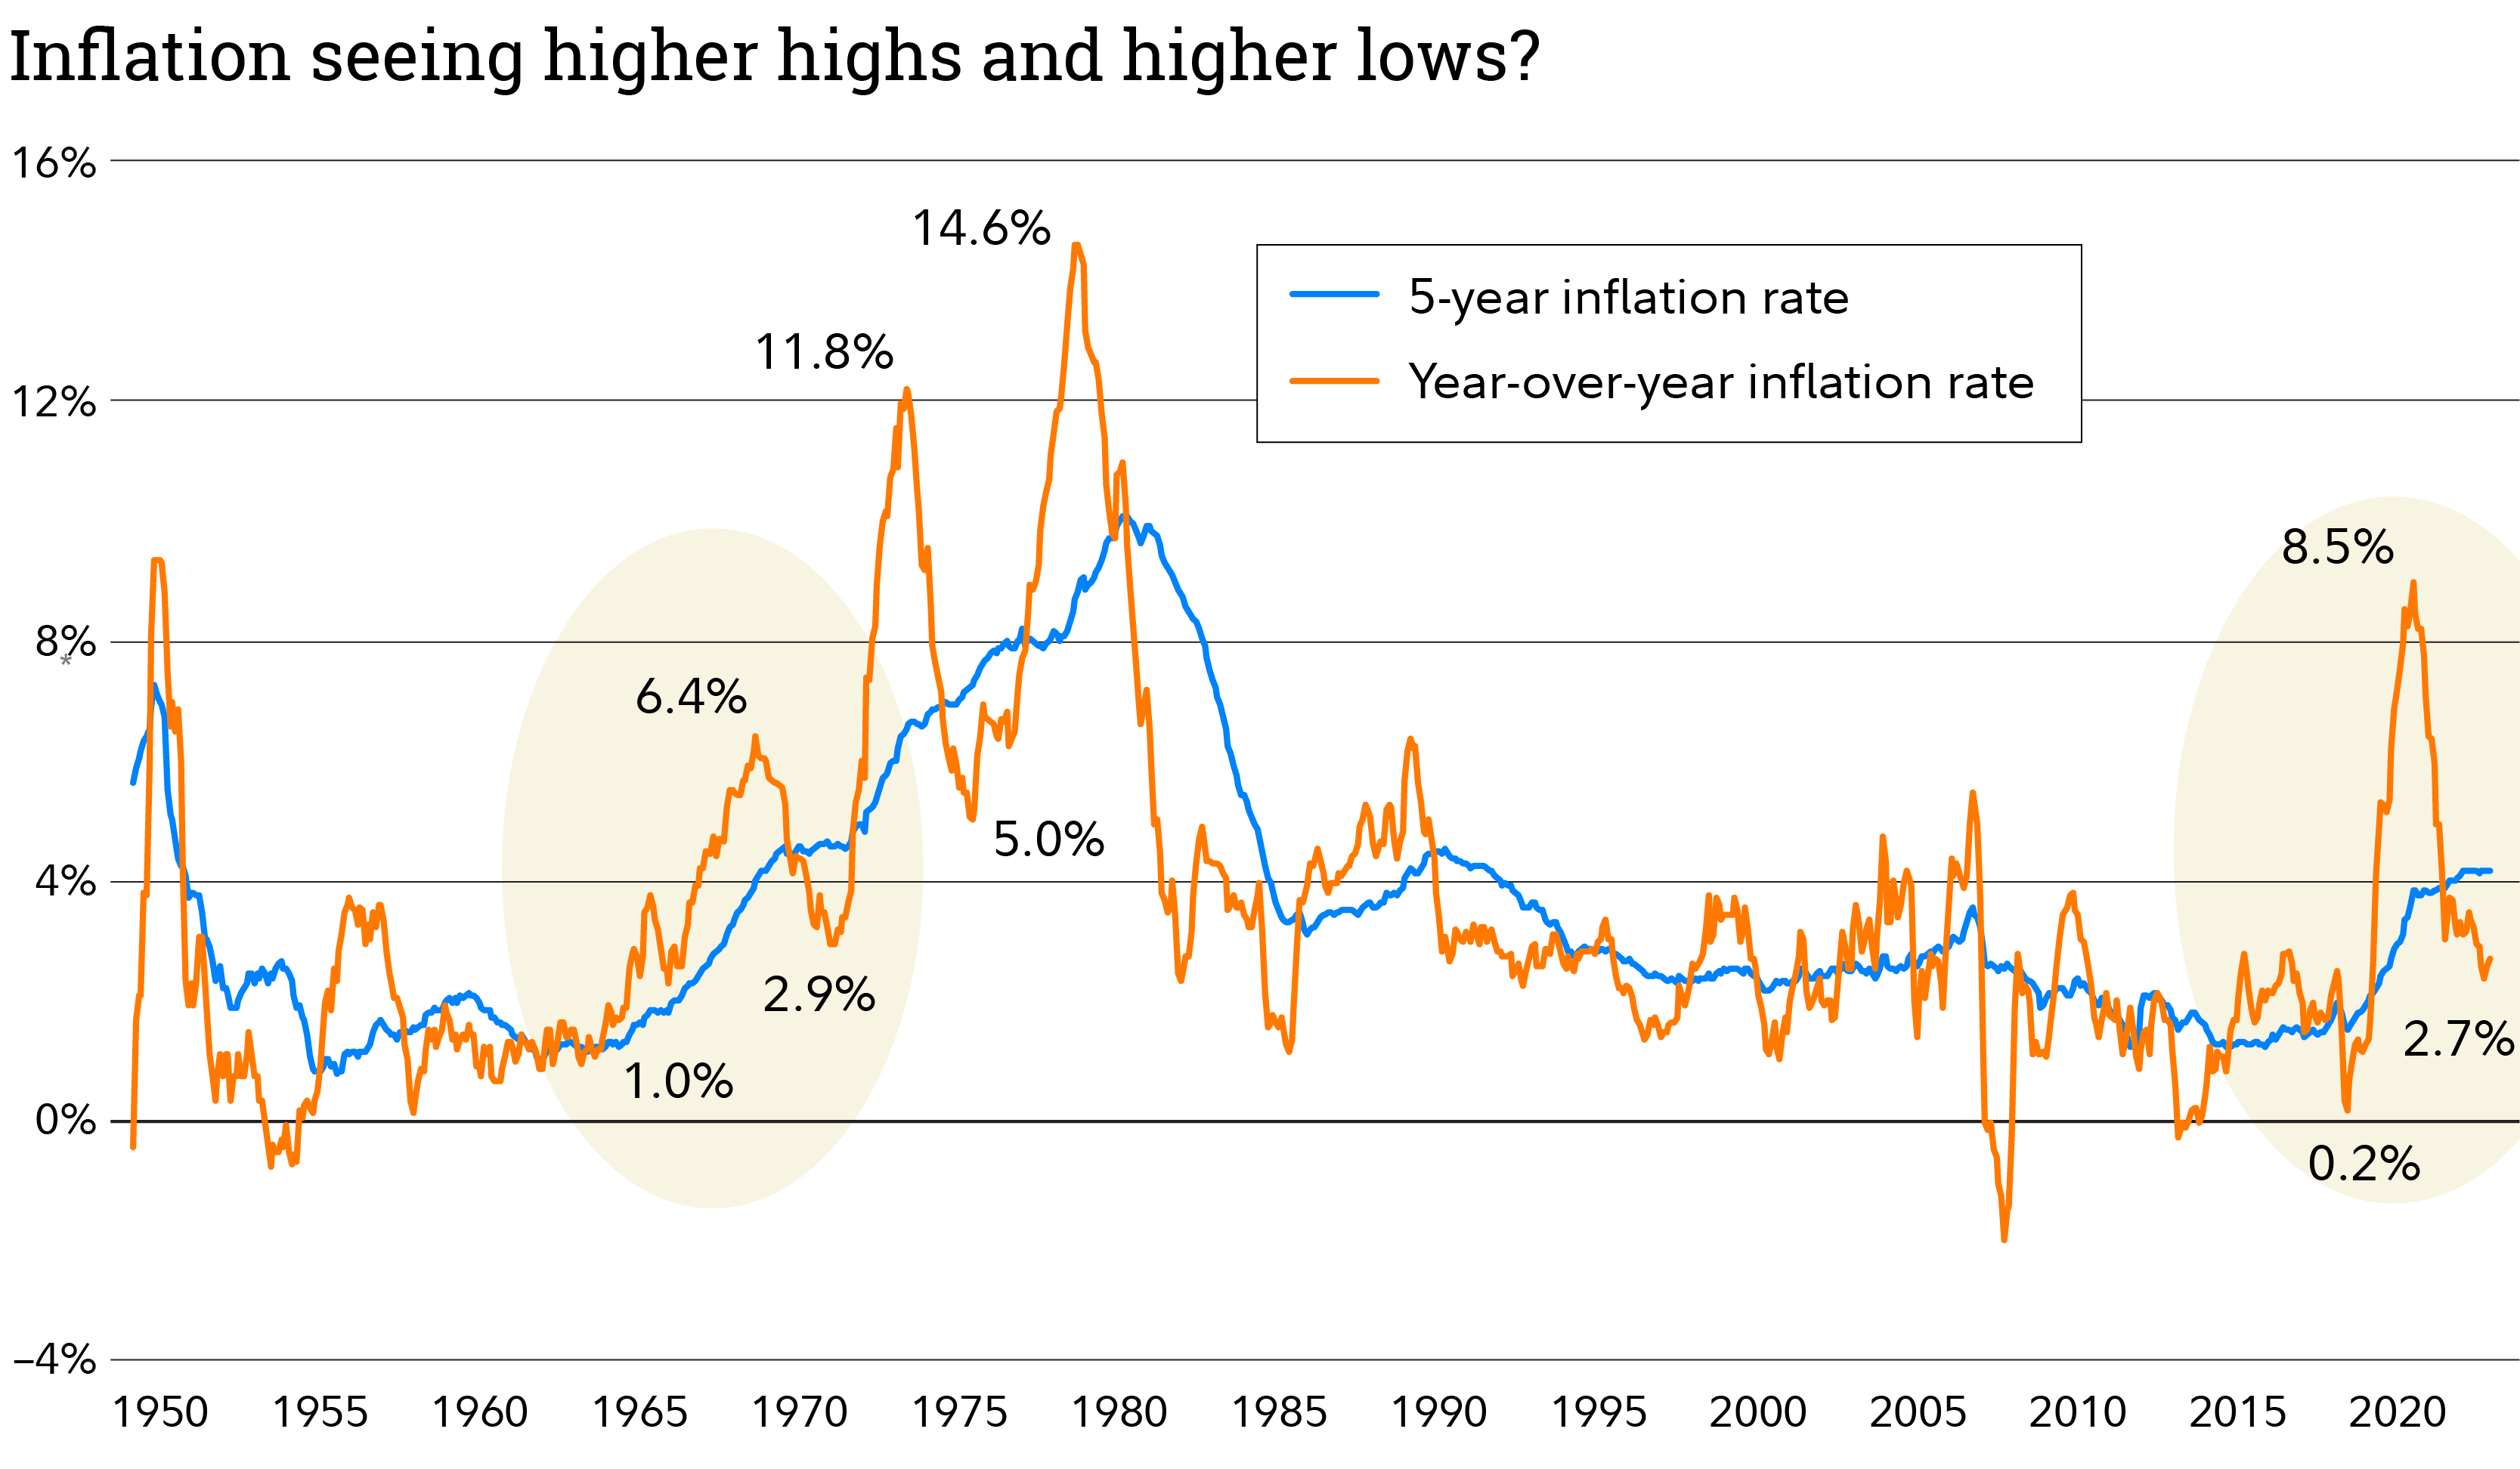
Consumer sentiment emerged as another critical barometer of economic mood. The University of Michigan's sentiment index unexpectedly declined, dropping to 71.1 from December's 74.0. This reduction was primarily driven by growing concerns about potential inflation and unemployment, reflecting the underlying economic anxieties that persist despite overall market strength.
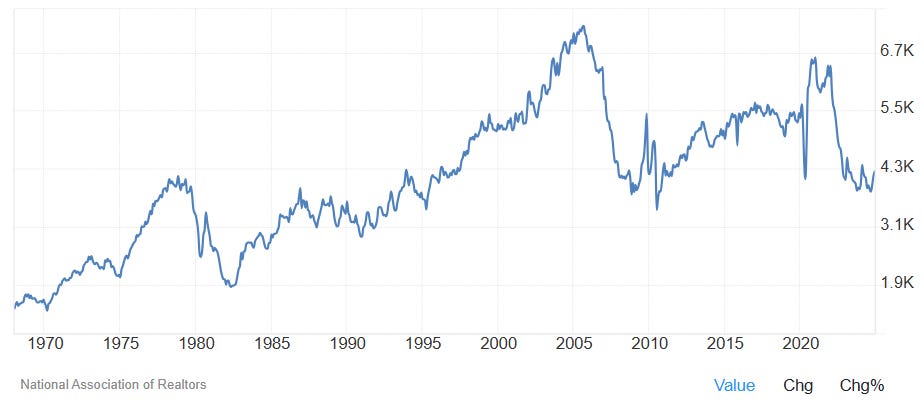
The real estate sector offered its own complex narrative. December saw existing home sales rise 2.2% to 4.24 million units—a 10-month high. However, the broader 2024 landscape told a different story, with total sales reaching their lowest level since 1995. High interest rates and elevated home prices continued to challenge market dynamics, creating a significant headwind for residential real estate.
The week's most intriguing developments emerged from the political sphere, with the new administration signaling potentially transformative policy directions. Energy policy shifted towards increased fossil-fuel production, while simultaneously announcing a groundbreaking $500 billion initiative in artificial intelligence infrastructure. The Stargate project, a collaboration involving Softbank, OpenAI, Oracle, and MGX, signals a strategic commitment to technological leadership.

Trade policy appeared more nuanced than many had anticipated. Rather than implementing immediate, broad-based tariffs, the administration opted for a more measured approach—requesting comprehensive reviews of trade policies and indicating a preference for targeted, strategic interventions rather than sweeping economic disruptions.

Monetary policy remained a critical consideration. The Federal Reserve is expected to maintain current interest rates, with ongoing uncertainty surrounding potential future rate cuts. Internationally, the Bank of Japan's decision to raise its short-term policy rate to 0.50% represents a significant moment in global monetary policy.
For investors, these developments underscore the importance of a strategic, adaptable approach. The market's narrow rally, with only 62% of S&P 500 components trading above their 200-day moving average, suggests potential volatility. Diversification, attentive risk management, and a focus on fundamental economic indicators become paramount.

The technology sector, particularly artificial intelligence, represents a compelling narrative of potential future growth. The substantial investment signals not just a financial strategy but a broader commitment to maintaining technological leadership. For investors, this suggests looking beyond immediate market fluctuations and considering long-term transformative potential.

As we progress through 2025, the interplay between technological innovation, policy evolution, and global economic dynamics will continue to shape market opportunities. The current landscape demands both strategic patience and adaptive responsiveness.
The markets have entered a phase of sophisticated complexity—where traditional economic indicators intersect with technological revolution, where policy decisions carry immediate and long-term implications, and where global interconnectedness creates both challenges and unprecedented opportunities.
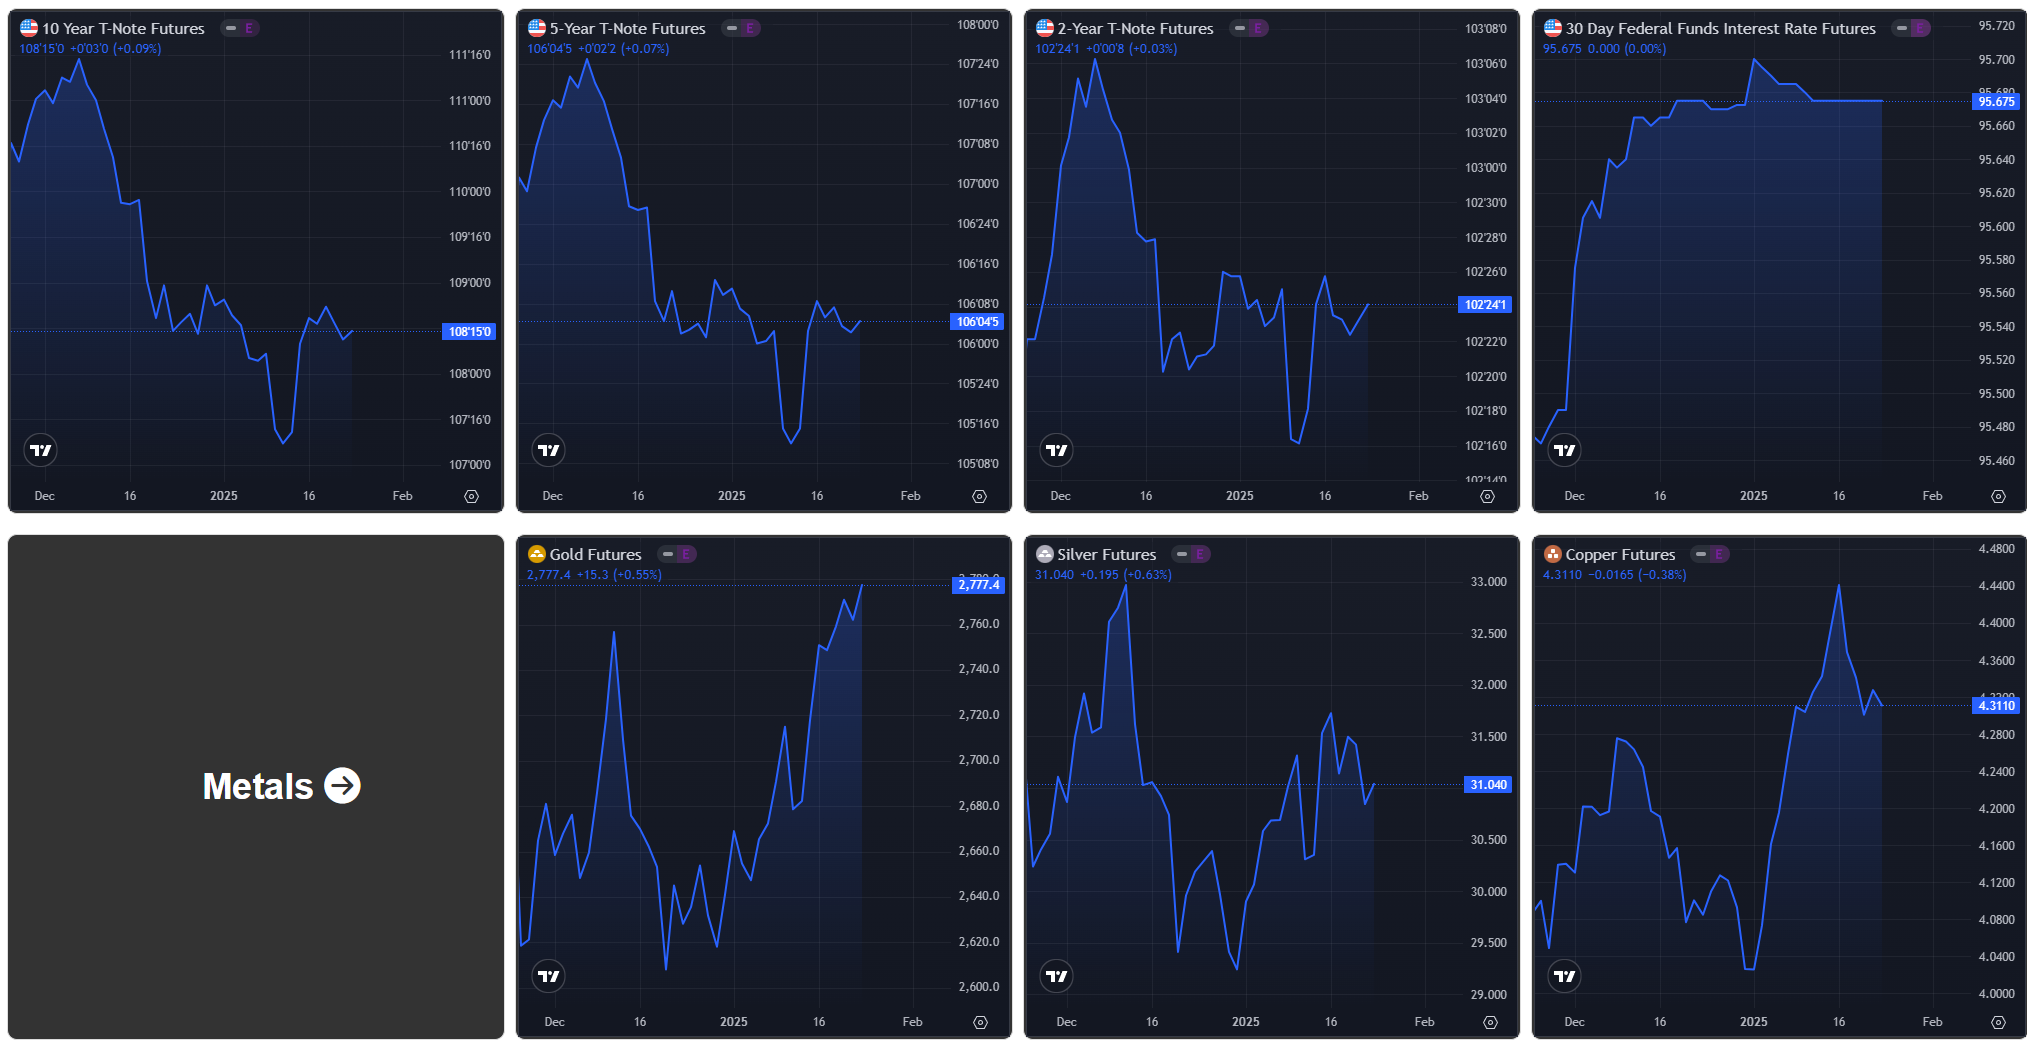
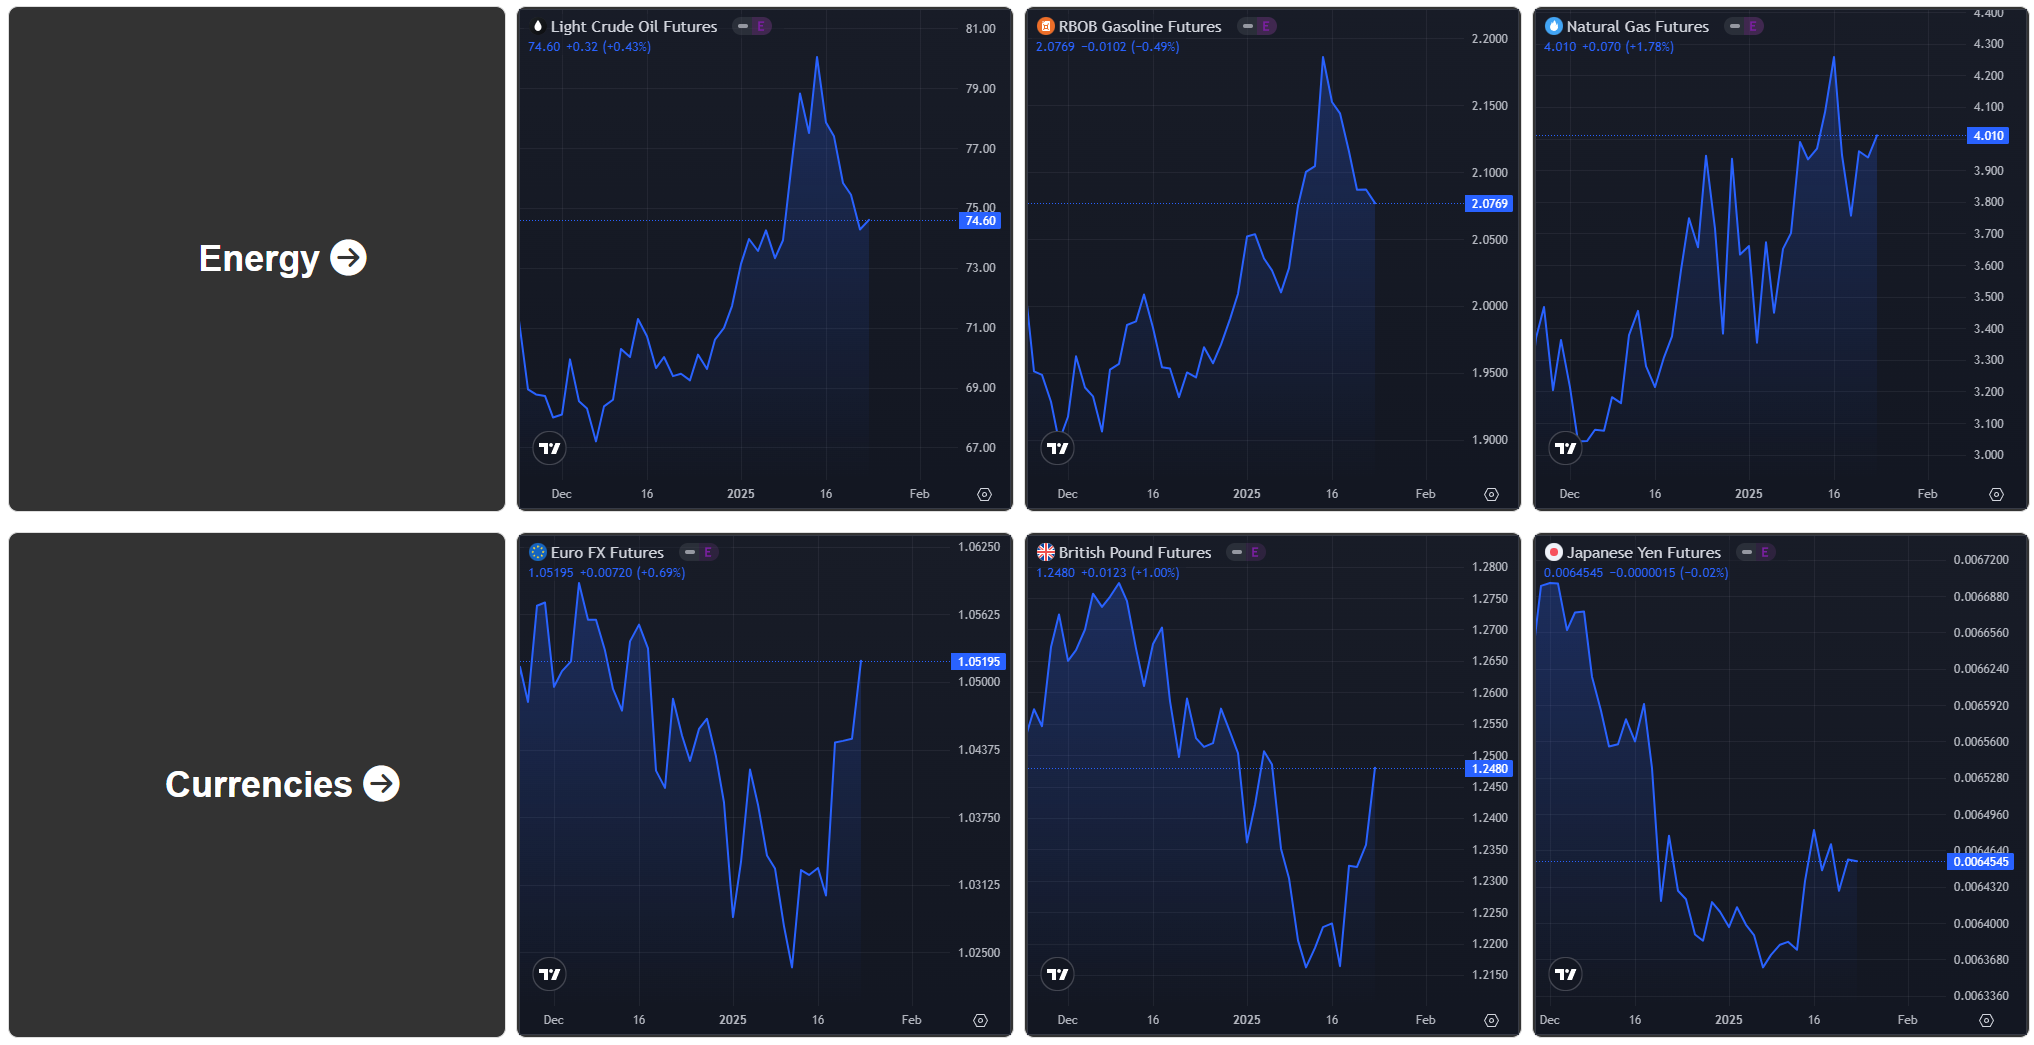
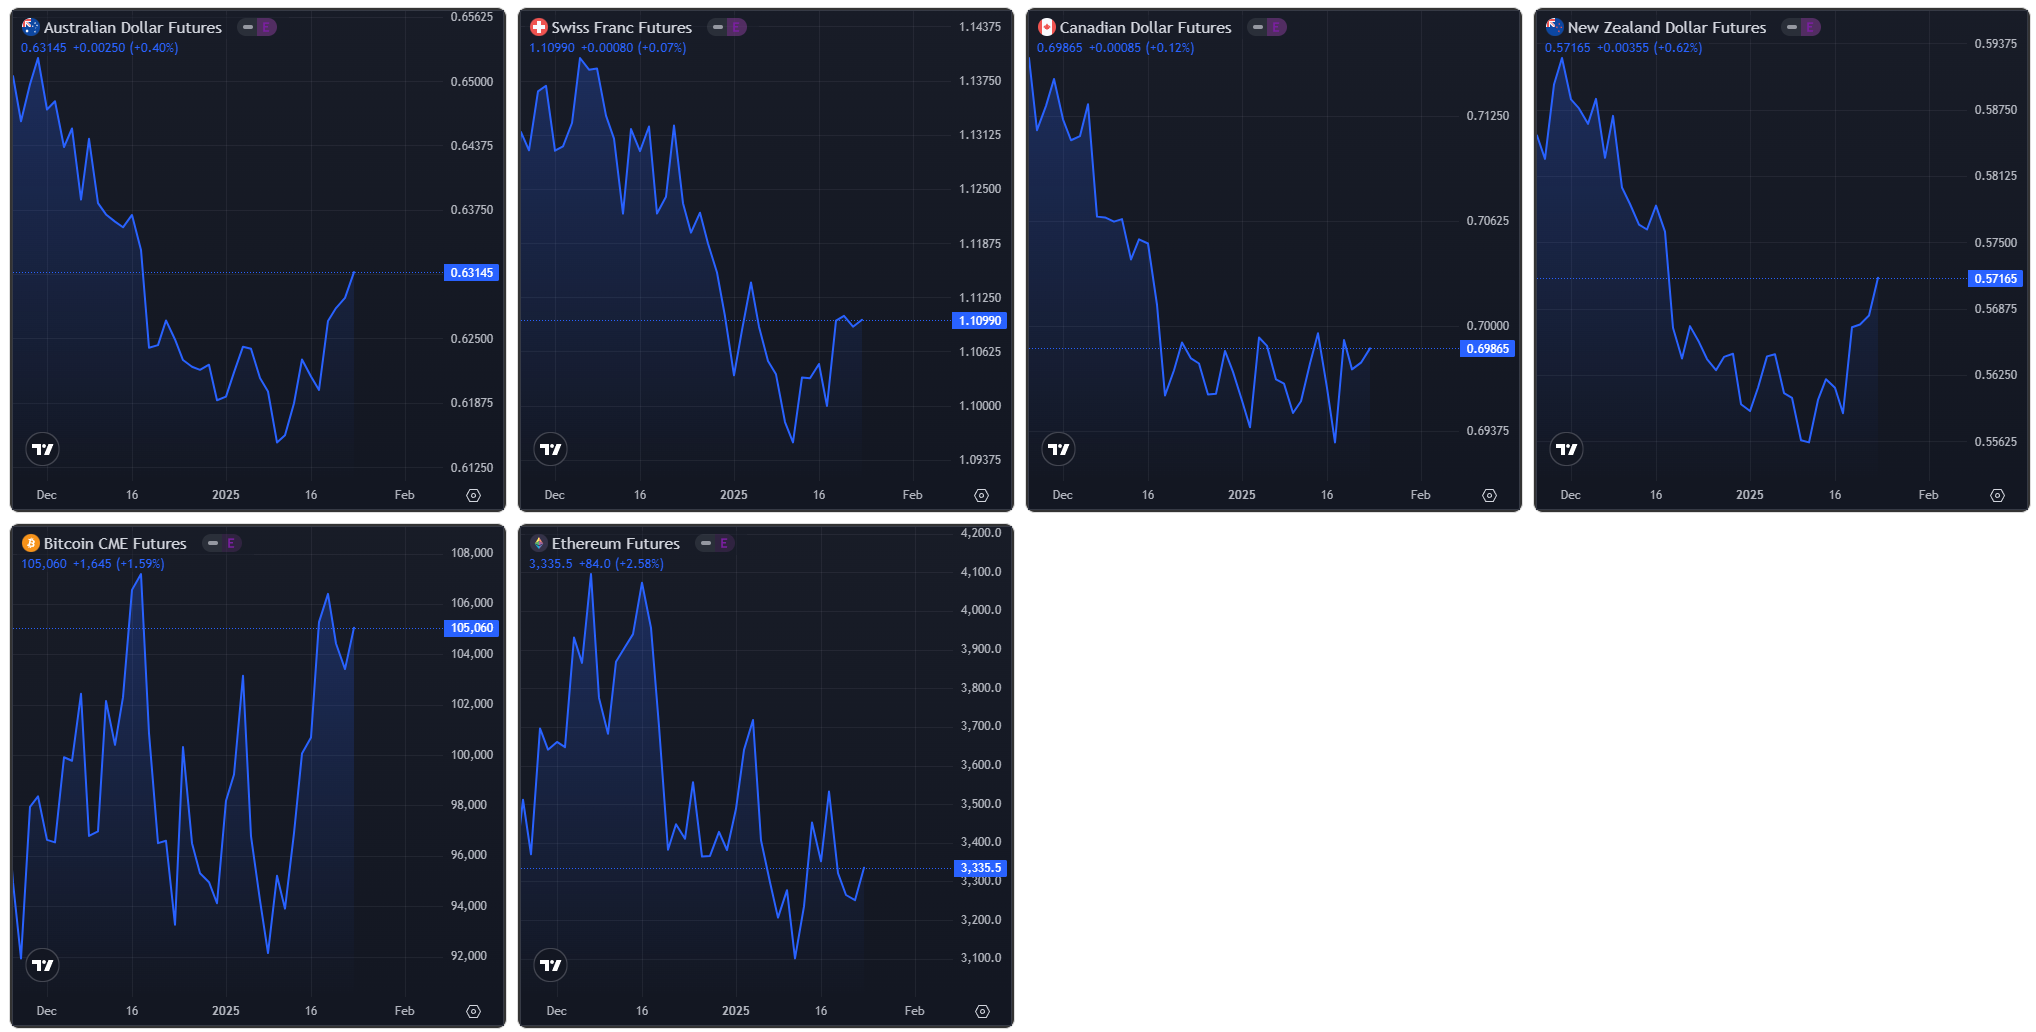
Futures Markets Snapshots
S&P 500: Sector Insights
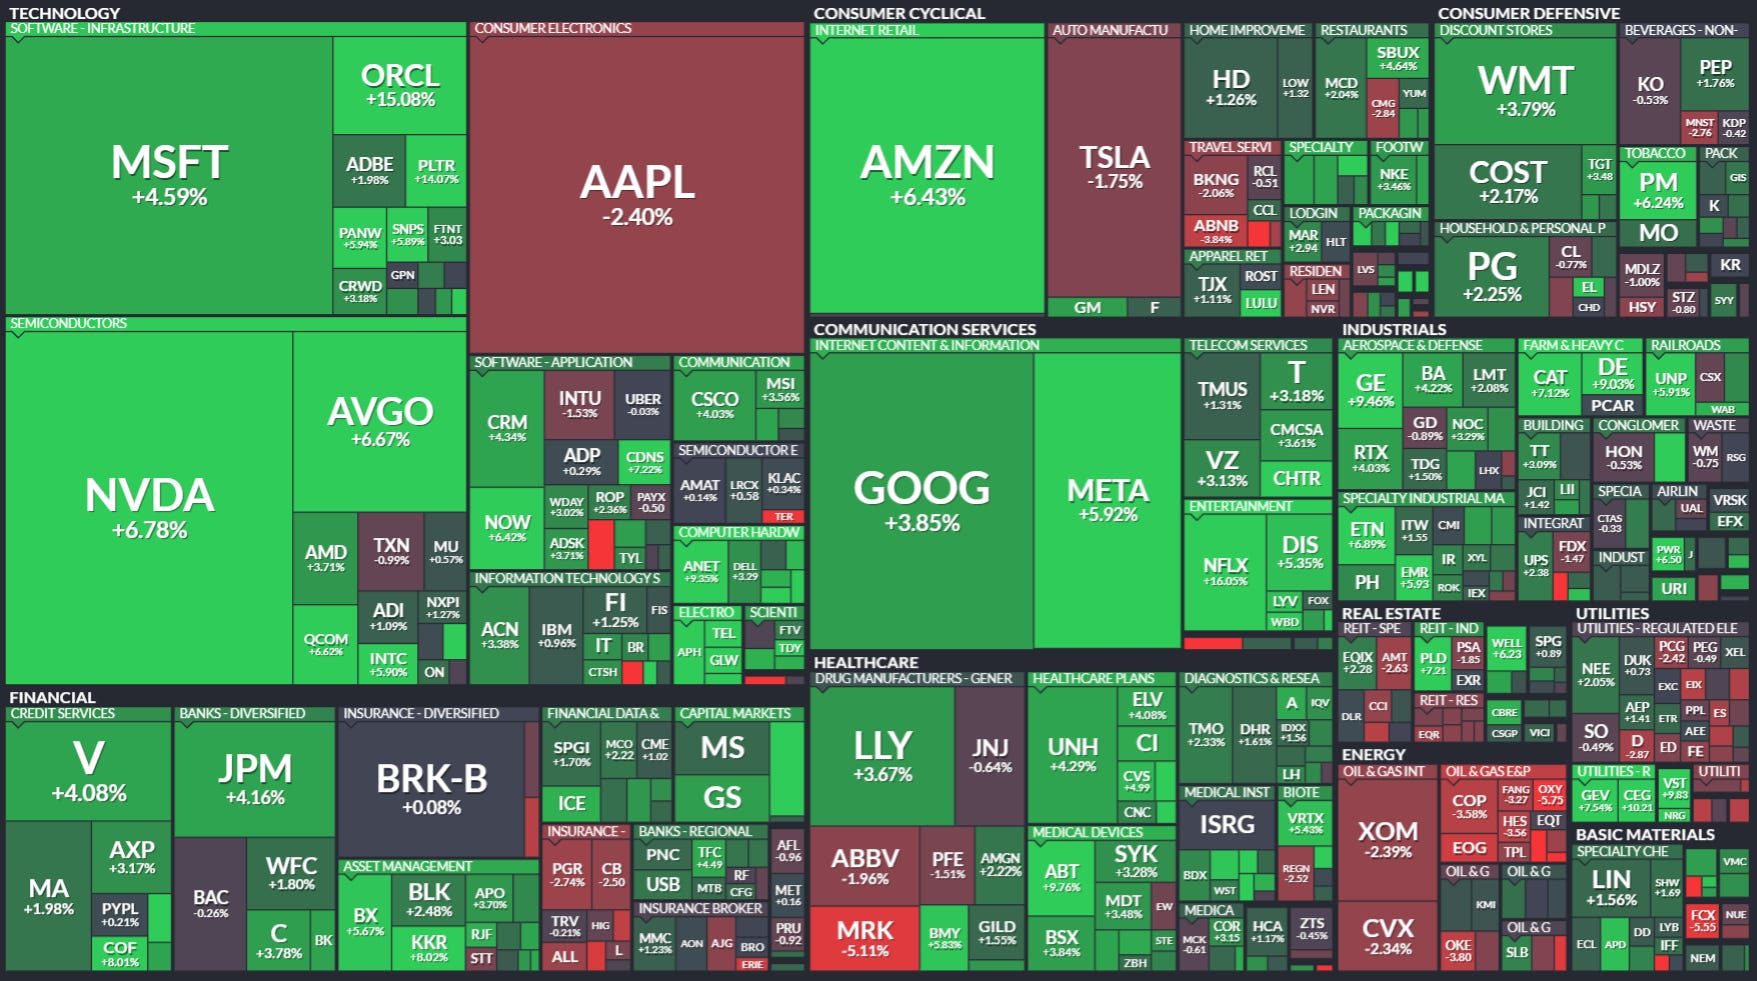
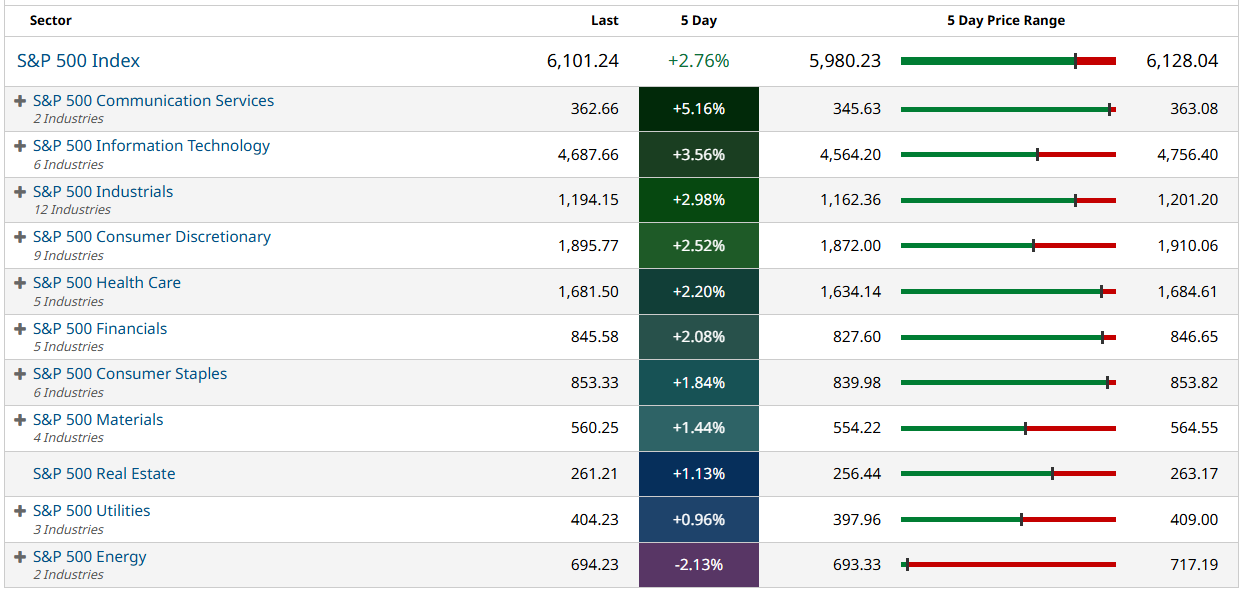
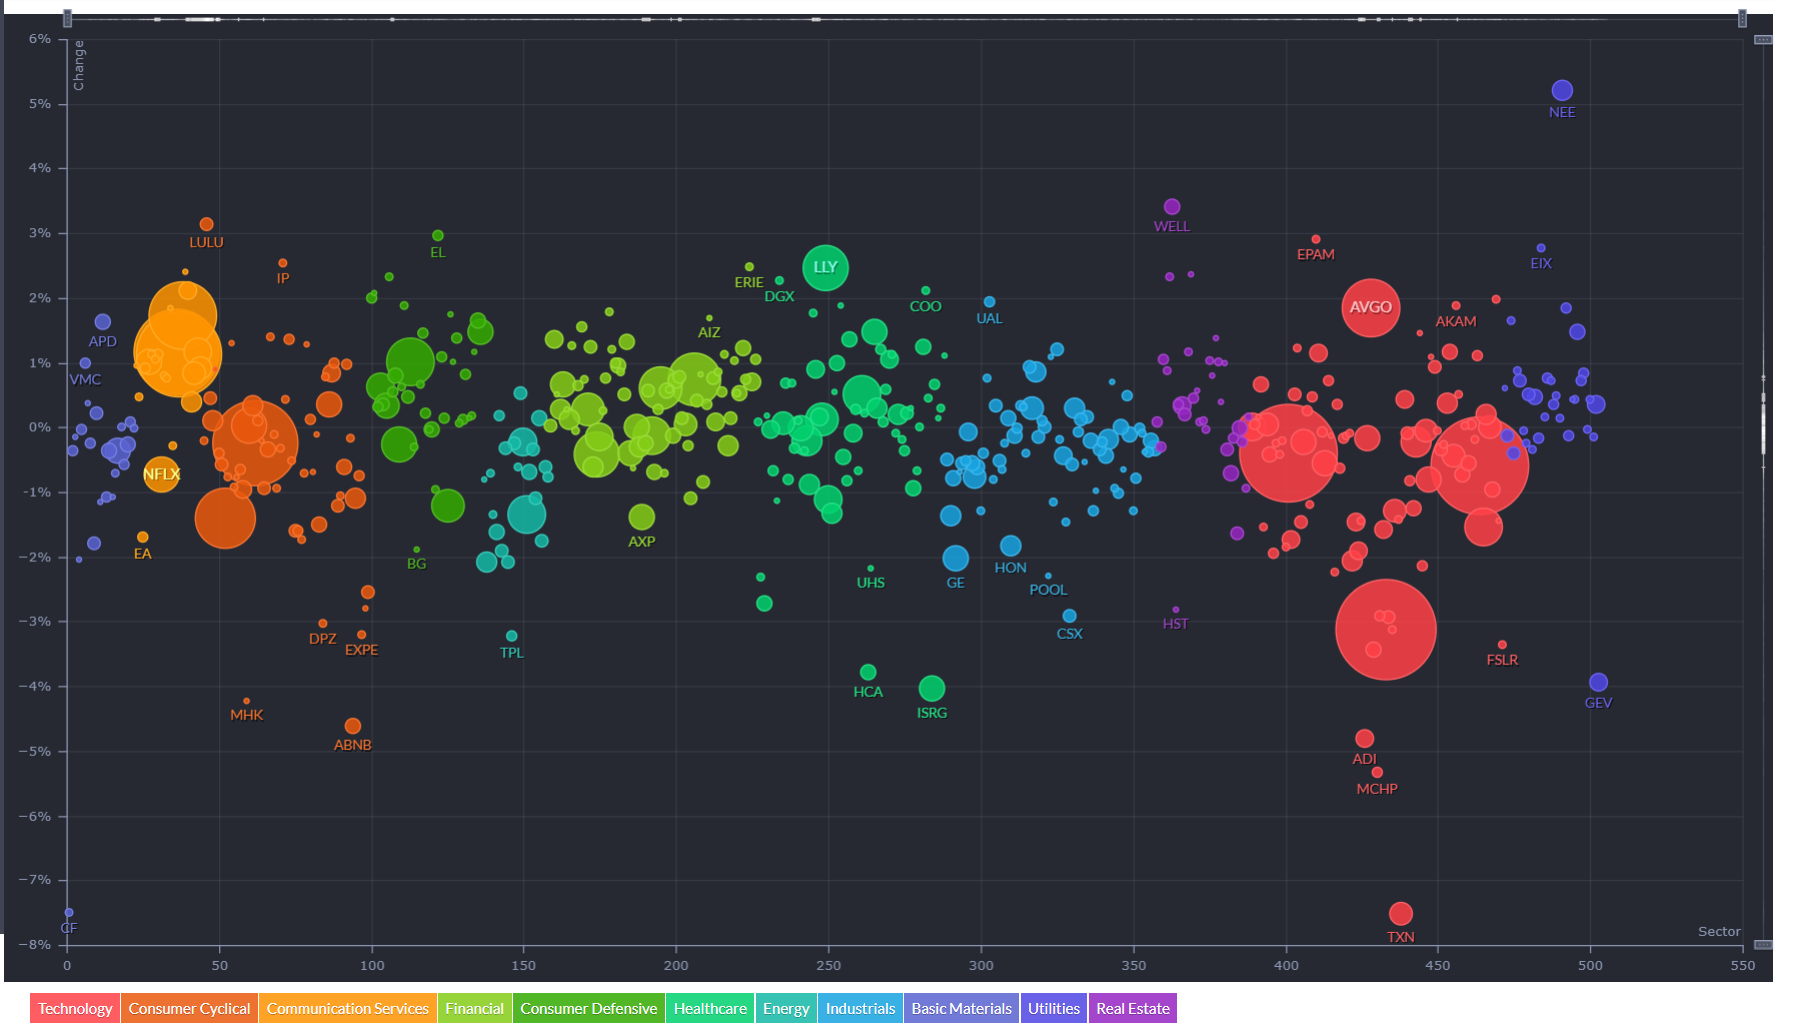
The technology sector stood out as the top performer, with significant gains driven by AI momentum and strong earnings. Oracle ( ORCL -0.21%↓ ) soared over 15% following the announcement of the Stargate AI initiative, a government-backed collaboration with OpenAI and SoftBank to invest $500 billion in U.S. AI infrastructure over the next four years. Nvidia ( NVDA -0.09%↓ ) also climbed nearly 7% as ongoing demand for AI-related hardware reaffirmed its dominant position in the market. Meanwhile, Microsoft ( MSFT -0.05%↓ ) saw steady gains as investors responded positively to its continued success in cloud services and AI investments.
In the consumer discretionary sector, robust consumer spending and strong retail performance propelled gains. Amazon ( AMZN -0.03%↓ ) rose by over 6%, buoyed by analyst upgrades highlighting strength in its cloud computing and e-commerce divisions. Despite Tesla's ( TSLA -0.17%↓ ) slight decline, its launch of the Model Y in the U.S. and Europe generated optimism for future sales growth. Home Depot also contributed to the sector's strength, reflecting healthy demand for home improvement products.
The energy sector faced challenges, driven by a dip in oil prices following calls from President Trump for OPEC to reduce prices. As a result, ExxonMobil ( XOM 0.00%↑ ) and Chevron ( CVX 0.00%↑ ) both saw declines, underperforming the broader market. This contrasted with the industrials sector, where companies like General Electric ( GE -0.03%↓ ) outperformed due to robust demand in its aerospace division, with increased jet engine orders supporting growth. Financials also saw strong performance, with JPMorgan Chase ( JPM 0.00%↑ ) benefiting from rising net interest margins, leading analysts to raise price targets.
Healthcare saw mixed results, with managed care and pharmaceutical companies diverging. Eli Lilly ( LLY -0.10%↓ ) gained nearly 4%, supported by positive updates on its diabetes and obesity treatments, which also prompted analyst upgrades. In contrast, Merck ( MRK 0.09%↑ ) declined over 5%, reflecting concerns about competition in its oncology drug portfolio and weaker guidance from analysts.
Overall, while technology and consumer discretionary sectors led the rally, energy lagged behind due to oil price fluctuations, and healthcare exhibited a more nuanced performance.
ETF Insights
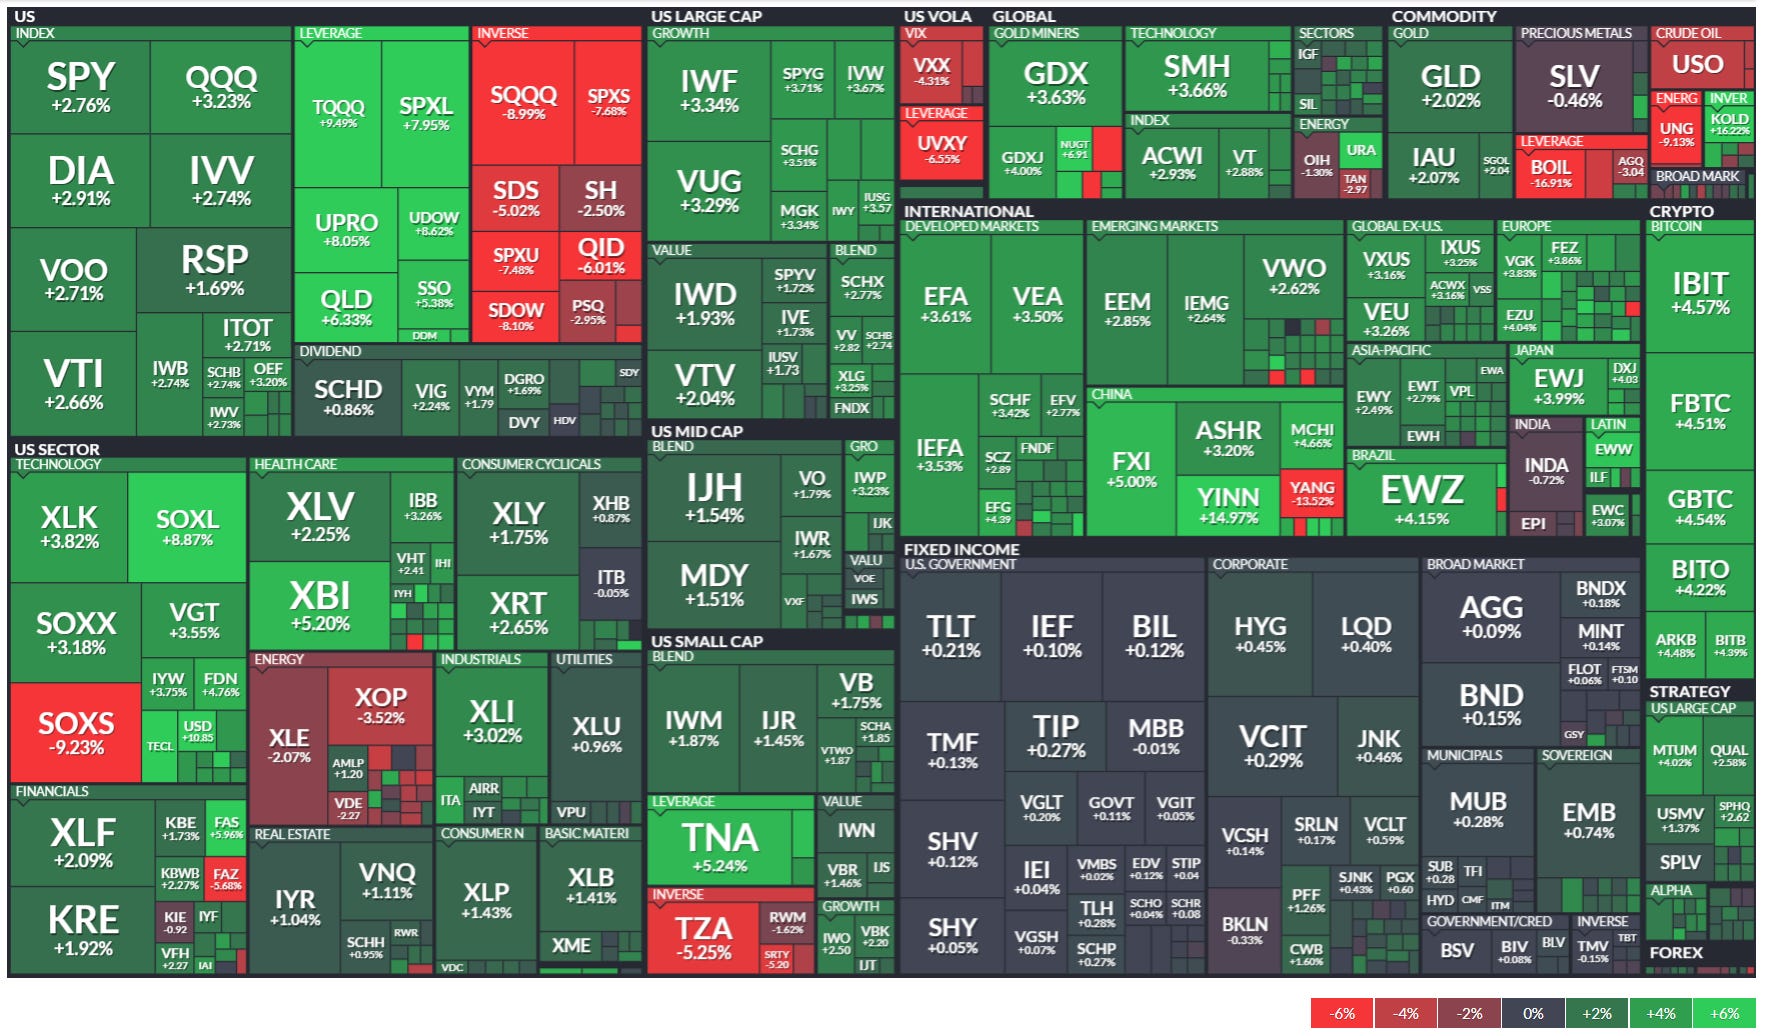
Over the past week, the performance of popular ETFs reflected a mix of optimism in growth sectors and lingering challenges in commodities and energy. Technology emerged as a clear leader, supported by easing bond yields and strong investor interest in AI and semiconductor demand, while energy and crude oil-related ETFs lagged due to declining oil prices and demand concerns. Other sectors, such as healthcare, financials, and consumer discretionary, also posted gains, underscoring the resilience of key areas of the economy.
Technology ETFs, such as XLK (+3.82%), led the rally, driven by favorable conditions for growth stocks as bond yields stabilized. Semiconductors played a major role, with SOXX (+3.18%) and the leveraged SOXL (+8.87%) benefiting from optimism around AI-related chip demand and improved supply chains. Conversely, the bearish SOXS (-9.23%) experienced significant losses, reflecting the sector's positive sentiment.
Healthcare ETFs had a strong week, with XBI (+5.20%) outpacing broader healthcare performance (XLV, +2.25%) as investors favored biotech companies following positive clinical trial updates and greater risk appetite. Meanwhile, financials also contributed to market gains, with XLF (+2.09%) and KRE (+1.92%) benefiting from higher interest rates that boosted net interest margins for banks. Regional banks, in particular, showed signs of stabilization after recent volatility.
The energy sector, however, struggled, with XLE (-2.07%) and XOP (-3.52%) declining in response to lower crude oil prices. Concerns over weakening global demand, coupled with rising inventories, weighed on oil prices and negatively impacted exploration and production companies. Meanwhile, gold ETFs such as GLD (+2.02%) gained on safe-haven demand and a weaker U.S. dollar, though silver ETFs like SLV (-0.46%) faced minor declines due to weaker industrial demand.
Consumer discretionary ETFs, including XLY (+1.75%), showed resilience as consumer spending trends remained positive. Homebuilder ETFs, like ITB (+0.03%), were flat despite easing mortgage rates, reflecting mixed housing market data. Industrial ETFs, such as XLI (+3.02%), gained from infrastructure spending and strong demand for aerospace and manufacturing goods.
International markets also performed well, with emerging market ETFs like EEM (+2.85%) rallying as the U.S. dollar weakened, making these economies more attractive to investors. Chinese ETFs, including FXI (+5.00%) and the leveraged YINN (+14.97%), led the way, bolstered by government stimulus measures and optimism about economic recovery efforts in China.
Cryptocurrency ETFs, such as BITO (+4.22%) and GBTC (+4.54%), saw significant gains as Bitcoin rallied on improved sentiment and growing regulatory clarity. Fixed income ETFs remained stable, with Treasury ETFs like TLT (+0.21%) and TMF (+0.13%) showing minor gains as bond yields eased, though overall demand remained subdued.
Overall, the week highlighted a shift toward growth and risk assets, with technology, healthcare, and consumer discretionary sectors leading gains. Meanwhile, energy faced headwinds from lower oil prices, and safe-haven assets like gold attracted interest. Emerging markets and cryptocurrencies also showed strength, reflecting improving sentiment and favorable macroeconomic trends. This performance underscores a market environment increasingly driven by optimism in growth sectors and selective risk-taking.
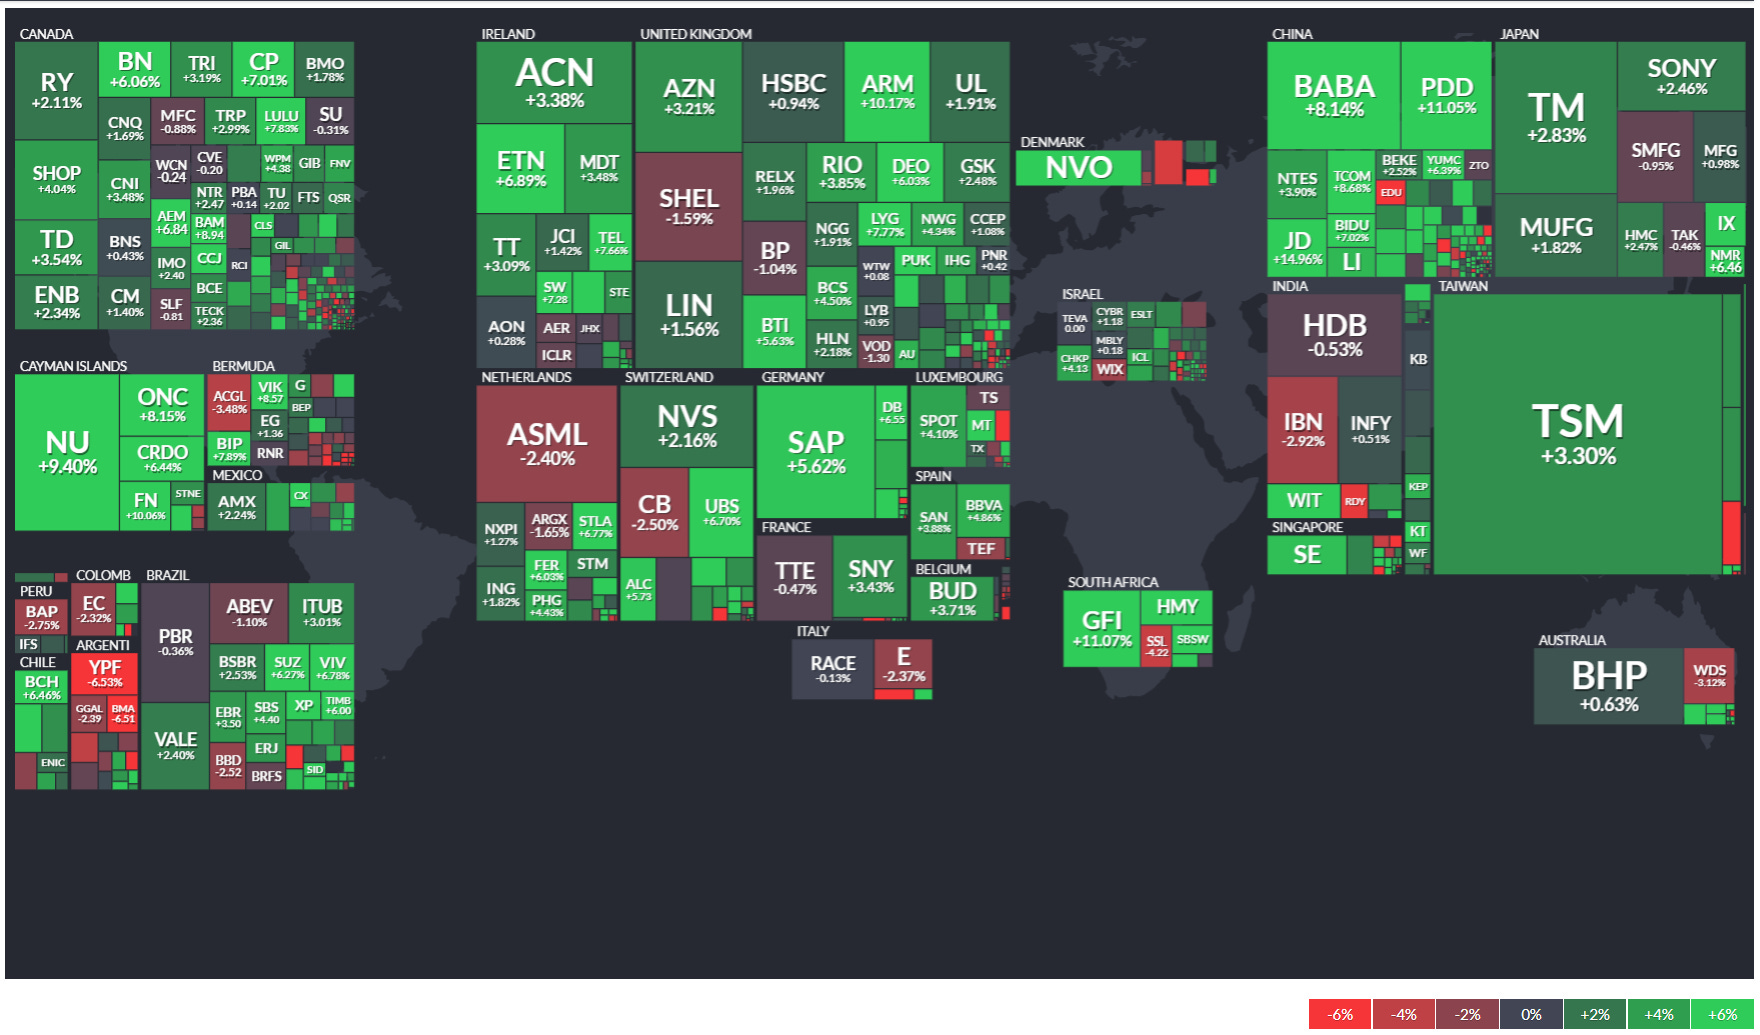
Global Overview

Special Coverage // The Trump-Trade: Anticipated Policy Changes Under Donald Trump’s Presidency and Their Market Impacts
Donald Trump’s presidency in 2025 brings a renewed focus on his well-known policy priorities, many of which stem from his previous administration and campaign promises. These policies are likely to impact various sectors of the market, creating opportunities and risks for investors. Below, we explore the anticipated policy changes and the sectors and specific companies that could be most affected, along with broader implications for the markets.
Tax Policies
Sectors to Watch: Technology, Industrials, Financials, Consumer Discretionary.
Top Tickers to Watch: Apple ( AAPL 0.02%↑ ), Caterpillar ( CAT 0.00%↑ ), Walmart ( WMT 0.00%↑ ), Target ( TGT -0.01%↓ ), Delta Air Lines ( DAL 0.00%↑ ).
One of the cornerstones of Trump’s economic agenda has always been tax reform. His previous administration introduced significant corporate tax cuts, and further reductions are likely to stimulate investment and earnings growth. Sectors such as technology, industrials, financials, and consumer discretionary are positioned to benefit. Middle-class tax cuts could also boost consumer spending, leading to growth in retail, travel, and other consumer-focused industries. Companies like Apple, Caterpillar, Walmart, and Delta Air Lines could see significant gains as a result.
However, it’s important to note that tax changes are coming that may go beyond Trump’s earlier framework. While the election was not fought over tax policy, discussions around tax reforms will likely dominate the next few years. A potential “Rothification” of retirement savings—a shift to taxing retirement savings upfront rather than upon withdrawal—could alter how investors think about saving for retirement and significantly impact retirement-focused investment strategies.
Deregulation
Sectors to Watch: Energy, Financials, Technology.
Top Tickers to Watch: ExxonMobil ( XOM 0.00%↑ ), Halliburton ( HAL 0.00%↑ ), Bank of America ( BAC 0.00%↑ ), Coinbase ( COIN 0.02%↑ ).
Reducing regulatory burdens is expected to continue as a priority, particularly in the energy and financial sectors. Easing restrictions on fossil fuel extraction could bolster oil, gas, and coal industries, while financial deregulation may enhance profitability for banks and insurance companies. Firms such as ExxonMobil, Halliburton, Bank of America, and Goldman Sachs are likely to experience positive impacts from these changes.
Additionally, a theme of the upcoming Trump administration may be a “lighter touch” from regulators, especially around cryptocurrencies. Investors will need to exercise caution as scams and fraud in the crypto market remain prevalent. Congress may consider legislation for a regulatory framework. For now, the crypto market is likely to operate under a “buyer beware” philosophy, making due diligence and reliable exchanges critical for investors.
Trade Policies
Sectors to Watch: Agriculture, Manufacturing, Technology.
Top Tickers to Watch: Tesla ( TSLA -0.17%↓ ), Nike ( NKE 0.00%↑ ), Deere & Co. ( DE 0.00%↑ ), Boeing ( BA 0.00%↑ ).
Trump’s “America First” trade agenda could result in the reintroduction of tariffs on imports and a renegotiation of trade agreements. While protectionist measures may disrupt supply chains, sectors like agriculture and manufacturing could benefit from favorable terms in new trade deals. Companies such as Tesla, Nike, Deere & Co., and Boeing are worth watching as trade policies evolve.
Infrastructure Investment
Sectors to Watch: Construction, Materials, Industrials.
Top Tickers to Watch: United Rentals ( URI 0.00%↑ ), Vulcan Materials ( VMC 0.00%↑ ), Jacobs Engineering ( J 0.00%↑ ).
Trump has consistently emphasized the need for substantial infrastructure spending, a move that would drive growth in construction, materials, and industrial sectors. Increased demand for equipment rentals, aggregates, and engineering services could benefit companies like United Rentals, Vulcan Materials, and Jacobs Engineering.
Healthcare Reforms
Sectors to Watch: Healthcare Providers, Pharmaceuticals, Telehealth.
Top Tickers to Watch: UnitedHealth Group ( UNH 0.00%↑ ), Pfizer ( PFE 0.00%↑), Teladoc Health ( TDOC 0.00%↑ ).
Revisiting or repealing parts of the Affordable Care Act could create uncertainty but also opportunities in the healthcare sector. Insurance providers, pharmaceutical companies, and telehealth firms such as UnitedHealth Group, Pfizer, and Teladoc Health may experience significant impacts depending on the nature of the reforms.
Immigration Policies
Sectors to Watch: Agriculture, Construction, Hospitality.
Top Tickers to Watch: Marriott International ( MAR 0.00%↑ ), Archer-Daniels-Midland ( ADM 0.00%↑ ), Lennar Corporation ( LEN 0.00%↑ ).
Restrictive immigration policies could increase labor costs for industries reliant on immigrant workers, such as agriculture, construction, and hospitality. Companies like Marriott International, Archer-Daniels-Midland, and Lennar Corporation could face challenges in maintaining profitability under such policies.
Defense Spending
Sectors to Watch: Aerospace, Defense, Technology.
Top Tickers to Watch: Lockheed Martin ( LMT 0.00%↑ ), Northrop Grumman ( NOC 0.00%↑ ), Raytheon Technologies ( RTX 0.00%↑ ).
Increased defense budgets are likely to benefit the aerospace and defense sectors, with companies like Lockheed Martin, Northrop Grumman, and Raytheon Technologies poised to gain from expanded military contracts and investments in advanced technologies.
Federal Reserve and Interest Rates
Sectors to Watch: Financials, Real Estate, Consumer Staples.
Top Tickers to Watch: Wells Fargo ( WFC 0.00%↑ ), Realty Income ( O 0.00%↑ ), Procter & Gamble ( PG 0.00%↑ ).
Although Trump does not control the Federal Reserve, his administration may advocate for accommodative monetary policies to boost growth. This could influence financials, real estate, and consumer staples, with firms such as Wells Fargo, Realty Income, and Procter & Gamble which are particularly sensitive to interest rate changes.
Environmental, Social, and Governance (ESG) Investing
Sectors to Watch: ESG-focused Funds, Renewable Energy, Workplace Retirement Plans.
Top Tickers to Watch: iShares ESG Aware MSCI USA ETF ( ESGU 0.00%↑ ), First Solar ( FSLR 0.00%↑ ), NextEra Energy ( NEE 0.00%↑ ).
The Trump administration’s hostility toward ESG-focused investing is expected to have minimal impact on individual investors. Those who value ESG analysis can still incorporate it into their strategies, but workplace retirement accounts like 401(k)s may largely avoid ESG options due to regulatory challenges for plan sponsors. This could discourage employers from offering these options to their employees.
Convergence of Public and Private Markets
Sectors to Watch: Private Equity, Alternative Investments, Retail Investing Platforms.
Top Tickers to Watch: Blackstone ( BX 0.00%↑ ), KKR & Co. ( KKR 0.00%↑ ), Robinhood Markets ( HOOD 0.00%↑ ).
Private markets, historically accessible only to accredited and institutional investors, have gradually opened to retail investors. Regulators at the SEC and Department of Labor are expected to facilitate this trend by easing restrictions.
Market Sentiment and Volatility
Trump’s policy agenda and communication style are likely to contribute to market volatility. Monitoring indices like the CBOE Volatility Index ( $VIX ) and ETFs such as SPDR S&P 500 ( SPY -0.03%↓ ) and Invesco QQQ Trust ( QQQ 0.00%↑ ) can provide insights into market sentiment and sector-specific trends. As these policies unfold, they will create a dynamic environment for investors, offering both opportunities and risks.
As Donald Trump takes the helm in 2025, it is clear that his policies could have a profound impact on financial markets. From tax reforms and deregulation to shifts in trade policies and infrastructure investments, the effects will be felt across industries and sectors. In addition to the dynamics of new presidential leadership, the broader economic landscape will continue to be shaped by Federal Reserve policies and global geopolitical tensions. For investors, these changes bring both opportunities to capitalize on growth and risks to navigate carefully.

US Investor Sentiment
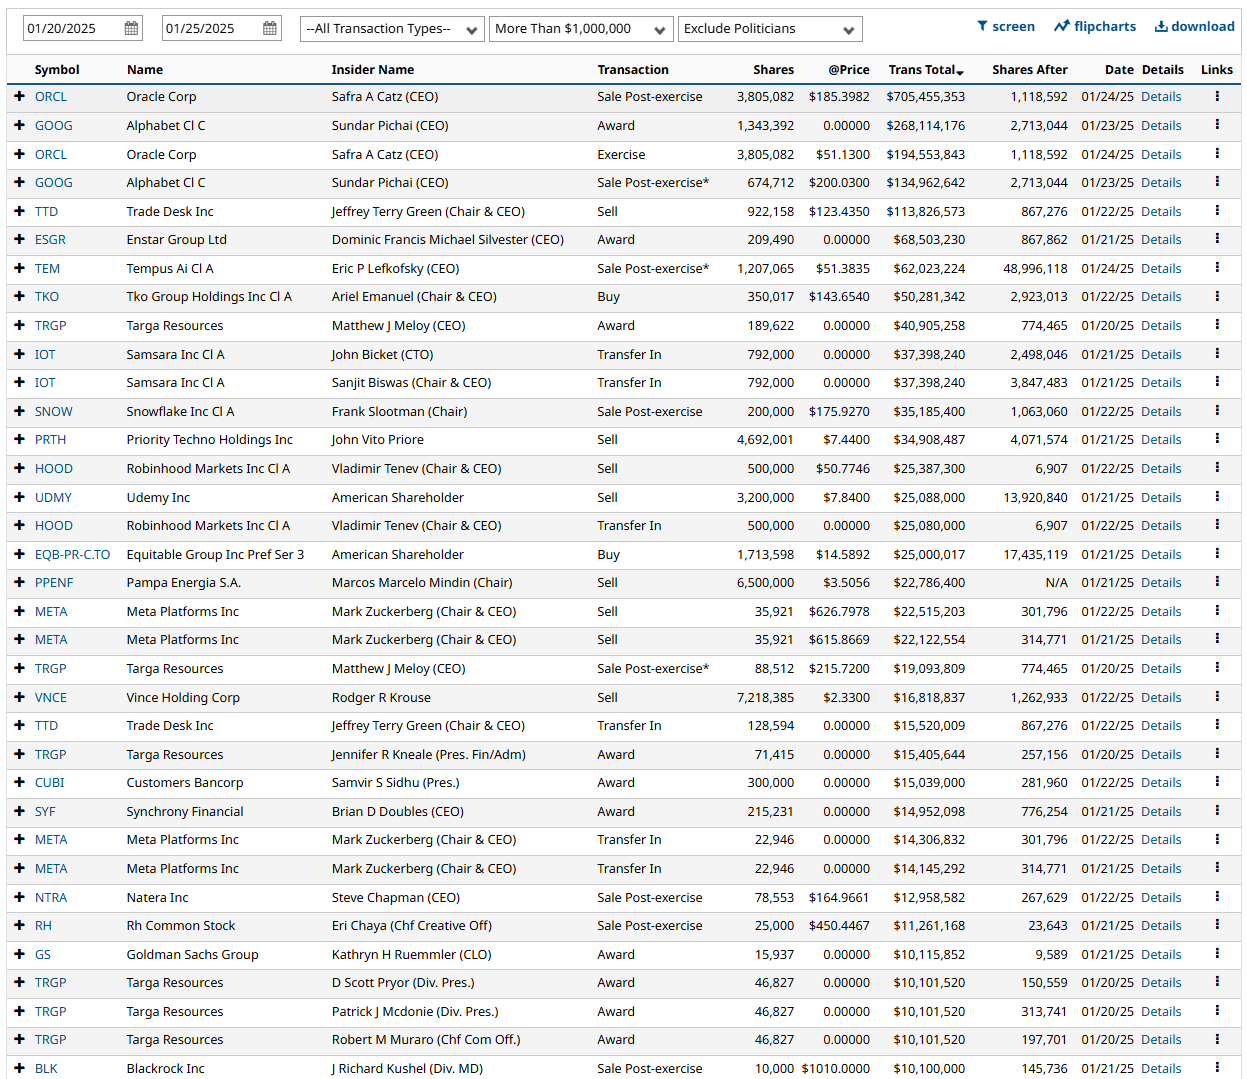
Insider Trading
Insider trading occurs when a company’s leaders or major shareholders trade stock based on non-public information. Tracking these trades can reveal insider expectations about the company’s future. For example, large purchases before an earnings report or drug trial results might indicate confidence in upcoming good news.
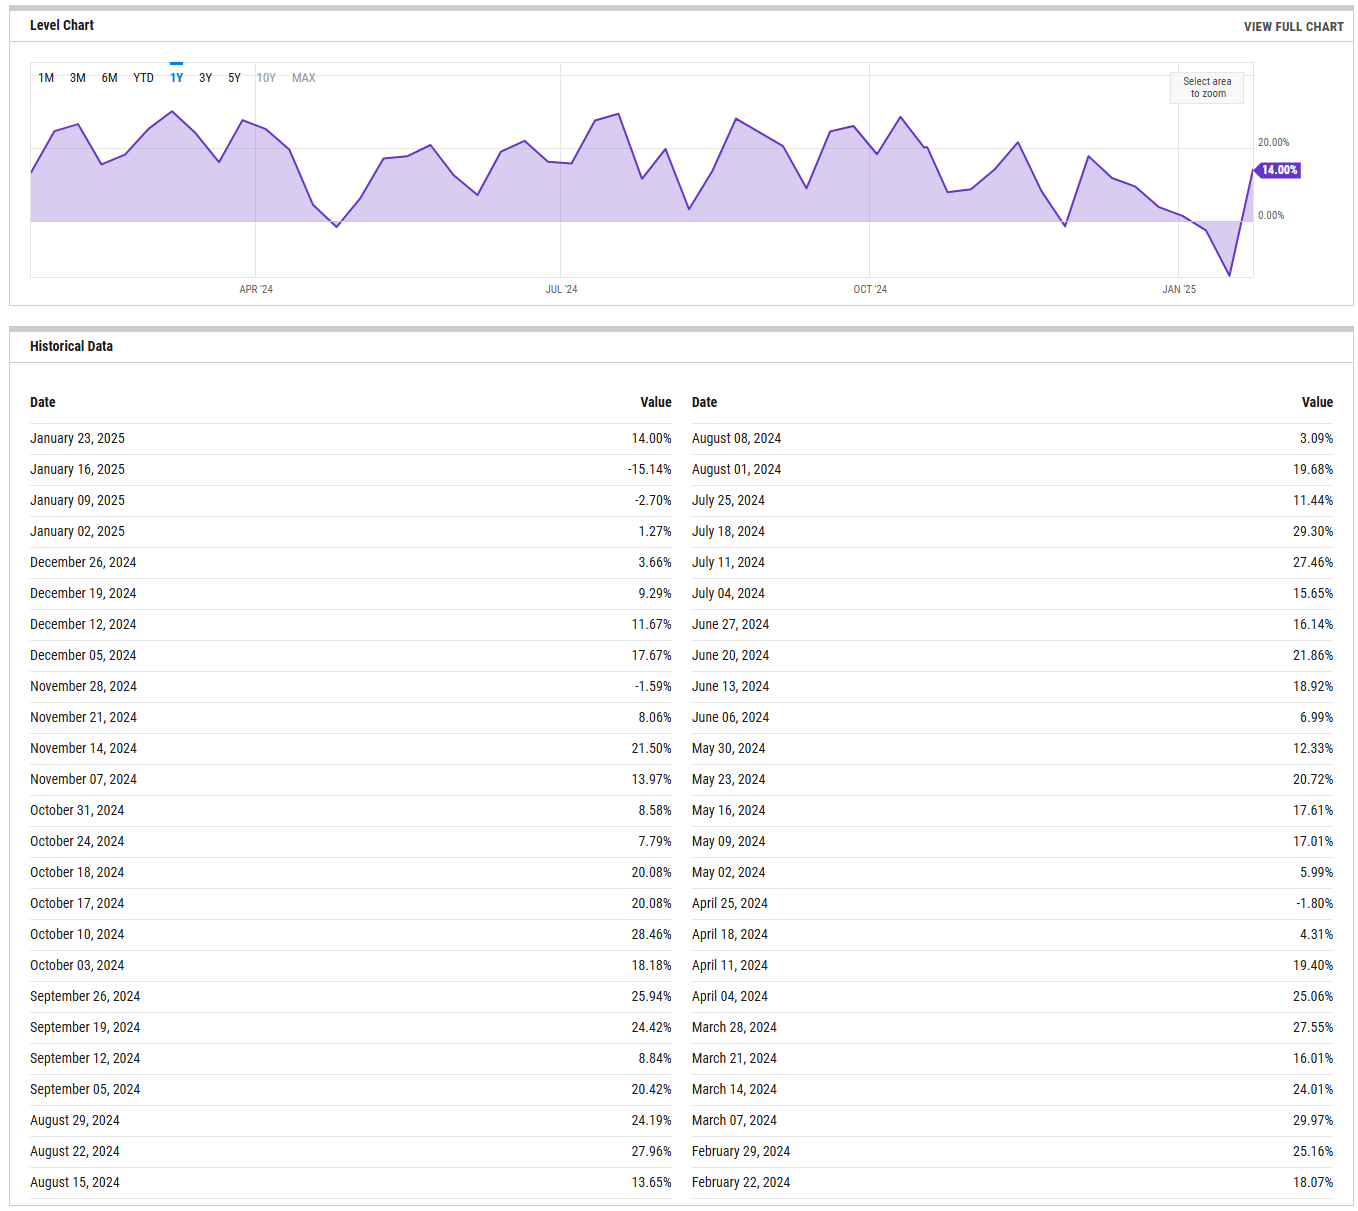
%Bull-Bear Spread
The %Bull-Bear Spread chart is a sentiment indicator that shows the difference between the percentage of bullish and bearish investors, often derived from surveys or sentiment data, such as the AAII (American Association of Individual Investors) sentiment survey. This spread tells investors about the prevailing mood in the market and can provide insights into market extremes and potential turning points.
Bullish or Bearish Sentiment:
When the spread is positive, it means more investors are bullish than bearish, indicating optimism about the market’s direction.
A negative spread indicates more bearish sentiment, meaning more investors expect the market to decline.
Contrarian Indicator:
The %Bull-Bear Spread is often used as a contrarian indicator. For example, extremely high levels of bullish sentiment might suggest that the market is overly optimistic and could be due for a correction.
Similarly, when bearish sentiment is extremely high, it might indicate that the market is overly pessimistic, and a rally could be on the horizon.
Market Extremes and Reversals:
Historically, extreme values of the spread (both positive and negative) can signal turning points in the market. A very high positive spread can signal market exuberance, while a very low or negative spread may indicate fear or capitulation.
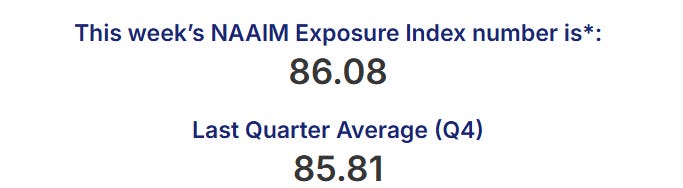
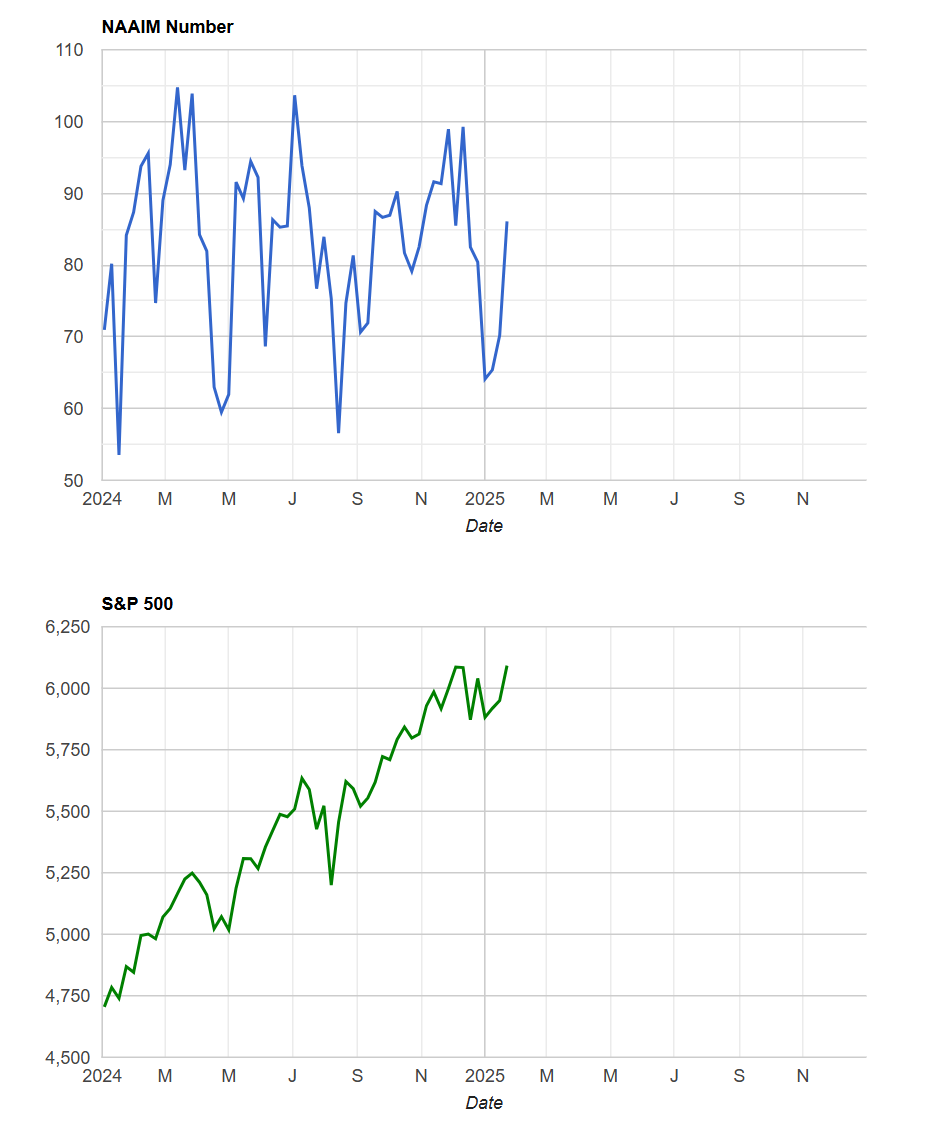
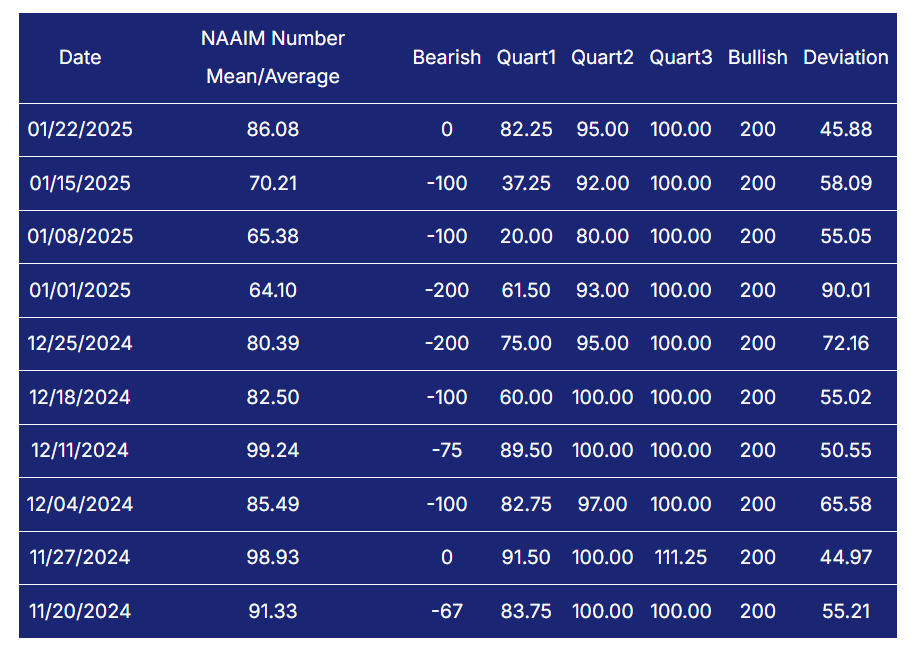
NAAIM Exposure Index
The NAAIM Exposure Index (National Association of Active Investment Managers Exposure Index) measures the average exposure to U.S. equity markets as reported by its member firms. These are typically active money managers who provide their equity exposure levels weekly. The index offers insight into how much these managers are investing in equities at any given time, ranging from being fully short (-100%) to leveraged long (up to +200%).
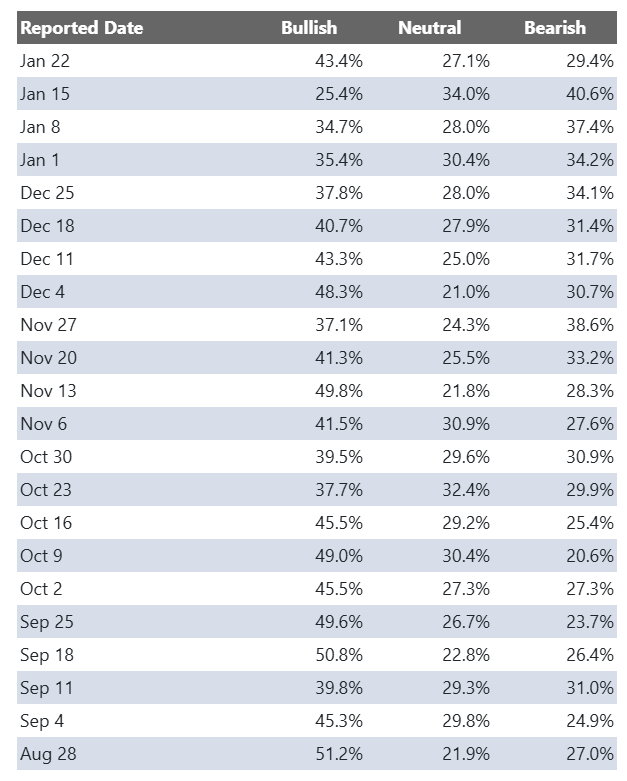
AAII Investor Sentiment Survey
The AAII Investor Sentiment Survey is a weekly survey conducted by the American Association of Individual Investors (AAII) to gauge the mood of individual investors regarding the direction of the stock market over the next six months. It provides insights into whether investors are feeling bullish (expecting the market to rise), bearish (expecting the market to fall), or neutral (expecting the market to stay about the same).
Key Points:
Bullish Sentiment: Reflects the percentage of investors who believe the stock market will rise in the next six months.
Bearish Sentiment: Represents those who expect a decline.
Neutral Sentiment: Reflects investors who anticipate little to no market movement.
The survey is widely followed as a contrarian indicator, meaning that extreme levels of bullishness or bearishness can sometimes signal market turning points. For example, when a large number of investors are overly optimistic (high bullish sentiment), it could suggest a market top, while excessive pessimism (high bearish sentiment) may indicate a market bottom is near.

SPX Put/Call Ratio
The SPX Put/Call Ratio is an indicator that is used to gauge market sentiment. This is calculated as the ratio between trading S&P 500 put options and S&P call options. A high put/call ratio can indicate fear in the markets, while a low ratio indicates confidence. For example, in 2015, the Put-Call ratio was as high as 3.77 because of market fears stemming from various global economic issues like a GDP growth slowdown in China and a Greek debt default.
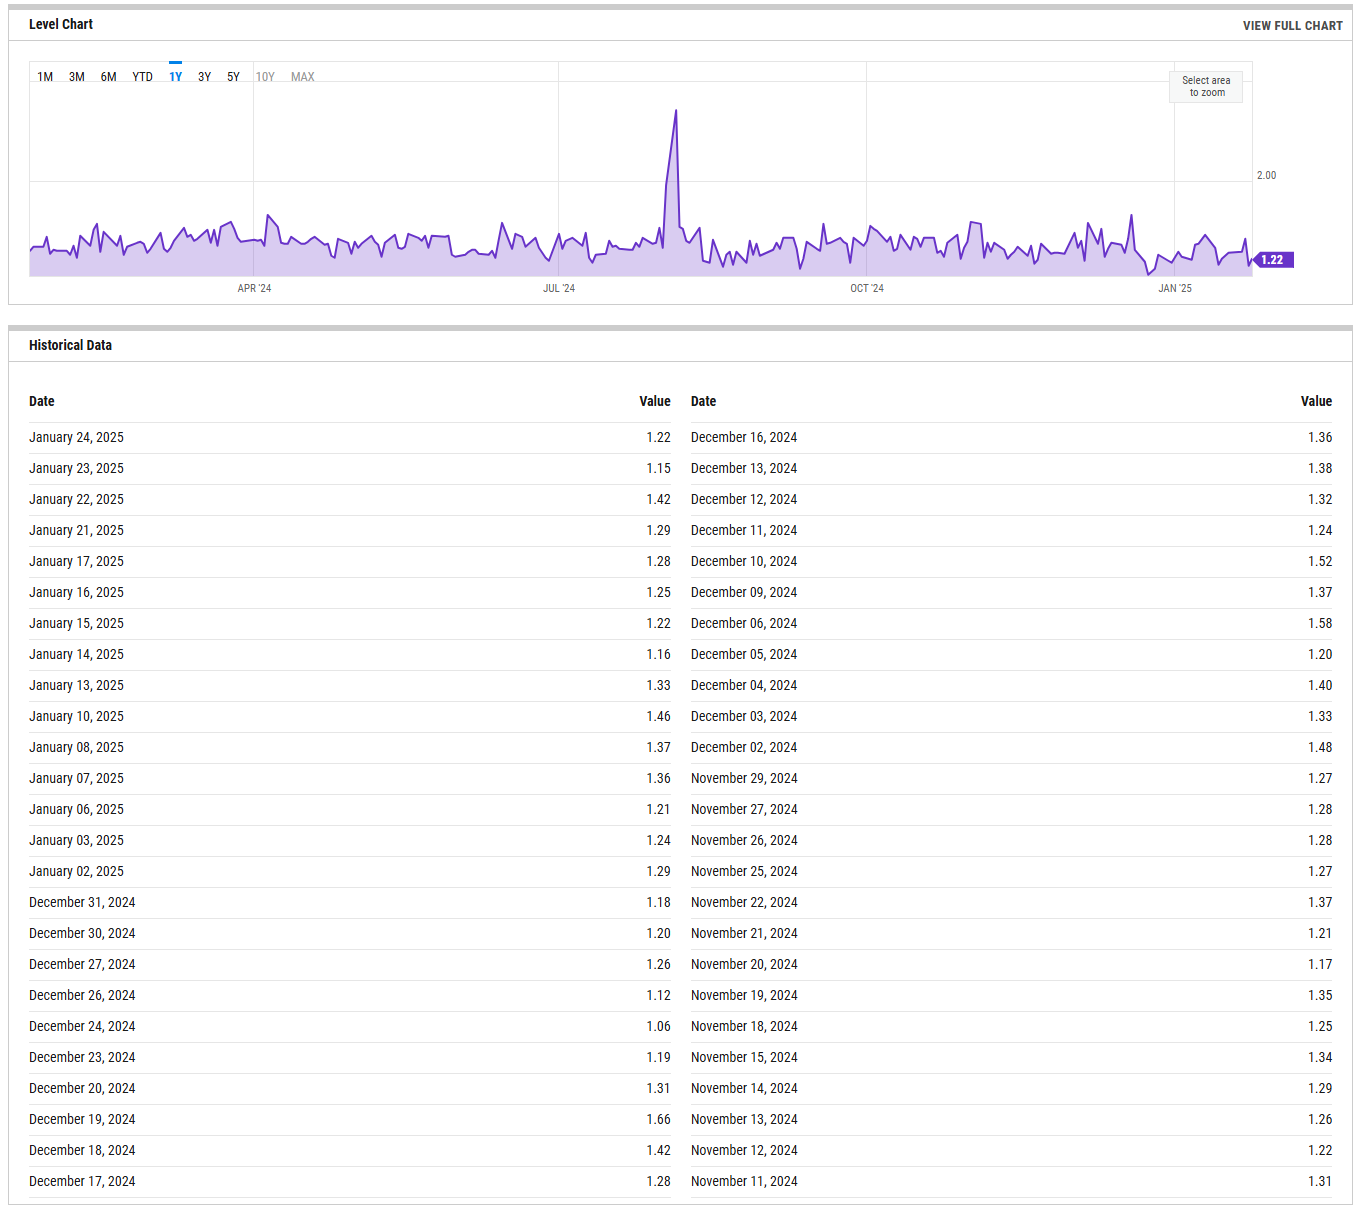
CBOE Equity Put/Call Ratio
The CBOE (Chicago Board Options Exchange) equity put/call ratio is a sentiment indicator used by traders and analysts to gauge market sentiment and potential shifts in investor behavior. It is calculated by dividing the volume of put options by the volume of call options on equities. Here’s what it reveals and how it is generally interpreted:
High Put/Call Ratio: When the put/call ratio is high (above 1.0), it suggests that there is more demand for put options than call options. This typically reflects a more bearish sentiment, as investors may be hedging against potential declines or expecting the market to fall.
Low Put/Call Ratio: Conversely, a low put/call ratio (below 0.7) indicates a higher volume of call options compared to puts, reflecting bullish sentiment. Investors may be expecting upward momentum and are positioning themselves to profit from price gains
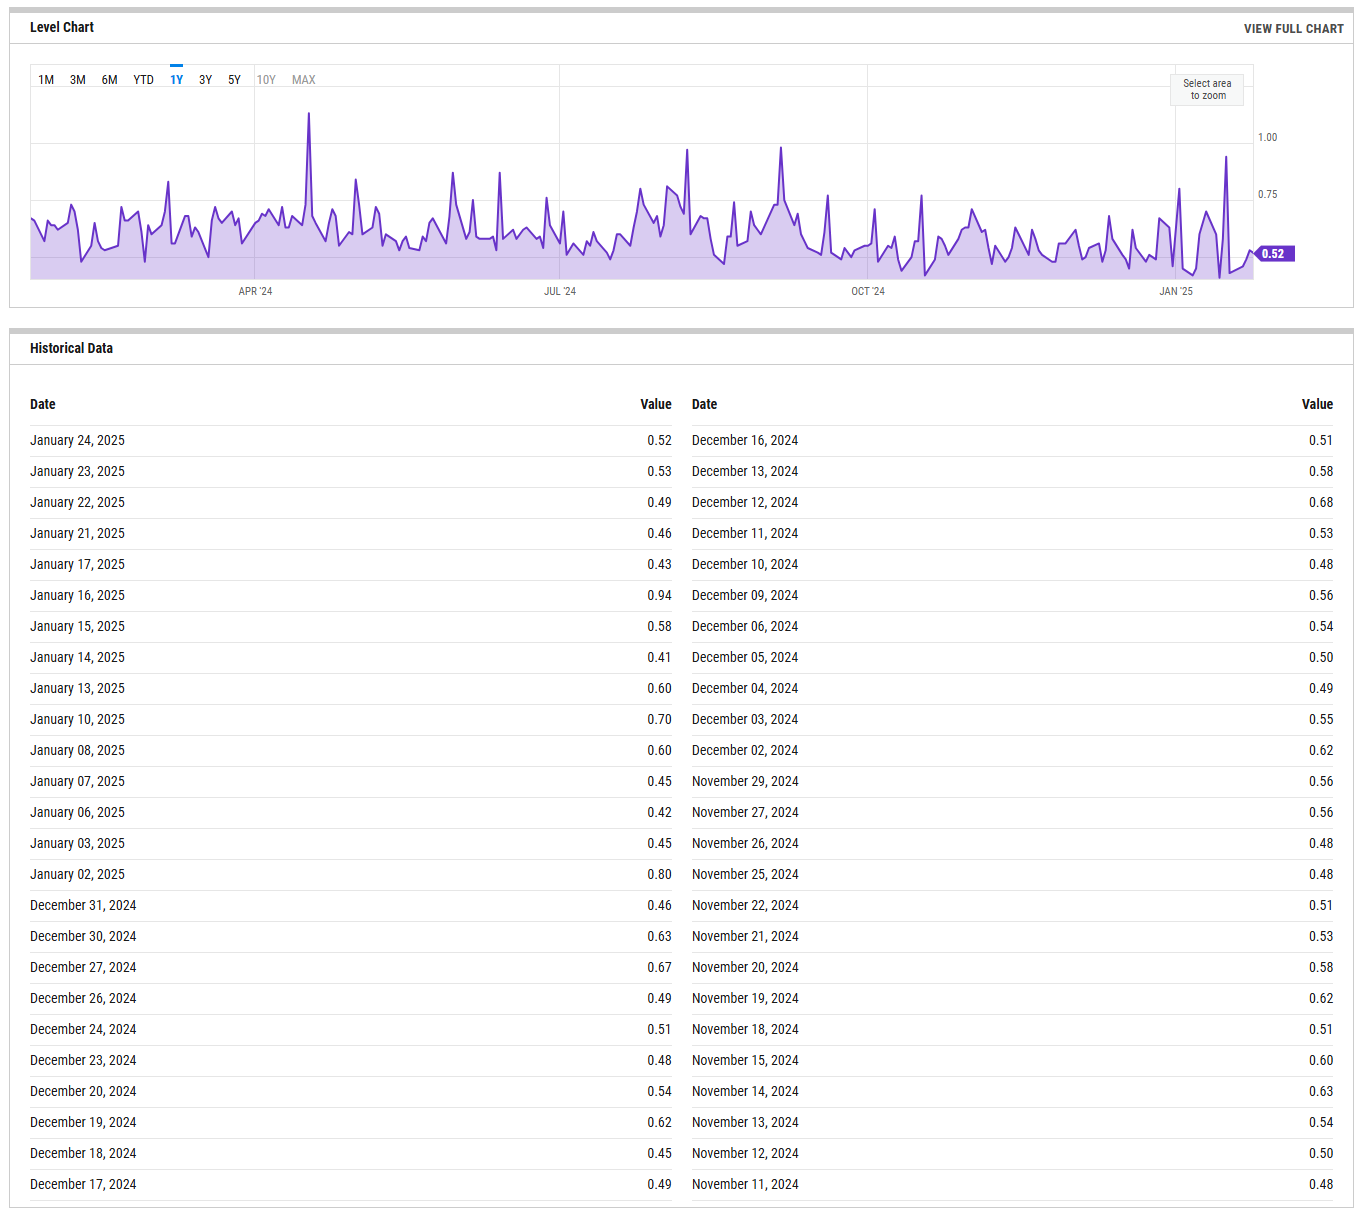
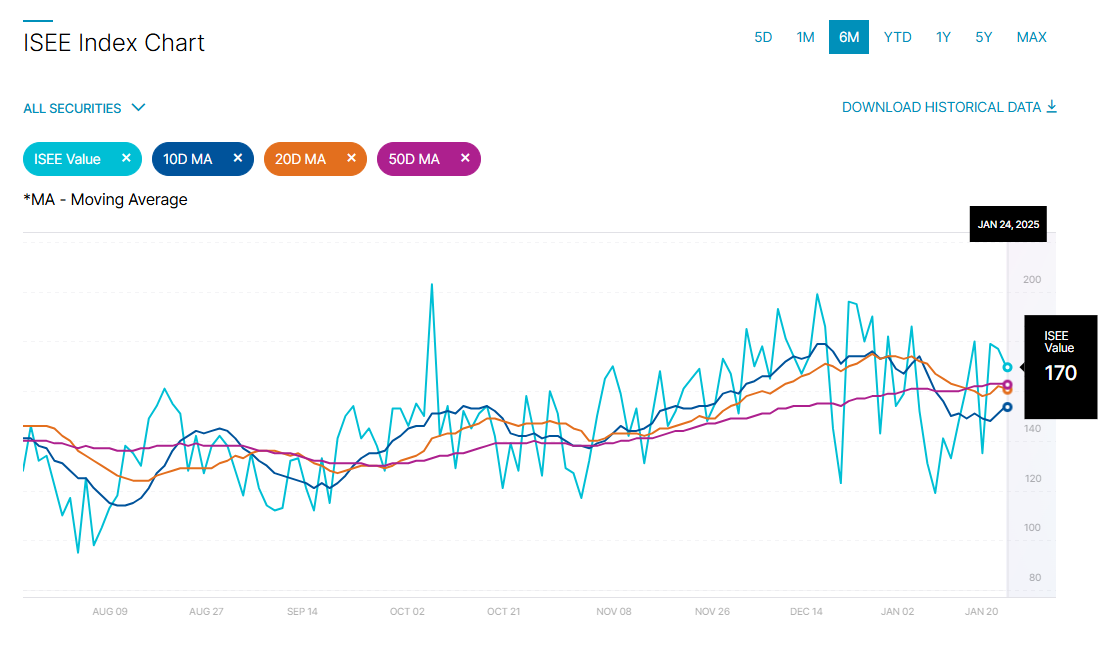
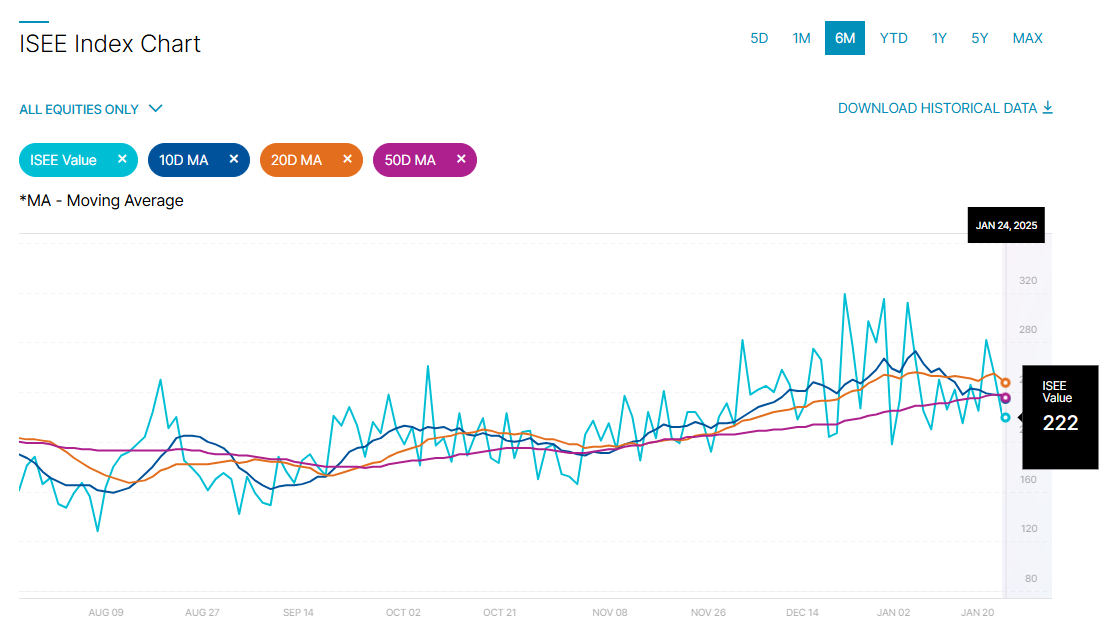
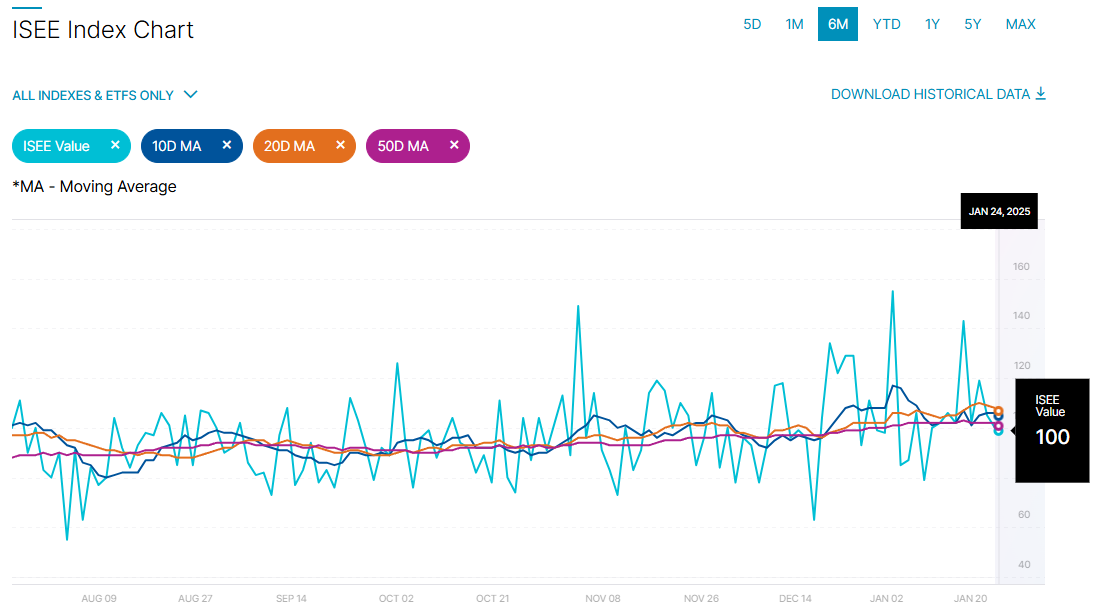
ISEE Sentiment Index
The ISEE (International Securities Exchange Sentiment) Index is a measure of investor sentiment derived from options trading. Unlike traditional put/call ratios, the ISEE Index focuses only on opening long customer transactions and is adjusted to remove market-maker and firm trades, providing a purer sentiment reading.
The ISEE Index typically ranges from 0 to 200, with readings above 100 indicating more call options being bought relative to put options, suggesting bullish sentiment. Conversely, readings below 100 suggest bearish sentiment, with more puts being purchased relative to calls.
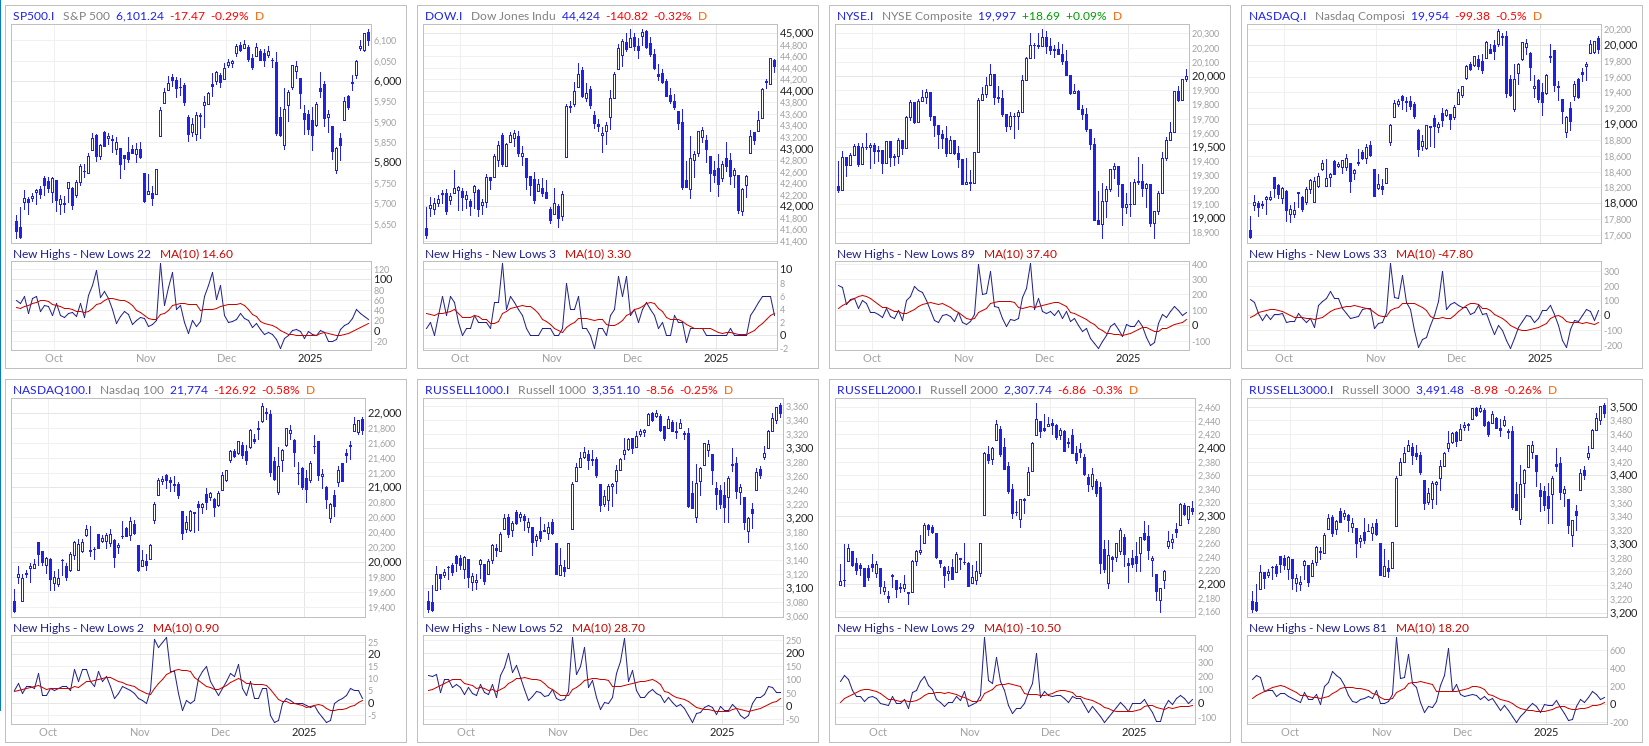
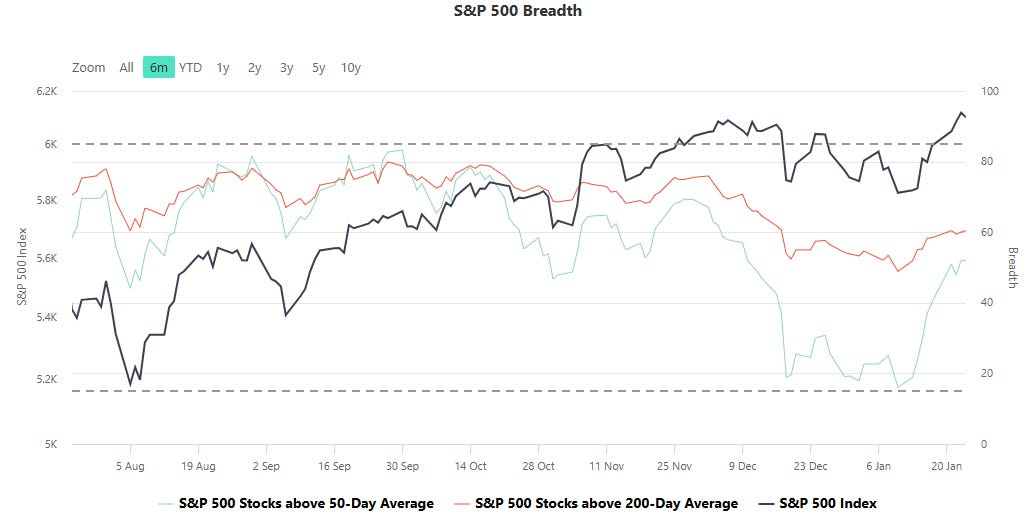
New Highs - New Lows
The New Highs - New Lows indicator (NH-NL) displays the daily difference between the number of stocks reaching new 52-week highs and the number of stocks reaching new 52-week lows. The NH-NL indicator generally reaches its extreme lows slightly before a major market bottom. As the market then turns up from the major bottom, the indicator jumps up rapidly. During this period, many new stocks are making new highs because it's easy to make a new high when prices have been depressed for a long time. The NH-NL indicator oscillates around zero. If the indicator is positive, the bulls are in control. If it is negative, the bears are in control. As the cycle matures, a divergence often occurs as fewer and fewer stocks are making new highs (the indicator falls), yet the market indices continue to reach new highs. This is a classic bearish divergence that indicates that the current upward trend is weak and may reverse.
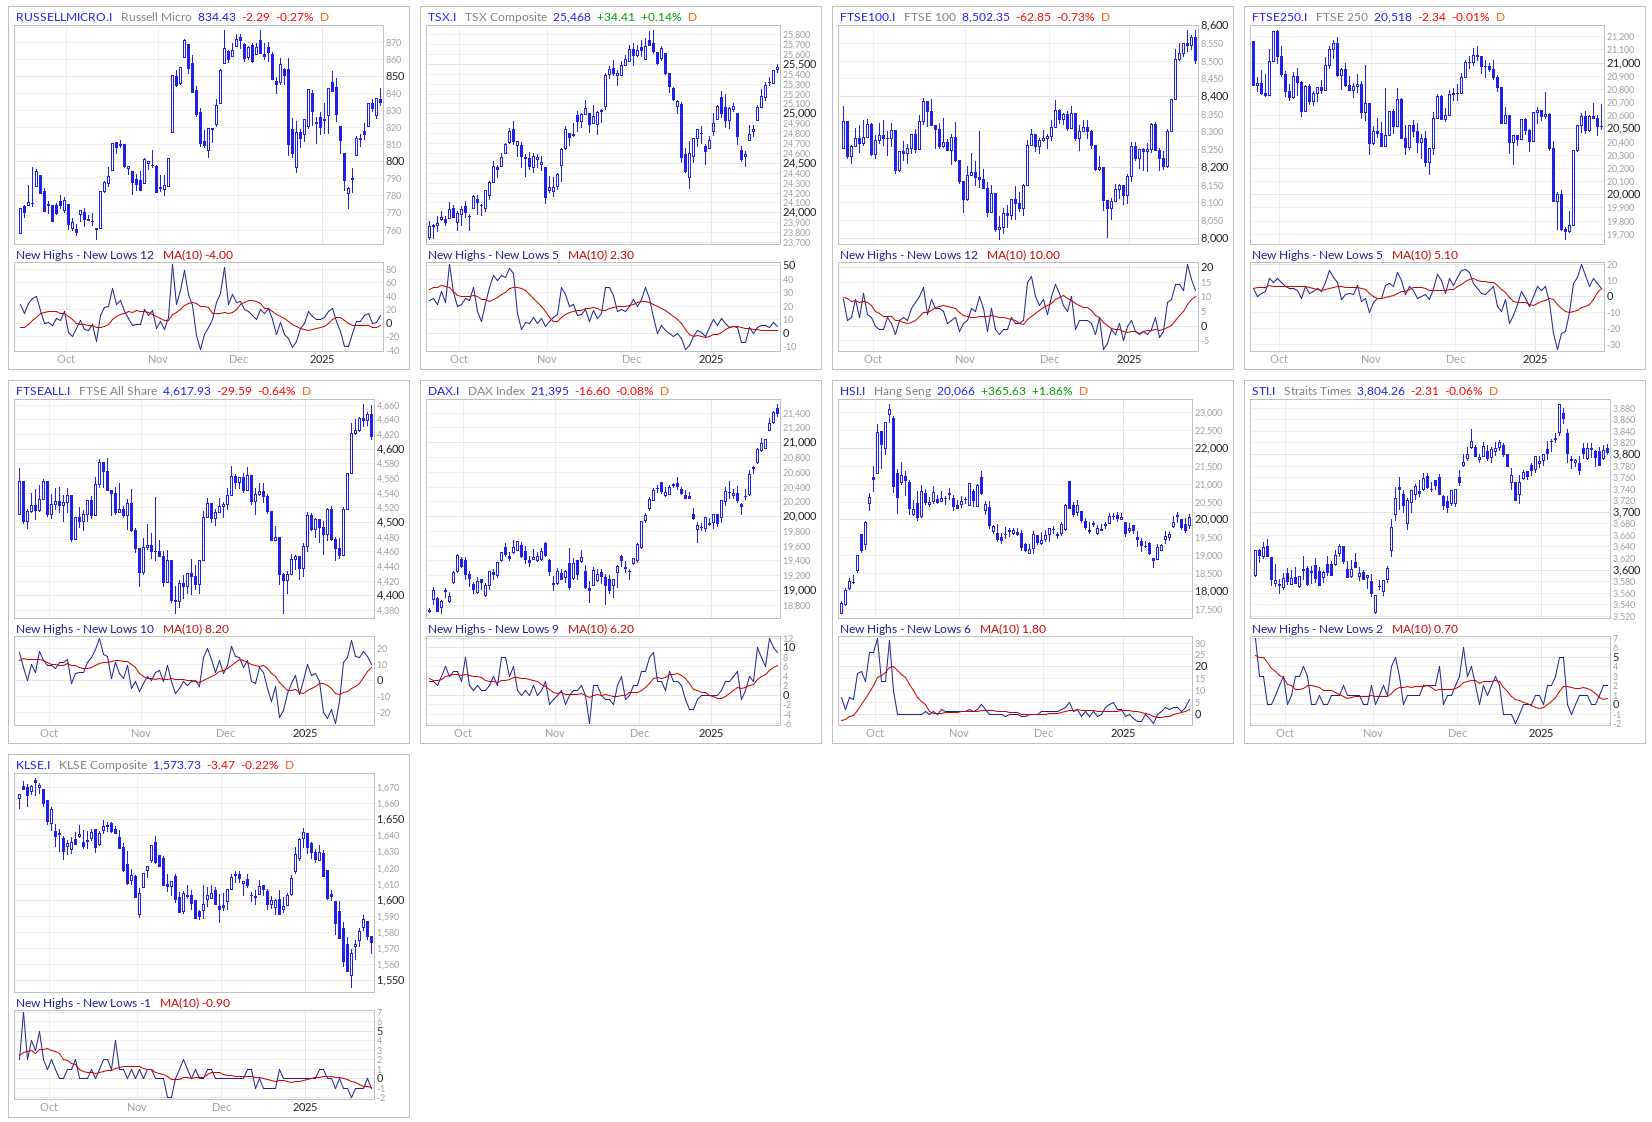
ARMS Index
The Arms Index, also known as the TRIN (Short-Term TRading INdex), was developed by Richard Arms in the 1960s. It is calculated by dividing the ratio of advancing stocks to declining stocks by the ratio of advancing volume to declining volume. Interpreting the Arms Index involves looking at its value in relation to certain thresholds. A value below "1" is considered bullish, indicating that advancing stocks and volume dominate the market. Conversely, a value above "1" is considered bearish, suggesting that declining stocks and volume are more prevalent. Extremely low values (below 0.5) or high values (above 2) are often seen as potential reversal signals.
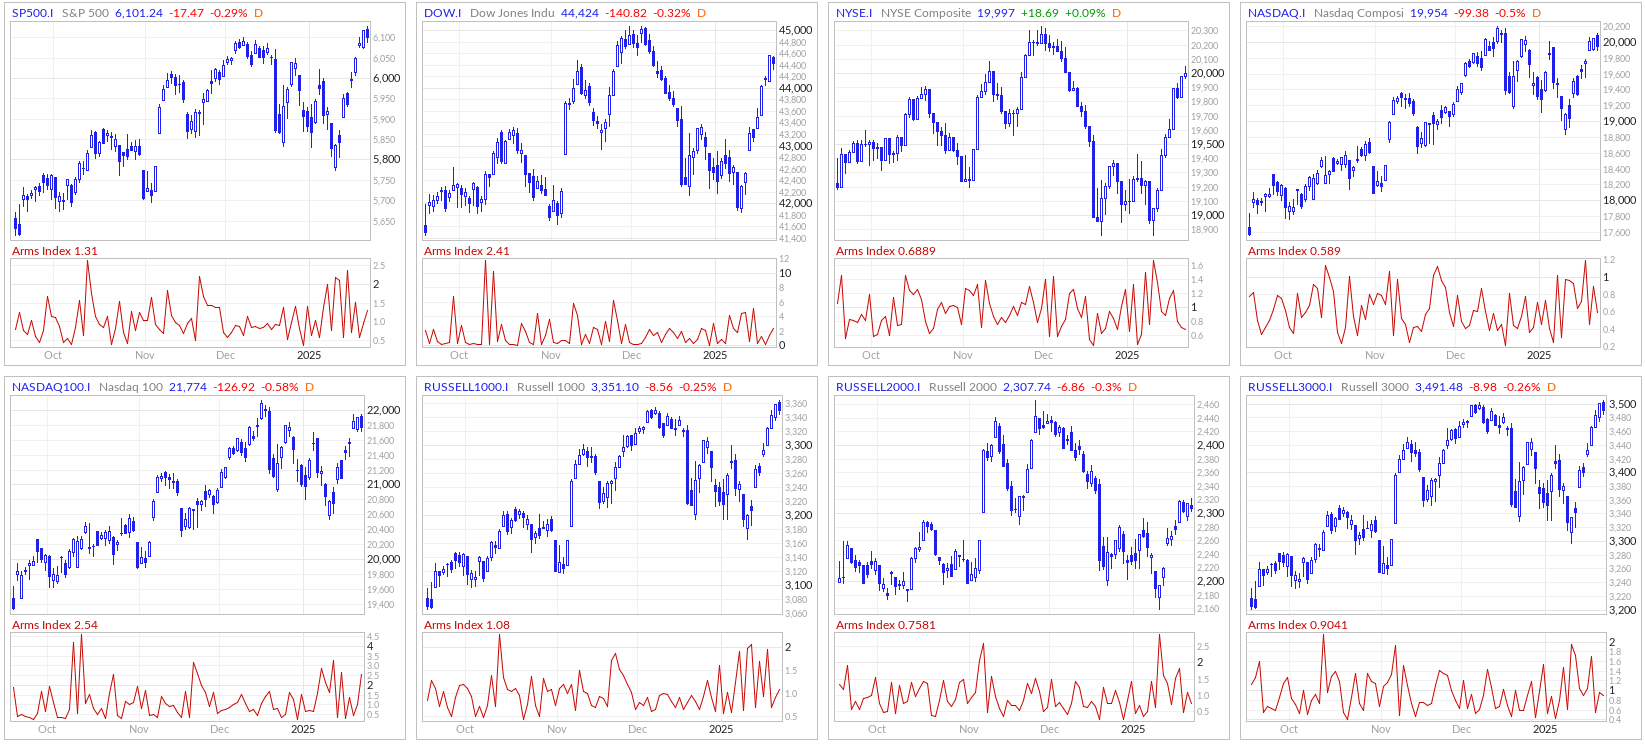
S&P Breadth
Breadth, in the context of stock market analysis, refers to the measure of how many stocks in a given index (such as the S&P 500) are participating in a trend, such as advancing or declining relative to a certain moving average (e.g., 50-day or 200-day).
Market Strength Assessment:
Breadth provides insight into whether a market rally or decline is broad-based or driven by only a few large-cap stocks. A rally supported by a high percentage of stocks above their 50-day or 200-day averages is generally considered healthier and more sustainable.
Early Warning Signals:
Divergences between breadth indicators and the index price can signal potential reversals. For example:
If the index is rising, but the number of stocks above their moving averages is declining, it may indicate weakening underlying strength and potential for a pullback.
Conversely, if breadth improves while the index remains flat or declines, it may suggest accumulating strength for a future rally.
Trend Confirmation:
Breadth indicators can confirm trends. For instance, a strong majority of stocks above their moving averages signals robust market momentum, providing confidence in the prevailing trend.
Identifying Overbought or Oversold Conditions:
Extremely high or low breadth readings can signal overbought or oversold conditions, which might lead to mean reversion. For example:
If nearly all stocks are above their 50-day or 200-day averages, it may suggest overbought conditions.
Conversely, extremely low levels indicate oversold conditions and potential for a bounce.
Breadth and Timing Investments:
Entry Points:
When breadth improves (e.g., more stocks move above their 50-day or 200-day moving averages) after a market pullback, it can indicate a good time to start building positions as the broader market is regaining strength.
Exit Points:
Breadth deterioration during a rally may suggest it’s time to reduce exposure, especially if only a small number of stocks are driving index gains. This is often a warning sign of an impending correction.
Volatility and Risk Management:
Weak breadth in volatile markets may prompt caution or defensive positioning. Conversely, improving breadth can justify taking on more risk during uptrends.
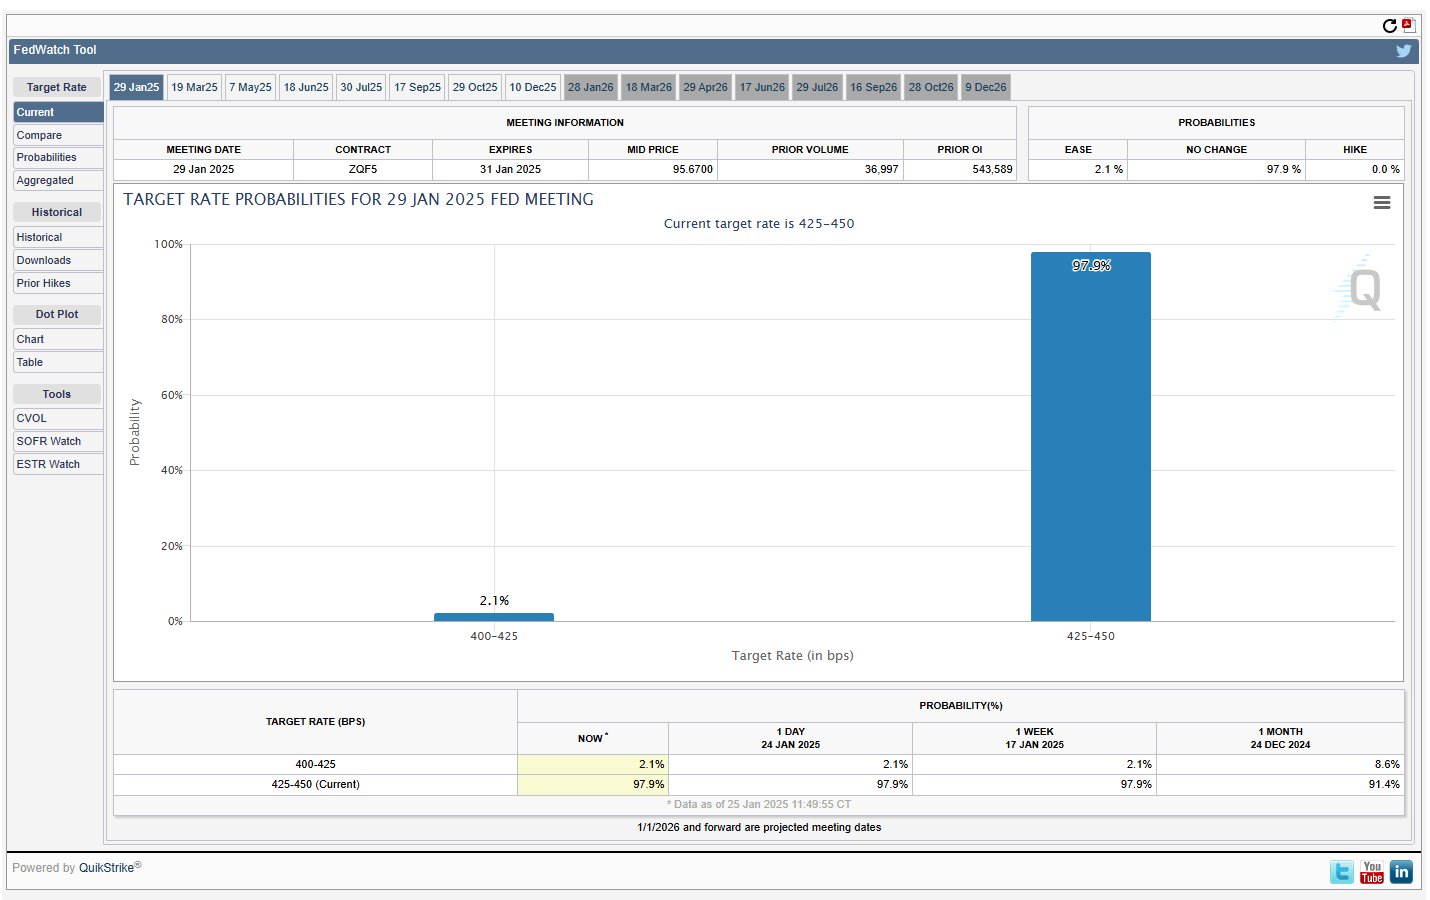
CME Fedwatch
What is the likelihood that the Fed will change the Federal target rate at upcoming FOMC meetings, according to interest rate traders? Use CME FedWatch to track the probabilities of changes to the Fed rate, as implied by 30-Day Fed Funds futures prices.
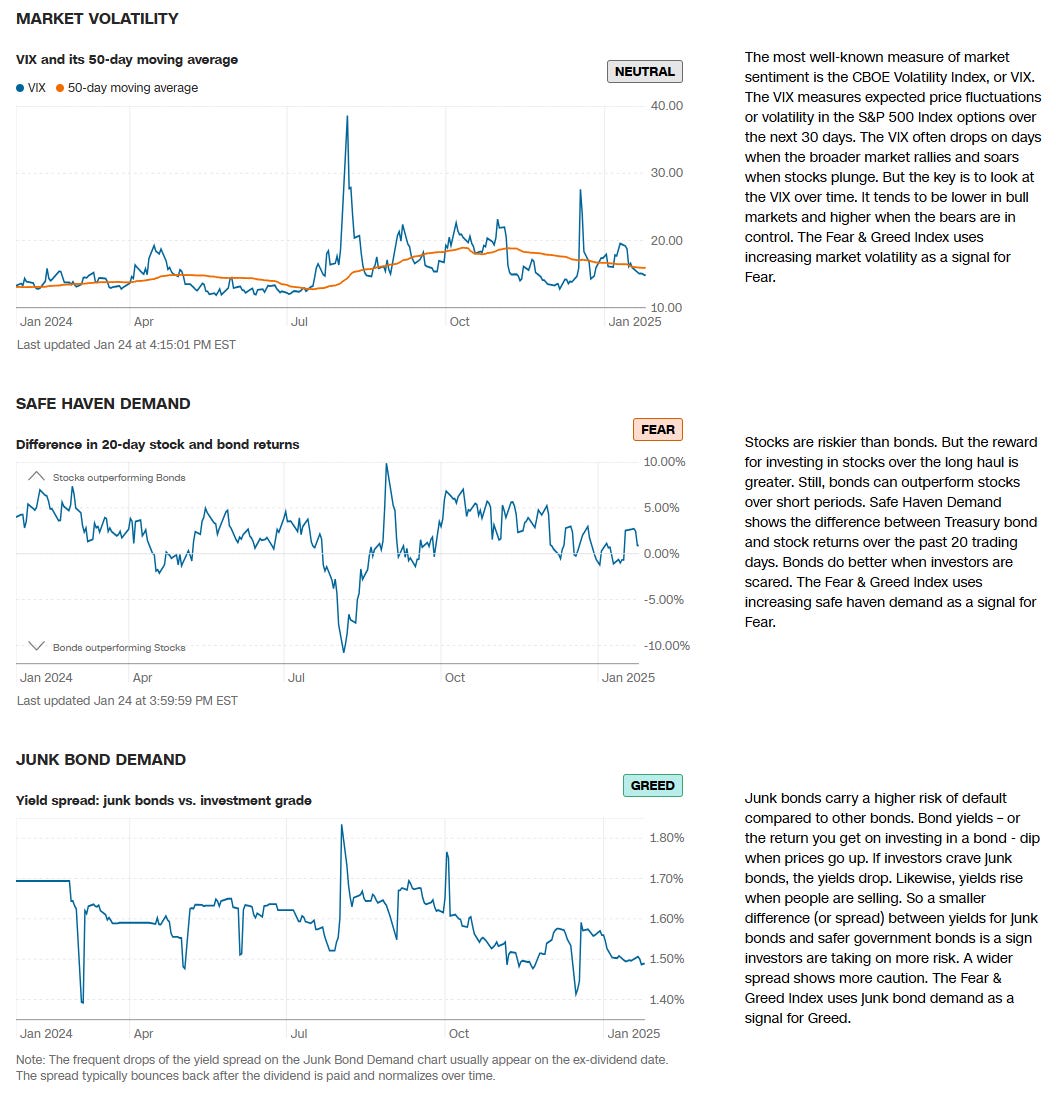
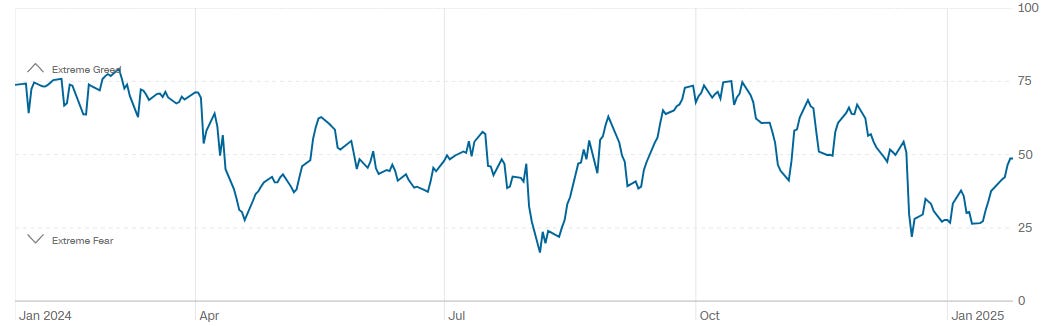
CNN Fear & Greed Constituent Data Points & Composite Index


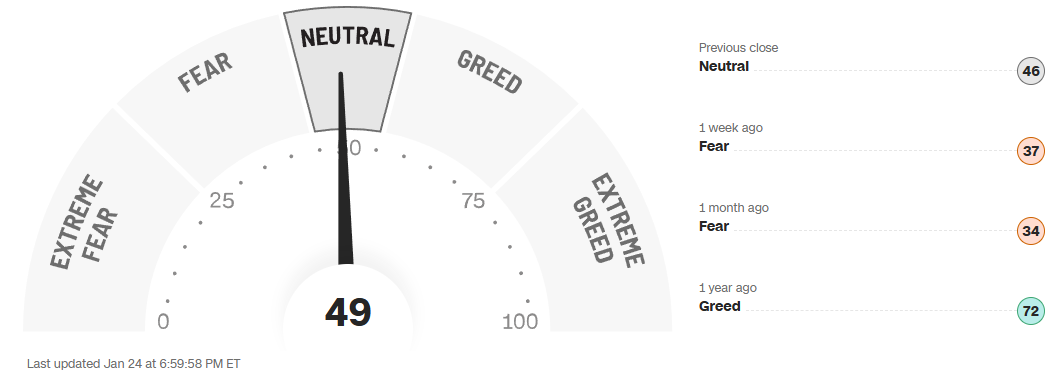
Final Composite Fear & Greed Index Reading
Institutional S/R Levels for Major Indices
When you’re a large institutional player, your primary goal is to find liquidity - places to do a ton of business with the least amount of slippage possible. VolumeLeaders.com automatically identifies and visually plots the exact spots where institutions are doing business and where they are likely to return for more. It’s one of the primary reasons “support” and “resistance” concepts work and truly one of the reasons “price has memory”.
Levels from the VolumeLeaders.com platform can help you formulate trades theses about:
Where to add or take profit
Where to de-risk or hedge
What strikes to target for options
Where to expect support or resistance
And this is just a small sample; there are countless ways to leverage this information into trades that express your views on the market. The platform covers thousands of tickers on multiple timeframes to accommodate all types of traders. Observe for yourself how accurate the levels are by marking-up your charts with the information in the “Trade Levels” boxes and play-along in real-time this week.
SPY -0.03%↓
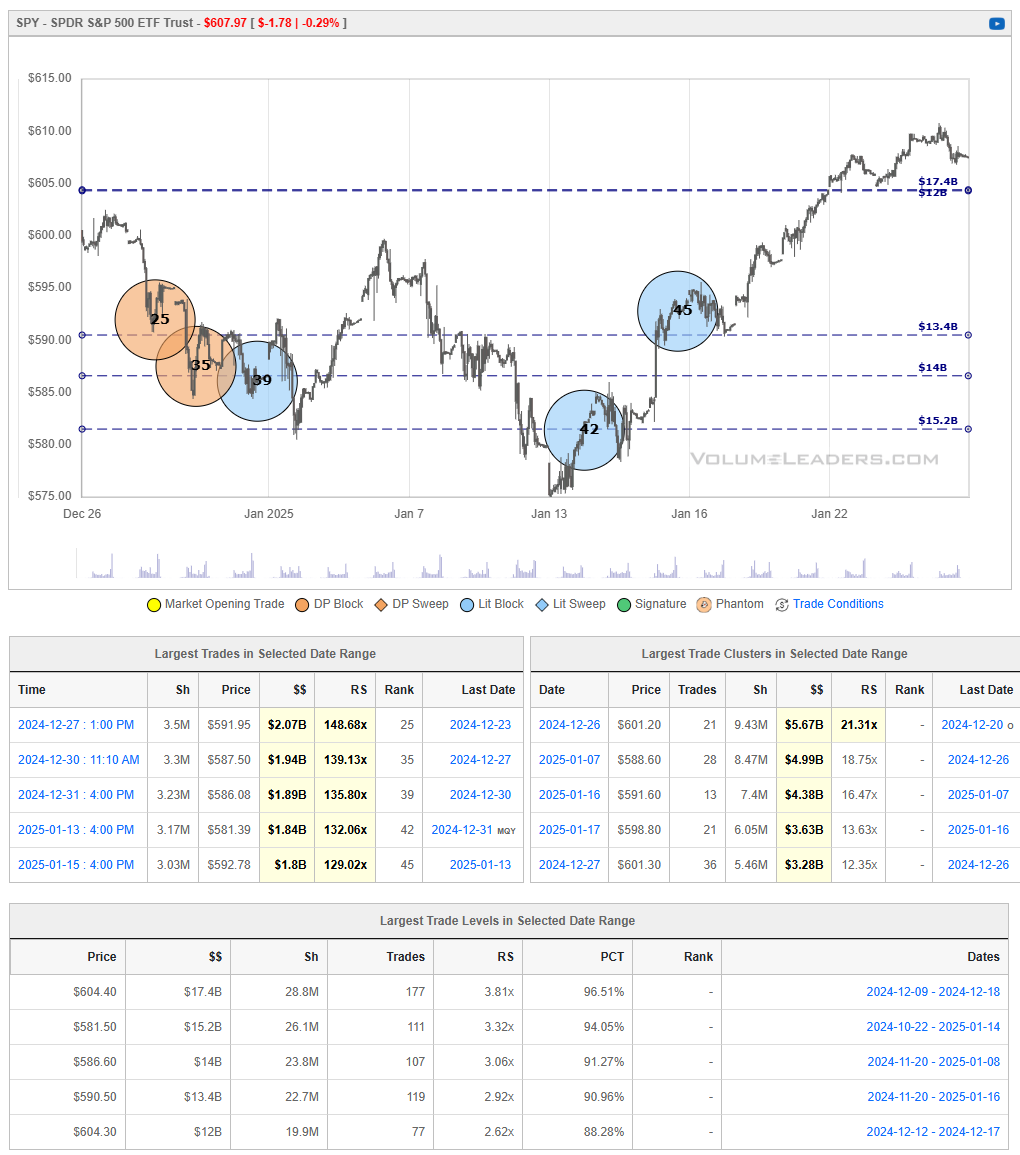
After rallying off its January lows near $580, SPY steadily cleared several layers of overhead supply in the $585–$595 region and briefly pushed above $605. This surge into the $610 zone marked a significant reclaiming of lost ground from late December. However, the ETF has pulled back slightly, hinting at profit‐taking or renewed selling pressure near these elevated levels.
If SPY can hold above $600–$605, it would reinforce that buyers remain in control, potentially paving the way for another run at $610 or higher. Conversely, a drop back below the $595 handle would indicate that near‐term supply is outstripping demand, raising the odds of a deeper retracement toward former support levels around $590 or even the mid‐$580s.
QQQ 0.00%↑
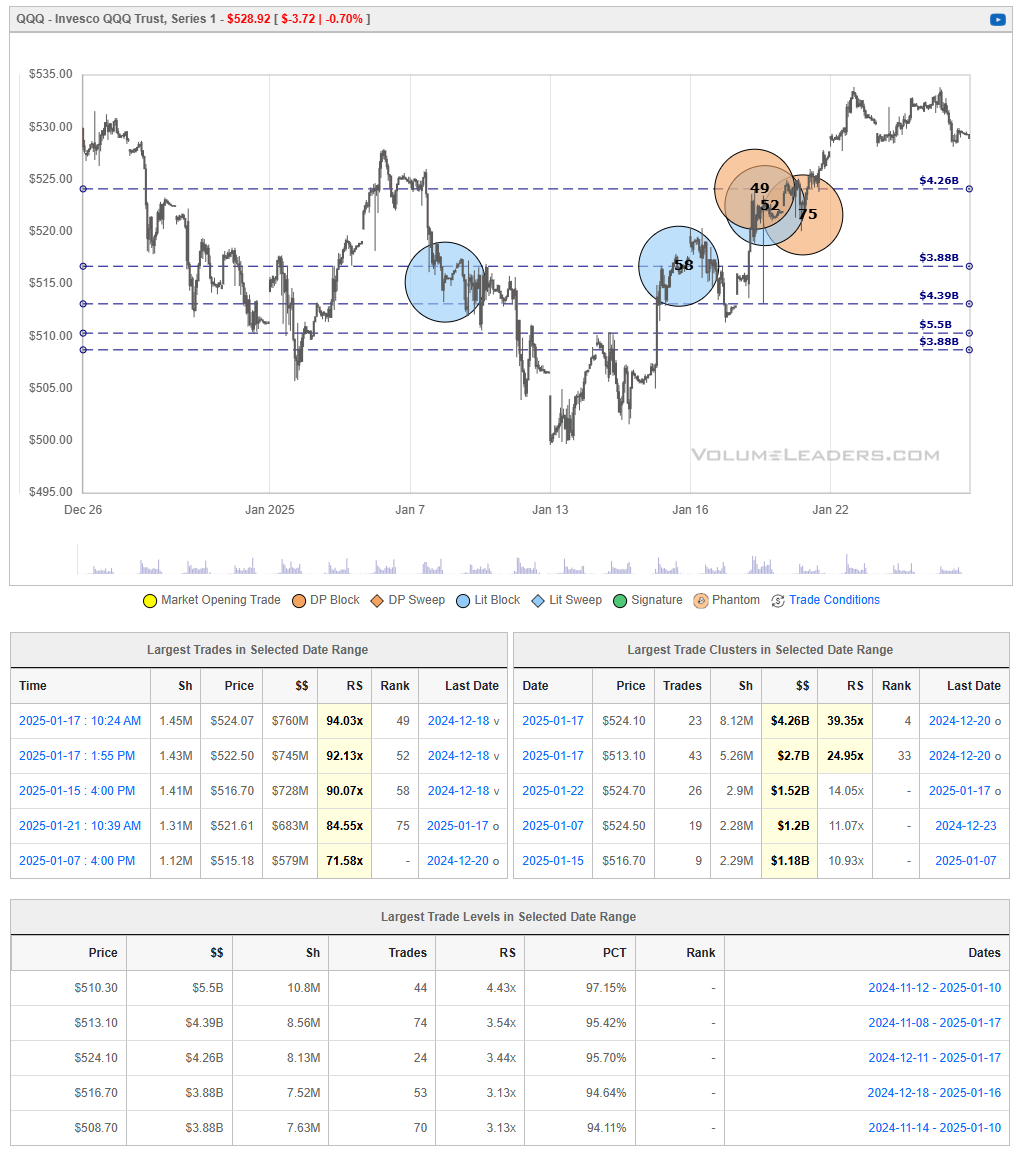
QQQ climbed steadily from its early‐January lows near $500, breaking above multiple high‐volume zones around $510–$515. The ETF recently topped out near $535, where selling pressure emerged, leading to a modest pullback toward the $525–$530 range. If buyers step in and defend this support band, QQQ could attempt another leg up toward the recent highs.
Conversely, a slip back below key pivot levels near $520 would suggest that overhead supply remains dominant, raising the risk of a deeper retracement toward $515 or even $510. Overall, QQQ’s short‐term trajectory hinges on whether it can hold above these newly established support zones after its strong rebound.
IWM 0.00%↑
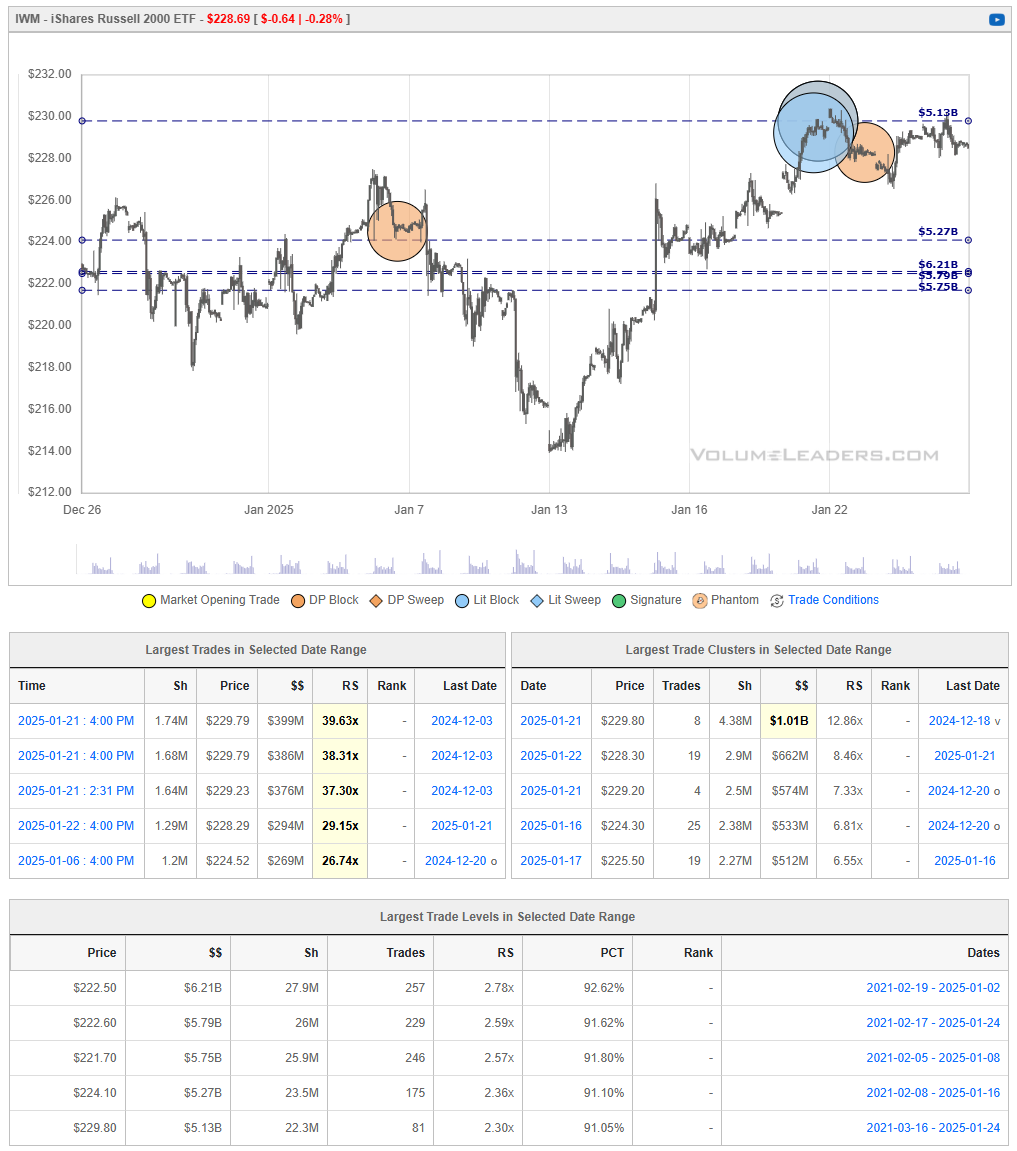
IWM extended its early‐January rebound and briefly pushed above $230, but ran into overhead supply around the $232 level. Recent price action has seen a pullback toward the mid‐$220s, where institutional trades have historically provided support. If buyers can defend the $224–$225 zone and drive price back through $230–$232 resistance, the ETF could see another leg up. However, a failure to hold above $224 would hint that selling pressure remains dominant, potentially leading to a deeper retracement toward the lower‐$220s.
DIA 0.00%↑
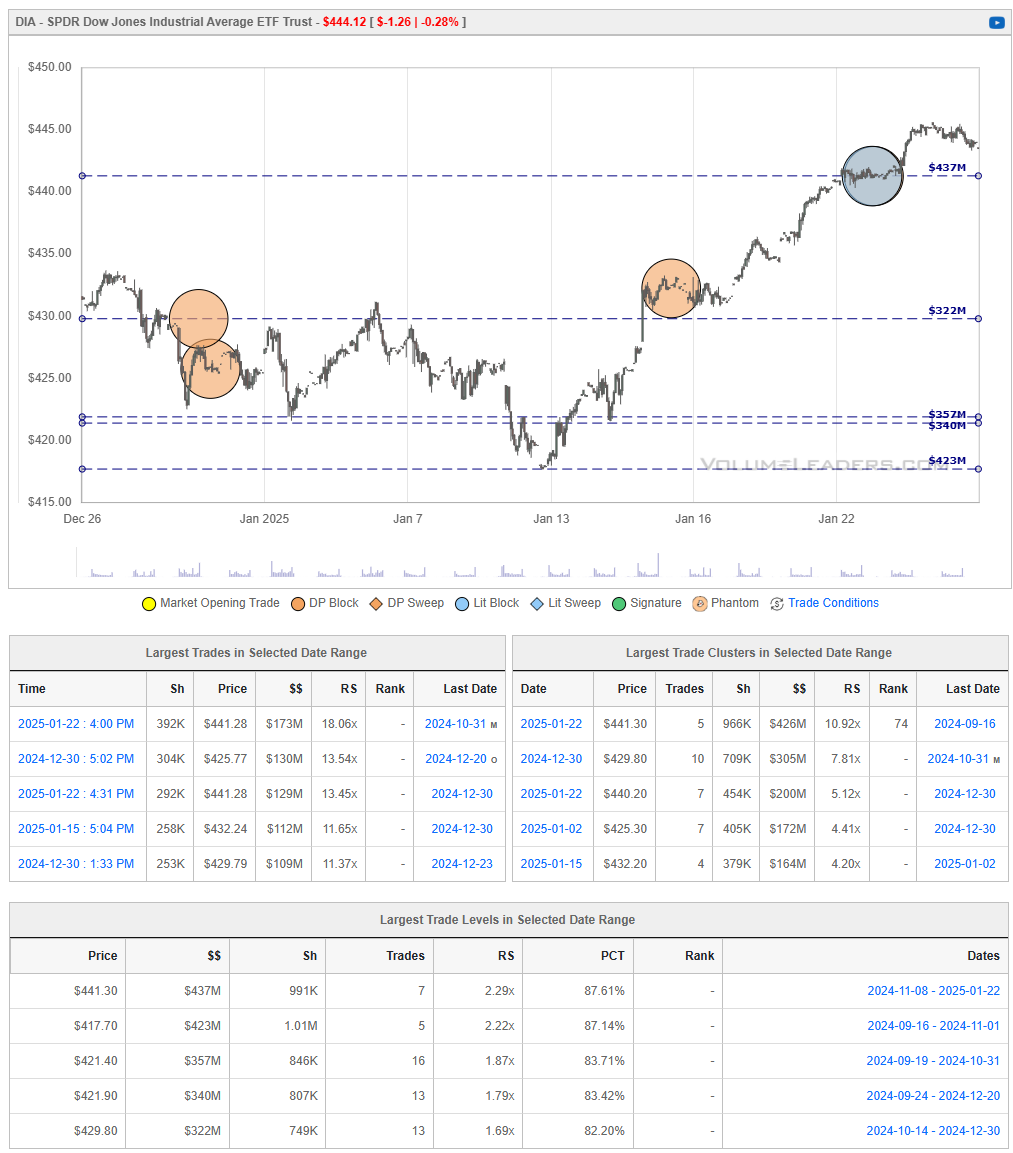
DIA rallied strongly off its January lows near $420, surging past multiple layers of prior resistance in the $425–$435 region. The ETF now hovers around the mid‐$440s, an area where supply has historically emerged. If buyers can keep price above $440–$442 and push decisively past the $445 level, DIA could extend its uptrend toward December’s highs in the upper $440s. Conversely, a pullback beneath $440 would signal that the market is encountering renewed selling pressure, potentially triggering a deeper retracement toward previous support zones around $435.
Institutional Order Flow
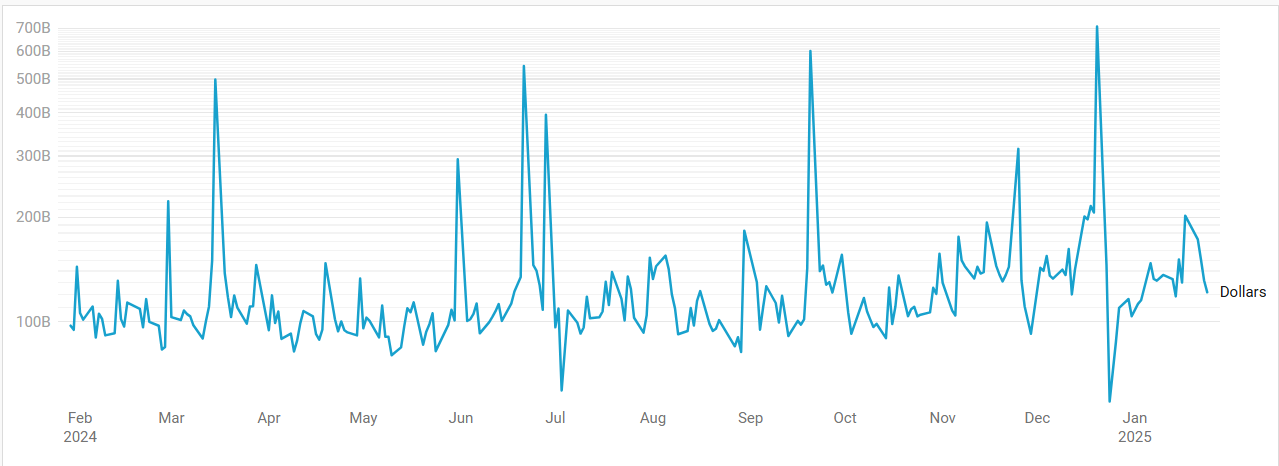
Rolling 1-Yr Dollars By Day
This chart shows institutional activity by dollars by day on a rolling 1-year basis. From a theoretical standpoint, examining a chart of daily institutional dollar activity over the course of a year can offer several insights and possible inferences, though all should be approached with caution since the data alone may not prove causality or confirm underlying reasons. Some potential takeaways include:
Event-Driven Behavior:
Sharp, singular spikes on certain days might correlate with major market-moving events. These could include central bank policy announcements, significant geopolitical news, sudden macroeconomic data releases (like employment reports or GDP data), earnings seasons for large-cap companies, or unexpected shocks (e.g., mergers, acquisitions, regulatory changes).Liquidity Dynamics:
Institutions often concentrate large trades on days with higher expected liquidity. For instance, heightened activity might coincide with index reconstitutions, option expiration dates, or the days leading up to or following a major index rebalance, when large amounts of capital shift hands simultaneously.Risk Management and Hedging Activity:
Institutions may significantly adjust their exposures on days that are critical from a risk management perspective. Large spikes can occur if hedge funds, pension funds, or asset managers are rolling over futures contracts, initiating or closing out large hedges, or reacting to volatility triggers.Market Sentiment Indicators:
While the data is purely transactional, the sheer volume of institutional involvement on certain days might indirectly hint at changing sentiment or strategic shifts.
In essence, a chart like this can lead you to hypothesize that institutional trading volumes are not constant or random but rather influenced by a mix of predictable calendar effects, major market events, liquidity considerations, risk management decisions, and strategic allocation shifts.
Last Week’s Institutional Activity By Sector
This is an incredibly important chart to watch as it contains lots of nuanced suggestions at a thematic level. Watch this chart closely week-to-week to stay informed about where institutional money is flowing, adjust your strategies based on momentum, align your portfolio with macroeconomic and market trends, and manage risks more effectively by avoiding sectors losing institutional favor. The Top 10 active sectors are identified and the rest grouped as “Other”.
Sector Rotation Insights: The chart highlights which sectors are attracting institutional activity and which are losing favor. Institutions often lead market trends, so tracking shifts in their focus can indicate sector rotations.
Sentiment Analysis: The level of institutional activity reflects confidence in specific sectors. Rising activity in traditionally defensive sectors (e.g., healthcare, utilities) may indicate caution, while a surge in growth sectors (e.g., technology, consumer discretionary) could suggest optimism.
Emerging Trends: Sudden spikes in a previously overlooked sector, like industrials or consumer staples, might hint at emerging opportunities or structural shifts.
Macro Themes: Changes in sector activity often align with broader macroeconomic themes like inflation, interest rates, or geopolitical events. For instance:
Increased activity in energy might indicate concerns about oil supply or rising prices.
Growth in technology could align with innovations or favorable policies.
Risk Management: Declining institutional activity in a sector might signal weakening fundamentals or heightened risks.
Spotting Overcrowding: Excessive activity in a single sector over multiple weeks may suggest overcrowding, which could lead to heightened volatility if institutions begin to exit.
Sector By Day

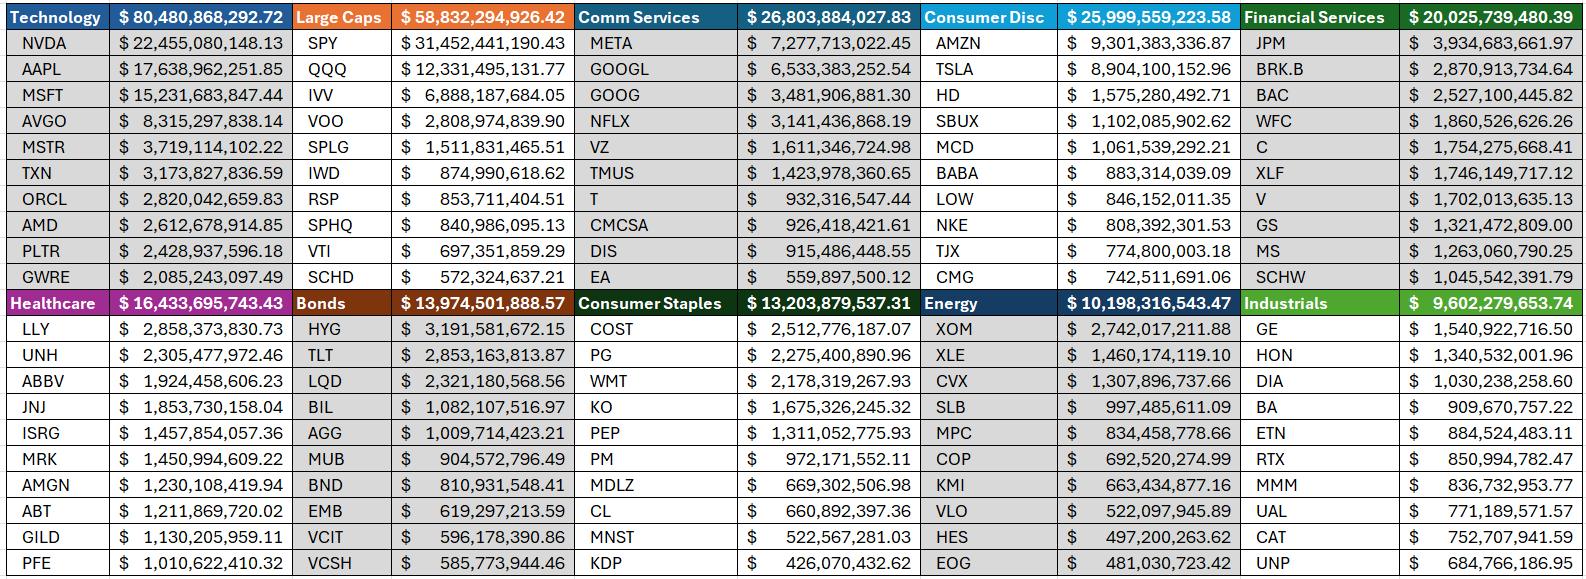
Top Names By Sector

This Week’s Institutional Order Flow Insights
Total Institutional Inflows by Sector
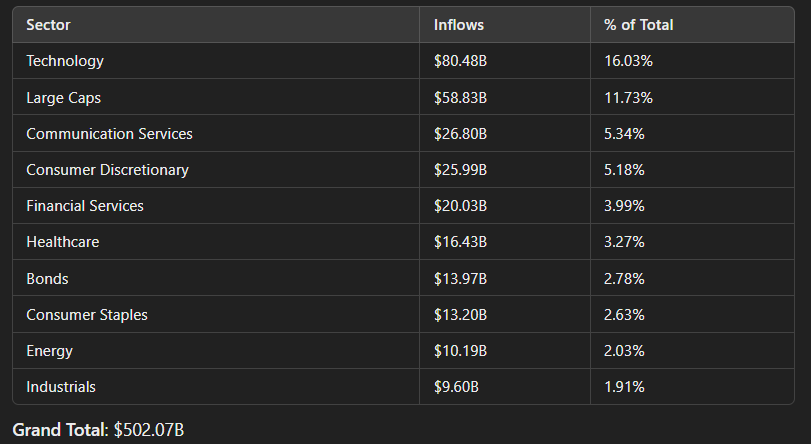
Top 3 Sectors by Total Inflows
Technology ($80.48B, 16.03% of total)
Dominates institutional attention, contributing the largest single share of inflows.
Large Caps ($58.83B, 11.73%)
Reflects strong inflows into ETFs like SPY, QQQ, and IVV.
Communication Services ($26.80B, 5.34%)
Driven by interest in Meta, Alphabet, and Netflix.
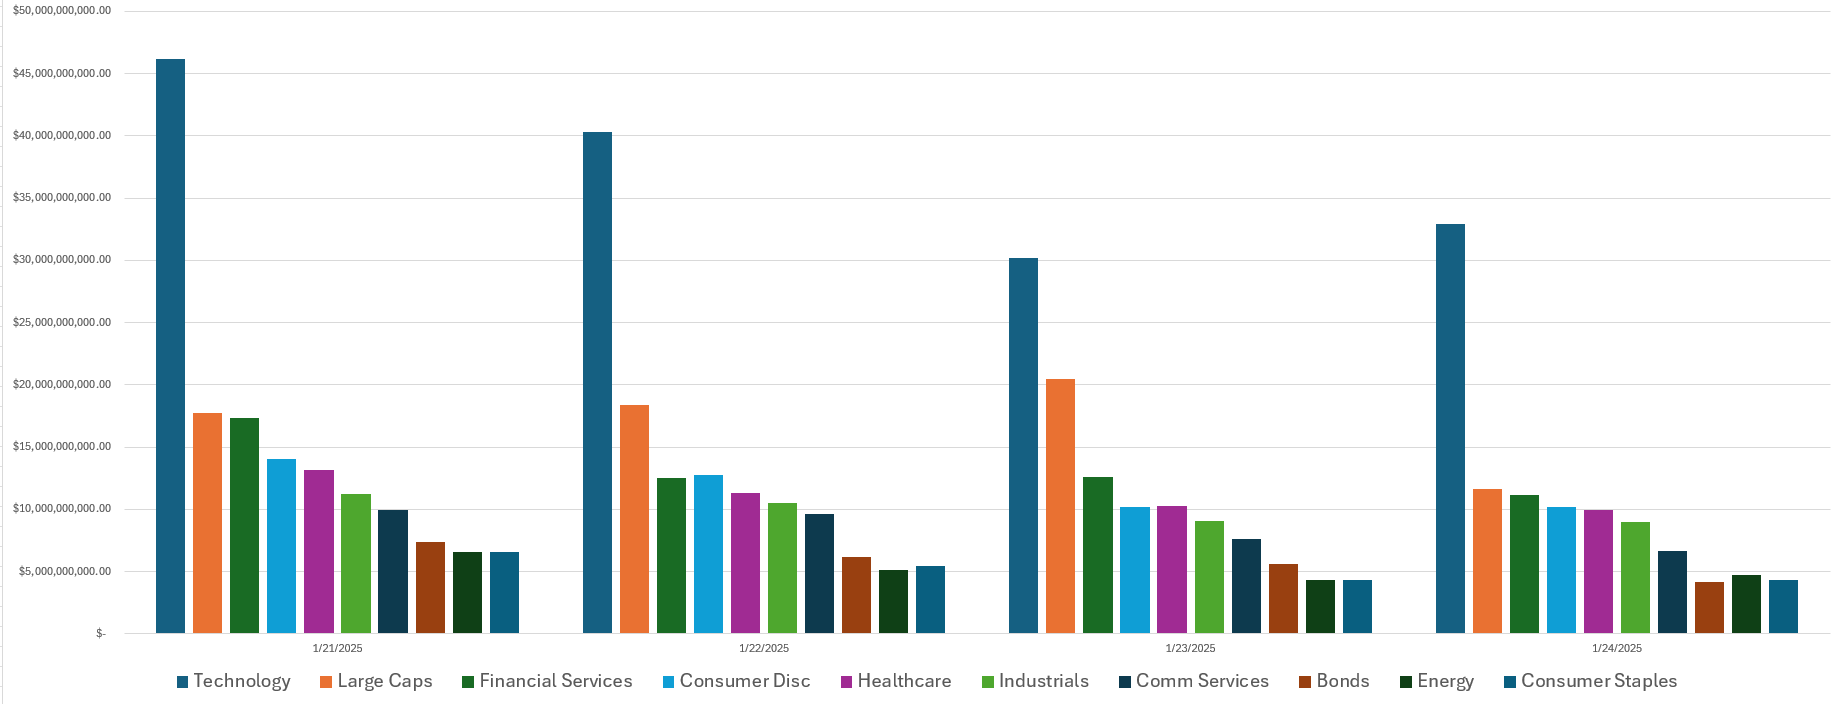
Daily Inflows by Sector
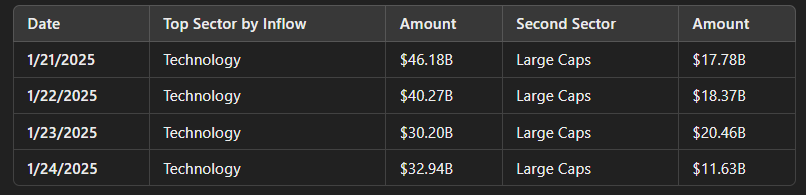
Key Observation: Technology consistently leads inflows every day, highlighting it as the primary focus for institutional capital allocation.
Sector Highlights from Data
Technology
Largest Daily Inflow: $46.18B on 1/21/2025.
Average Daily Inflow: $37.72B.
Top Contributors: NVIDIA ($22.45B), Apple ($17.63B), Microsoft ($15.23B).
Implication: Strong focus on individual high-growth names.
Large Caps
Largest Daily Inflow: $20.46B on 1/23/2025.
ETFs Driving Flows: SPY ($31.45B), QQQ ($12.33B), IVV ($6.88B).
Implication: Institutions are allocating broadly across market indices.
Communication Services
Total Inflow: $26.80B.
Top Names: Meta ($7.27B), Alphabet (GOOGL, $6.53B), Netflix ($3.14B).
Implication: Focus is on leading companies in advertising and media.
Healthcare
Total Inflow: $16.43B.
Top Names: Eli Lilly ($2.85B), UnitedHealth ($2.30B), Johnson & Johnson ($1.85B).
Implication: Steady, defensive inflows into pharmaceutical and healthcare service providers.
Energy
Total Inflow: $10.19B.
Top Contributors: ExxonMobil ($2.74B), Chevron ($1.30B), XLE (ETF, $1.46B).
Implication: Stable interest in energy names.
Bonds
Total Inflow: $13.97B.
Top ETFs: HYG ($3.19B), TLT ($2.85B), LQD ($2.32B).
Implication: Moderate hedging activity into fixed income.
Daily Trends
Technology Dominance: Consistently the highest inflow sector each day, showing sustained institutional interest.
Second-Tier Sectors: Large Caps remain in the second position across all days, reflecting broad ETF-based market participation.
Low Volatility Sectors: Energy and Industrials have steady but comparatively smaller daily inflows.
Key Implications
Growth-Focused Allocations: The dominance of Technology and Large Caps suggests institutional optimism for growth in high-liquidity, innovation-focused areas.
Defensive Hedging: Moderate inflows into Bonds and Healthcare indicate a cautious approach to mitigate downside risk.
ETF Preference: Large ETF inflows (SPY, QQQ, XLE) point to broad market participation and sector-wide exposure with other capital allocations in strategic stock-specific bets.
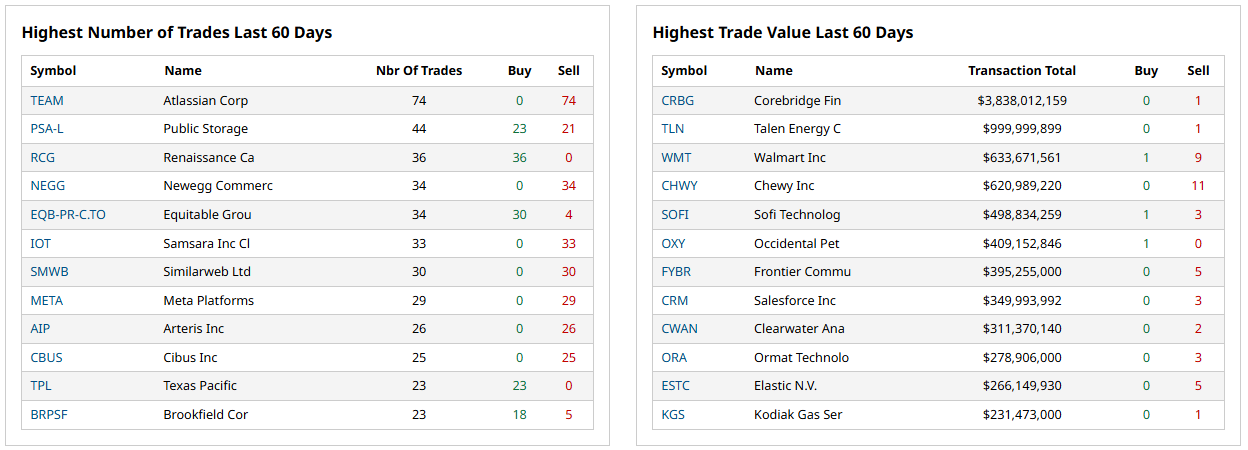
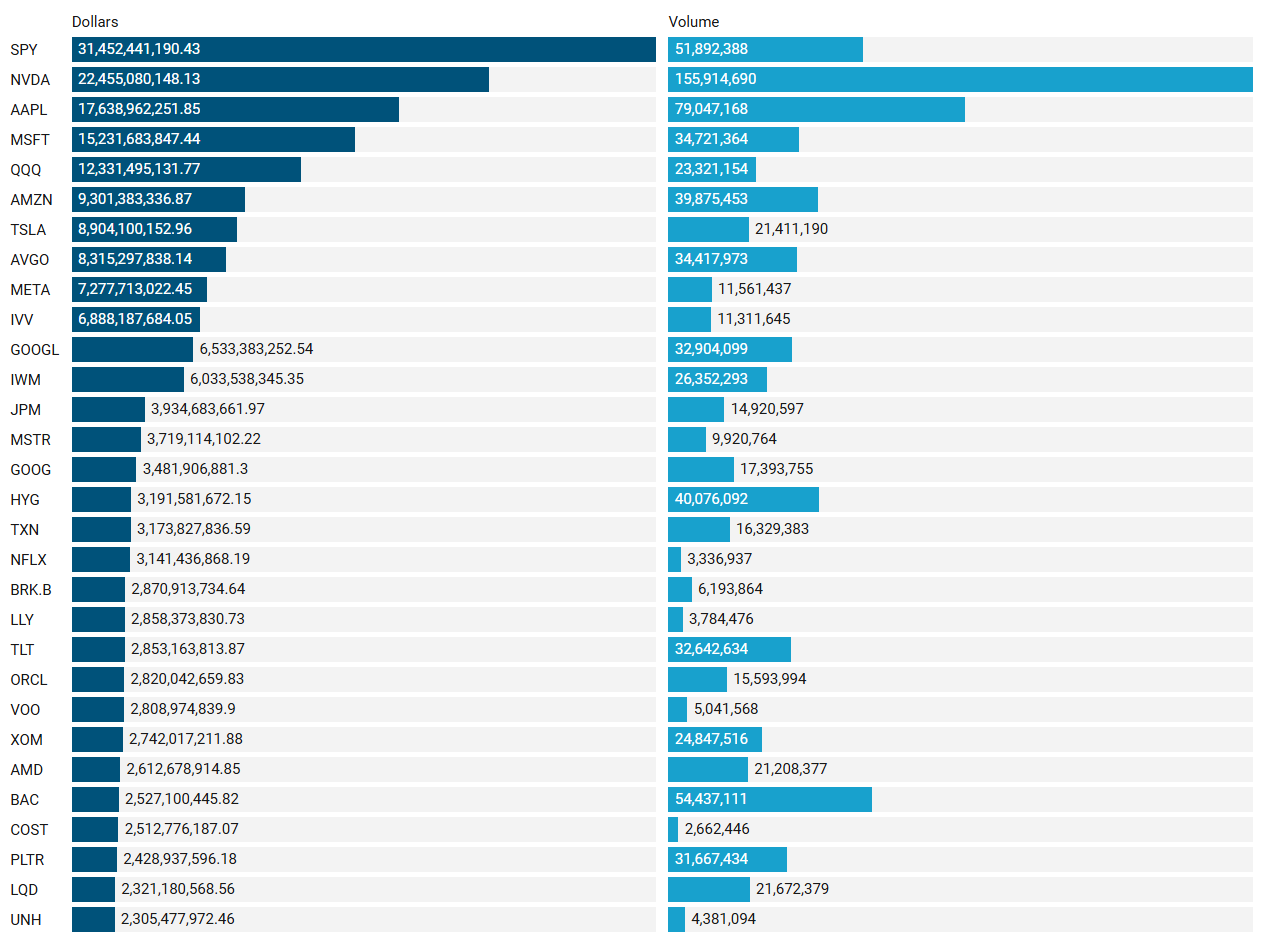
Top Institutional Order Flow In Individual Names
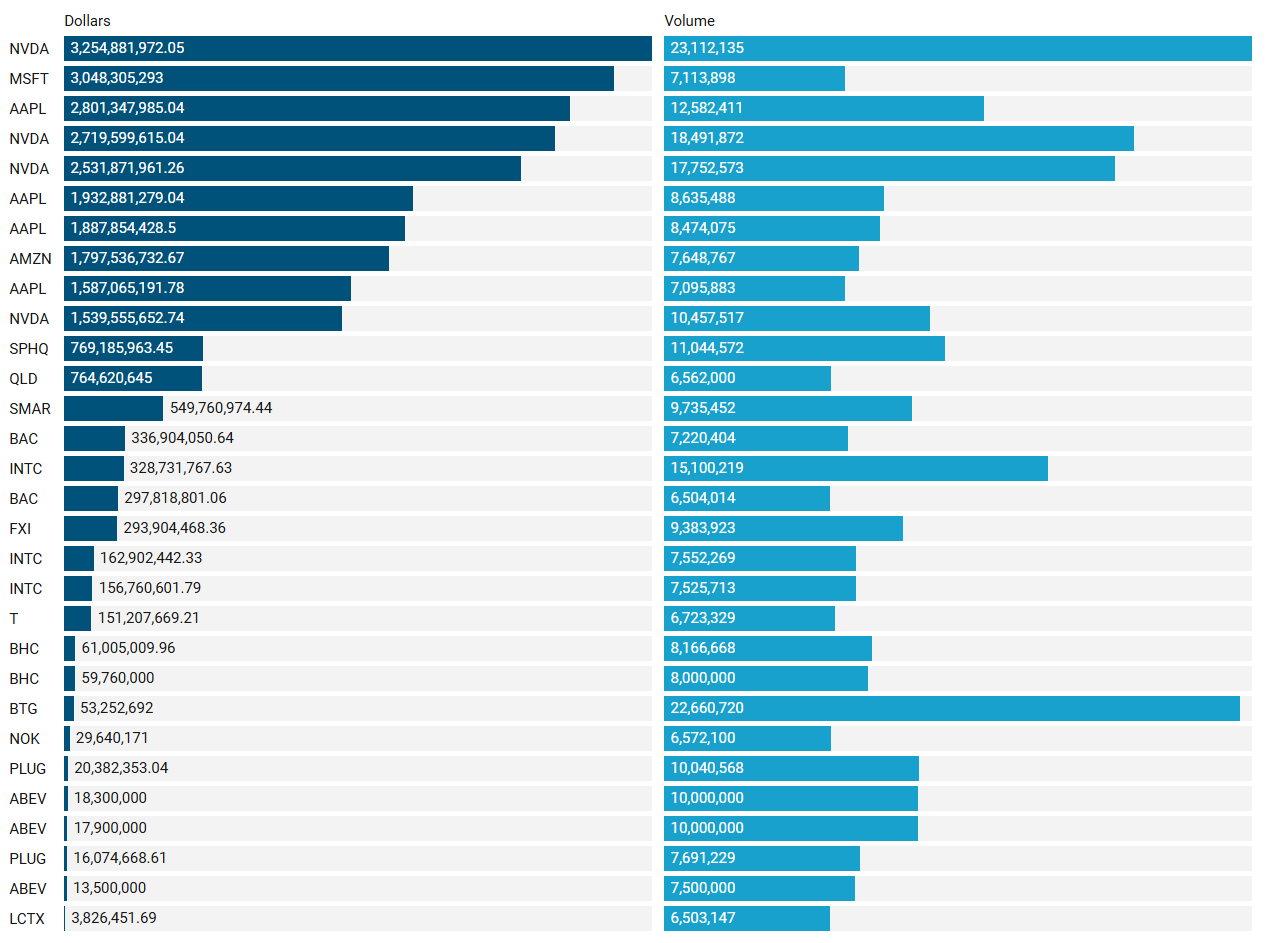
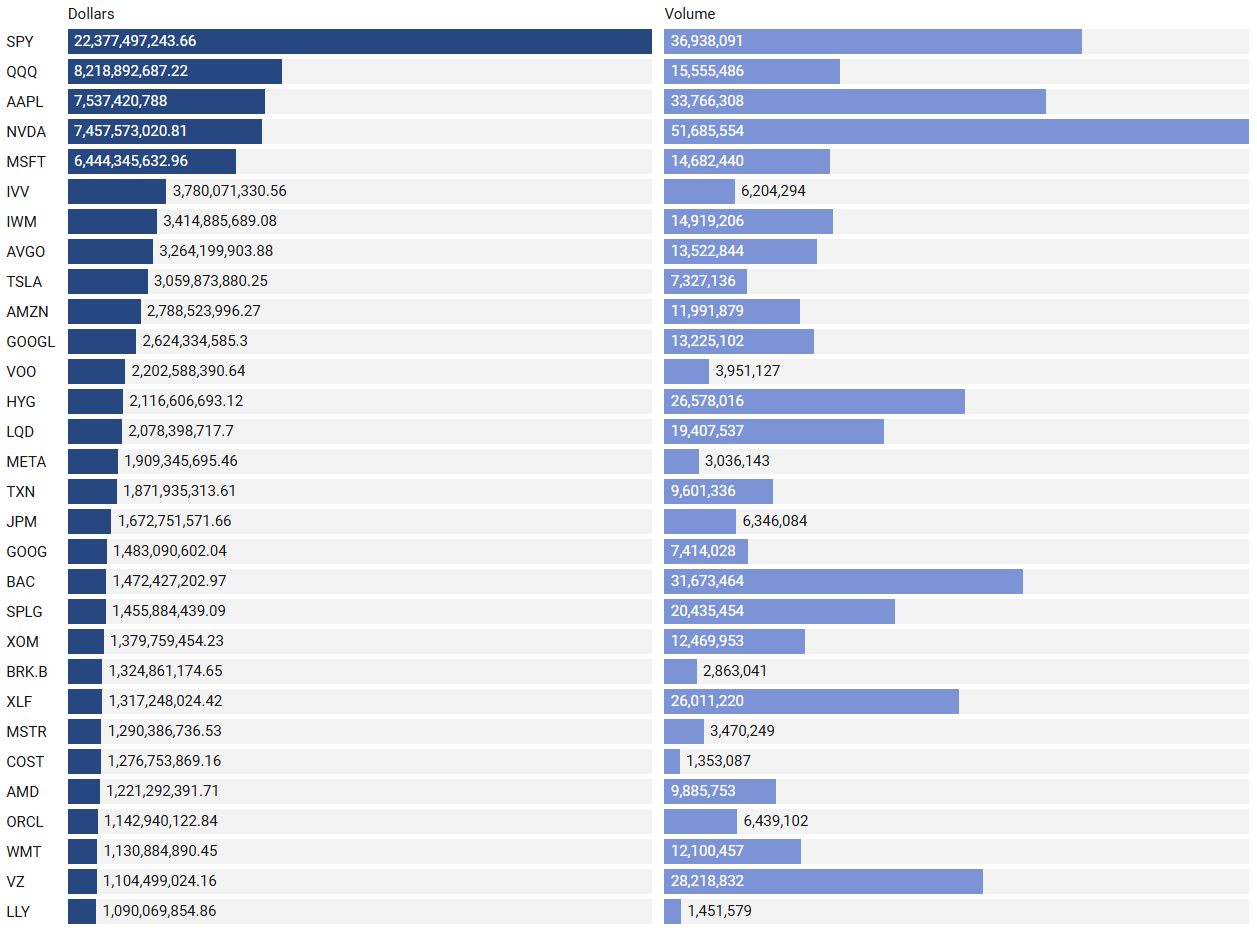
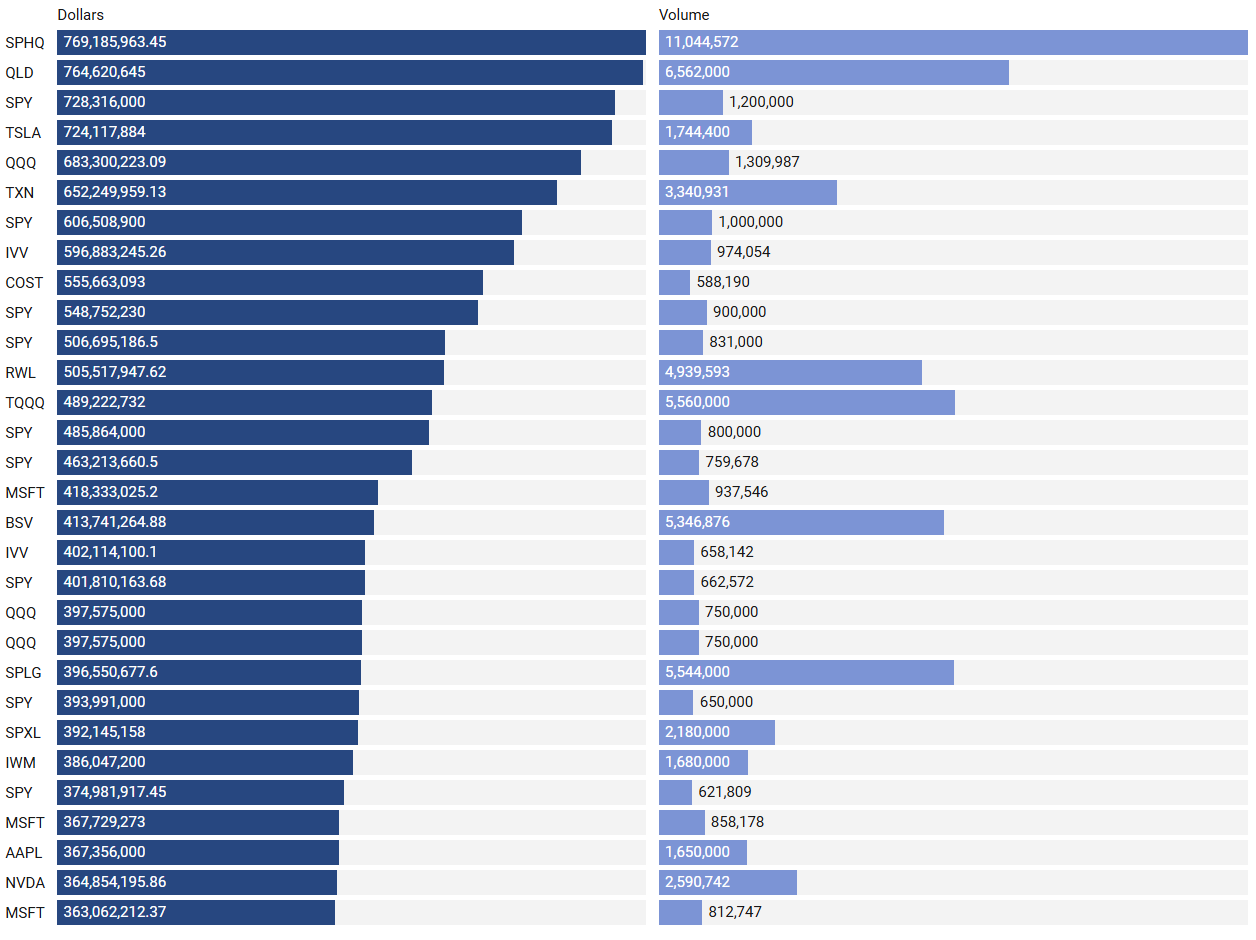
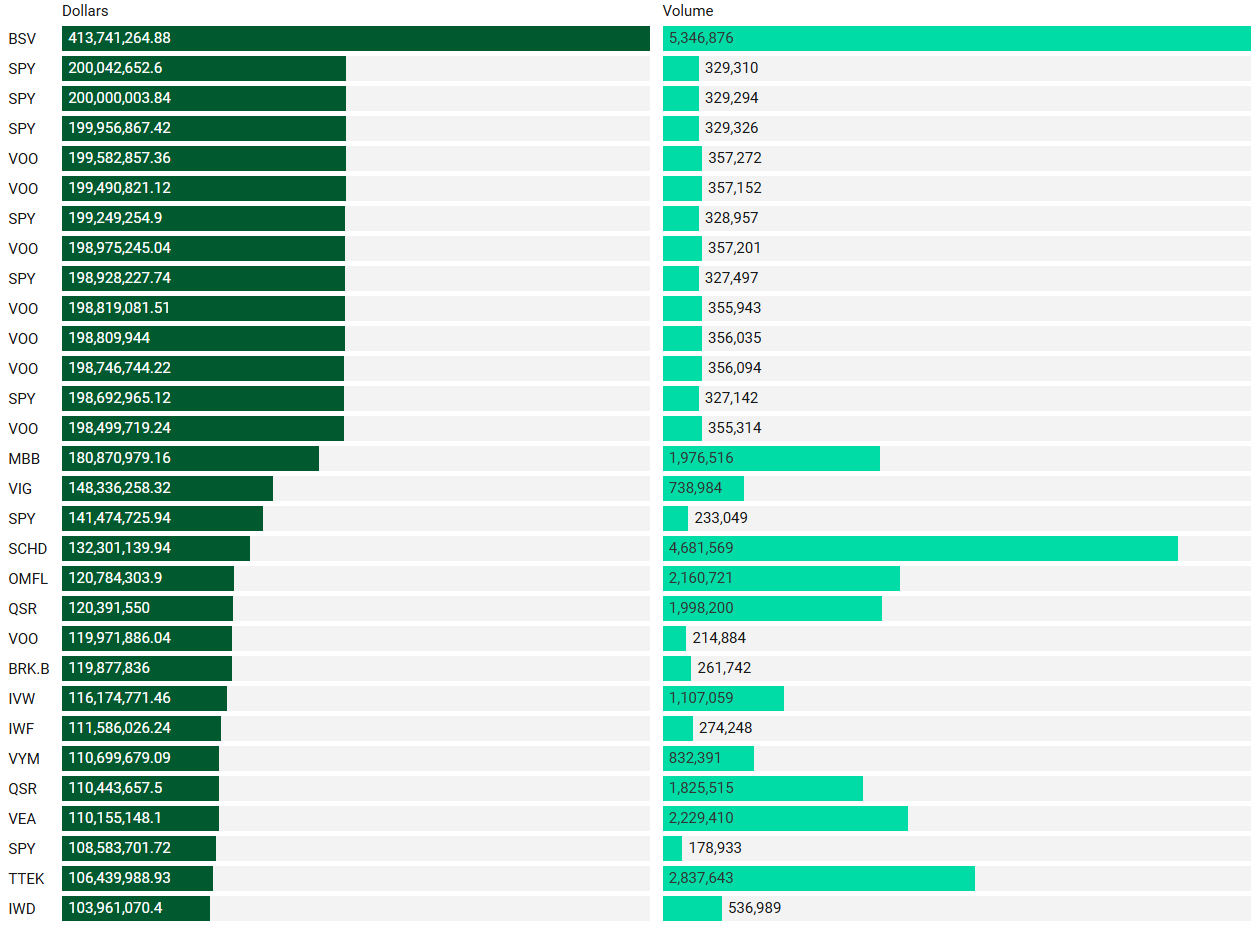
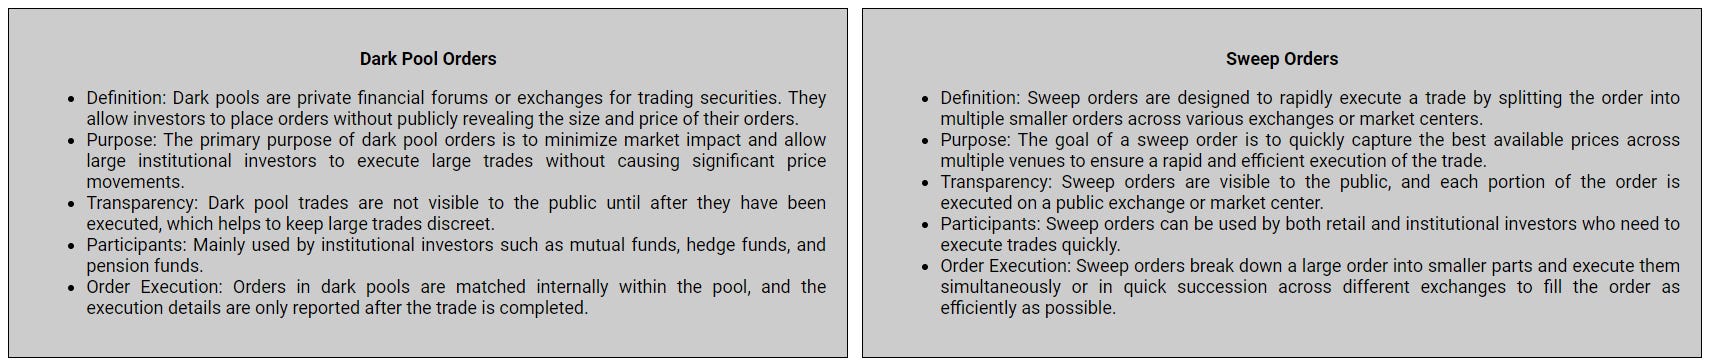
Many excellent trade ideas and sources of inspiration can be found in these prints. While only the top 30 from each group are displayed, the complete results are accessible in VolumeLeaders.com for you to explore at your convenience any time. Remember to configure trade alerts within the platform to ensure institutional order flows that capture your interest or are significant to you aren’t missed. The blue charts encompass all types of trades, including blocks on lit exchanges; the purple charts exclusively depict dark pool trades; and the green charts represent sweeps only.
Largest By Aggregated Dollars Transacted
Largest Individual Trades by Dollars
Top Aggregate Dark Pool Activity by Ticker
Largest Individual Dark Pool Trades by Dollars
Top Aggregate Sweeps by Ticker
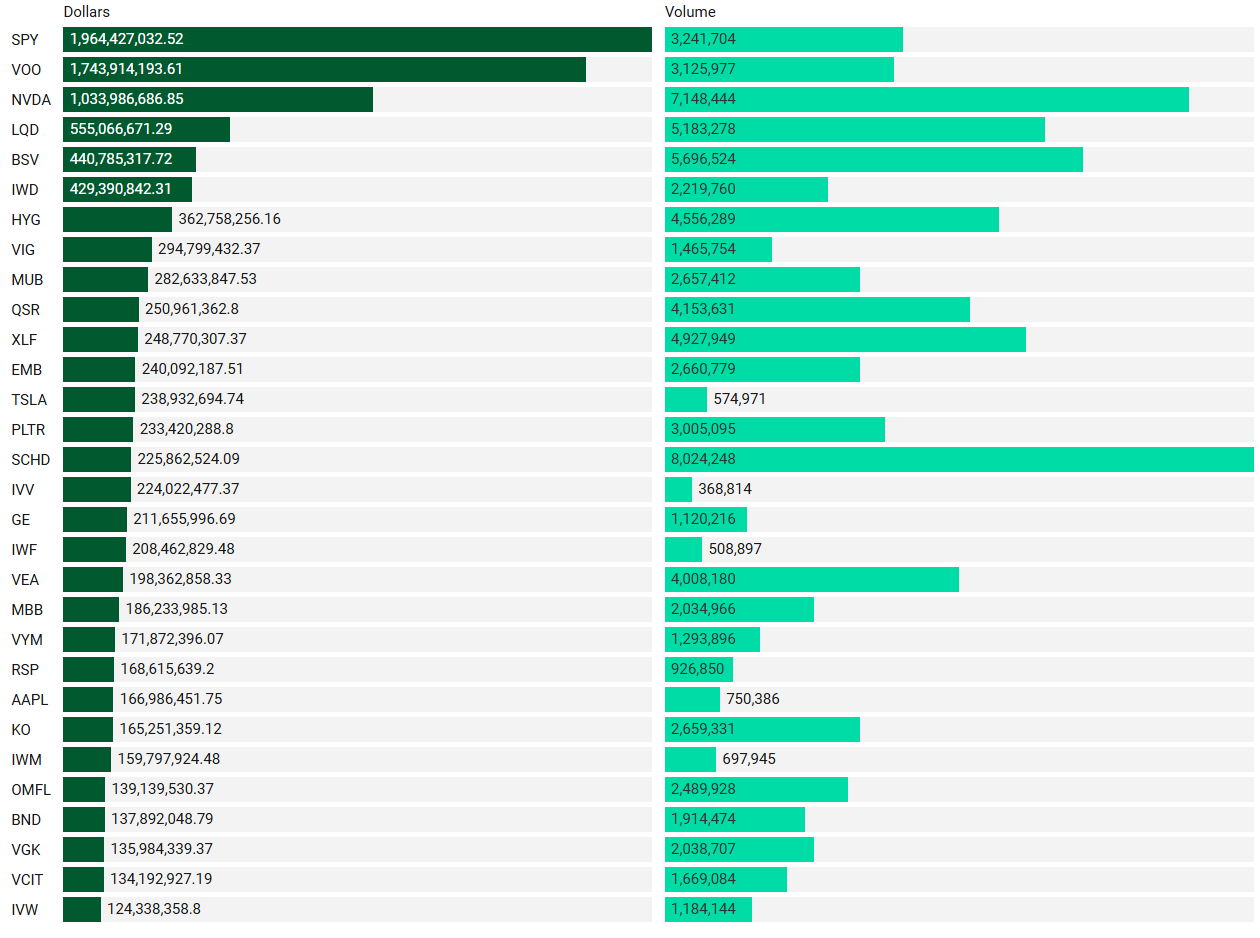
Top Individual Sweeps by Dollars Transacted
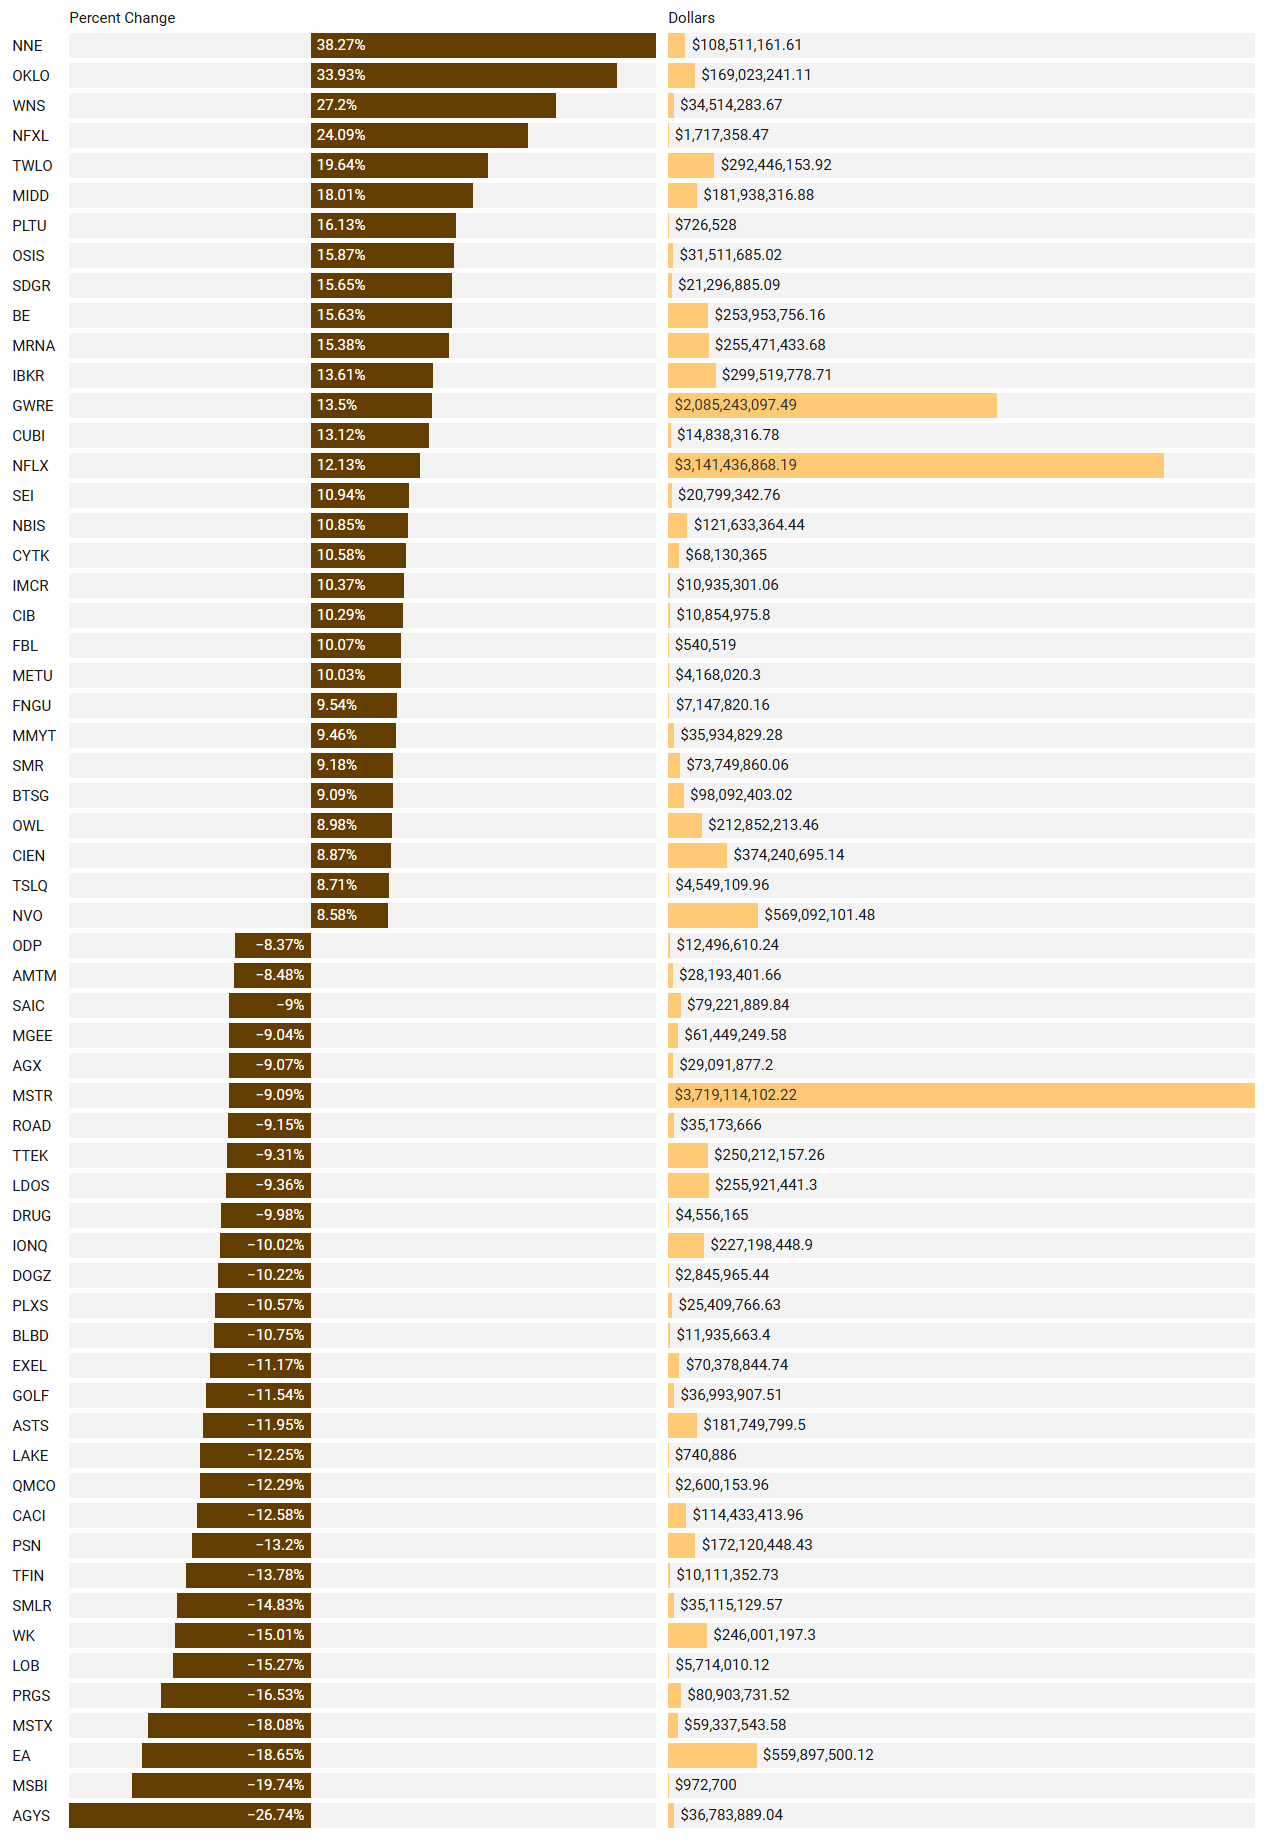
Last Week’s Institutionally-Backed Gainers & Losers
If you’re going to bet on a name, consider one that is officially endorsed by an institution! These are the top percent gainers (green) and percent losers (red) from this week’s open-to-close that had a trade price greater than $20 and institutional involvement. Continue watching tickers from this and prior stacks as these names frequently turn into multi-leg trades with a lot of movement!
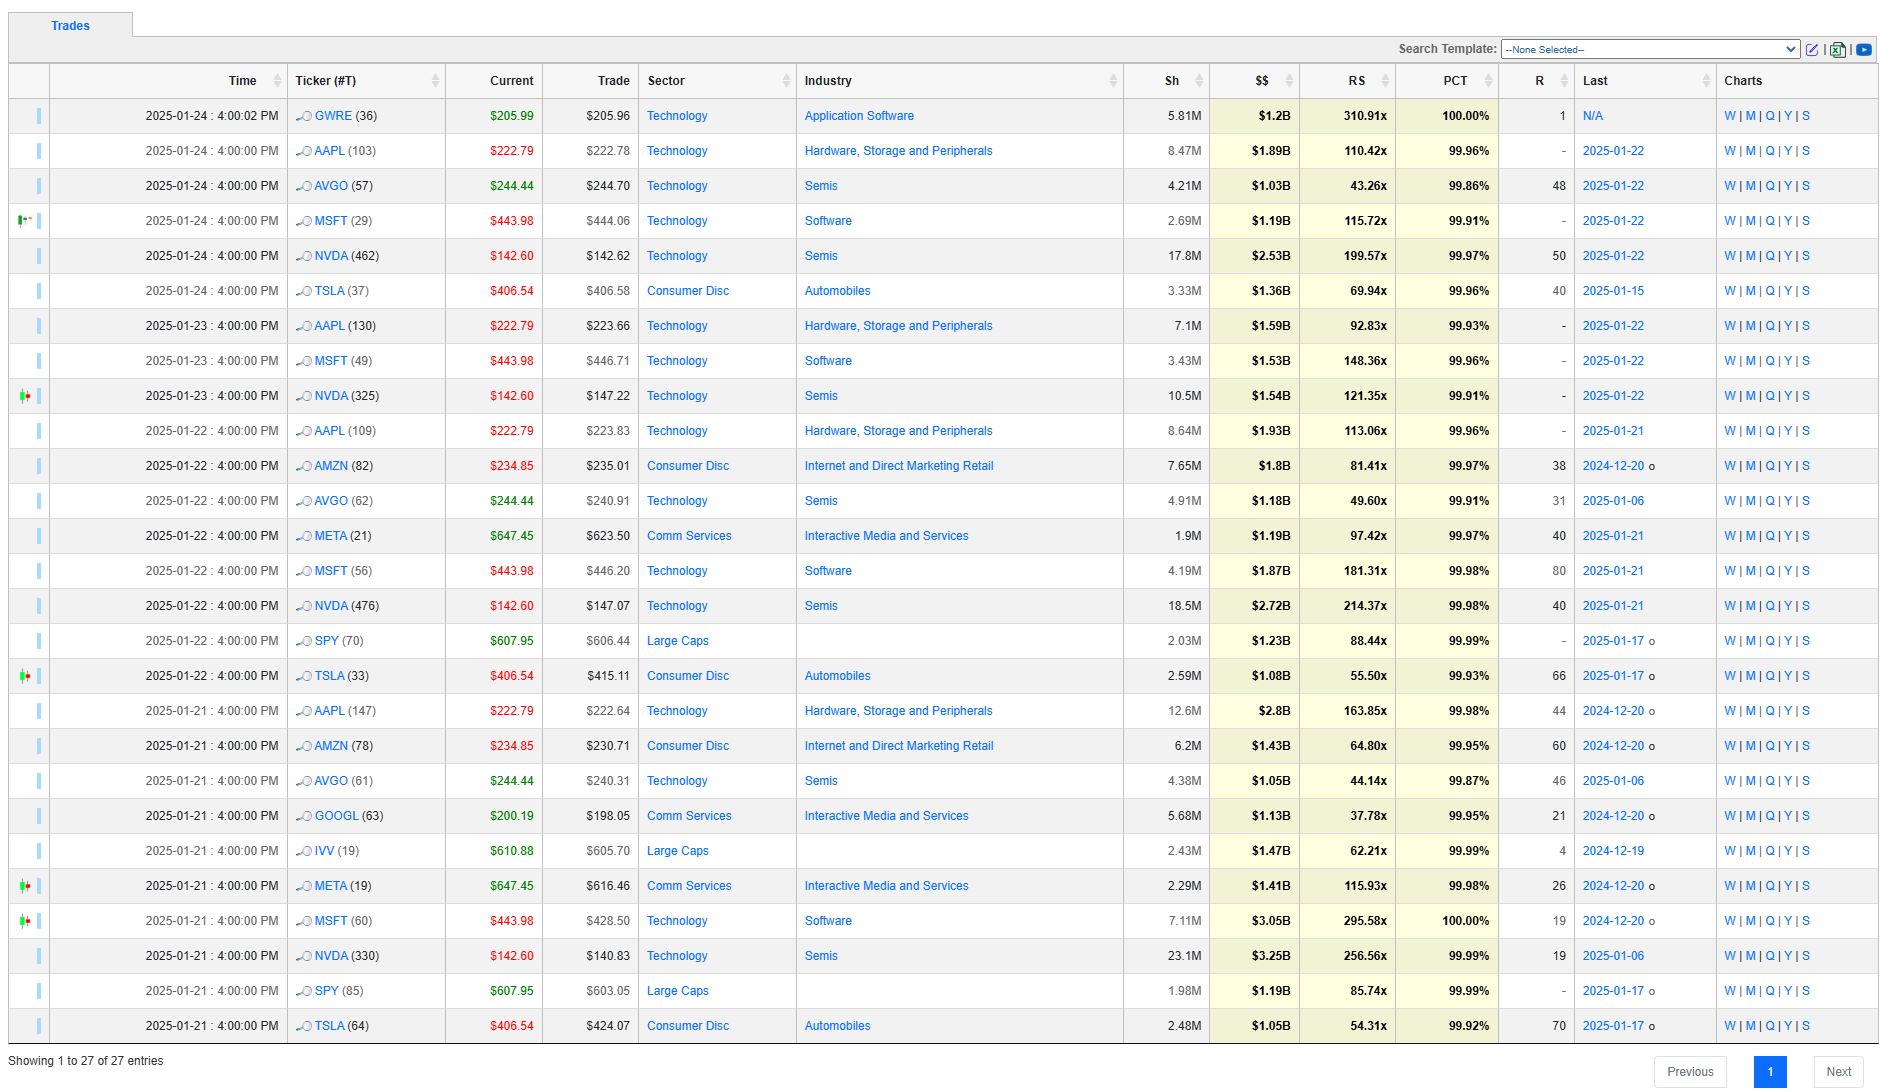
Last Week’s Billion-Dollar Prints
Tickers that printed a trade worth at least $1B last week get a special shout-out… Welcome to the club. Subs can use this convenience link to pull-up the same screen shown below. These are massive commitments by institutions that should not be ignored.
Investments In Focus: Bull vs Bear Arguments
Please read “Institutional S/R Levels For Major Indices” at the top of this stack to understand the nature and importance of what we’re looking at here visually. Institutions leave footprints that VolumeLeaders.com can illustrate for you while providing context to assess things like institutional conviction and urgency. Theses and data given below are not financial advice, just personal observations that may be wrong; consult a certified financial advisor before making any investment decisions.
QSR 0.00%↑
Restaurant Brands International Inc. (NYSE: QSR) is a prominent quick-service restaurant company, operating well-known brands such as Tim Hortons, Burger King, Popeyes Louisiana Kitchen, and Firehouse Subs.

Bullish Perspective:
Analyst Optimism: Analysts have a consensus "Buy" rating on QSR, with a 12-month average price target of $80.98, suggesting a potential upside of approximately 30.45% from the current price.
Earnings Growth: The company has demonstrated strong earnings growth, with a 39.4% increase over the past year, indicating effective management and operational strategies.
Attractive Valuation: QSR's price-to-earnings (P/E) ratio is 15.8x, which is below the U.S. market average of 19x, potentially making it an appealing investment opportunity.
Dividend Yield: The company offers a dividend yield of 3.74%, providing investors with a steady income stream.
Global Presence: With operations in multiple countries, QSR benefits from diversified revenue streams and exposure to various markets, enhancing its growth potential.
Bearish Perspective:
Debt Levels: The company holds significant debt, with $15.97 billion in debt against $1.18 billion in cash, resulting in a net cash position of -$14.80 billion. This high leverage could pose financial risks, especially in adverse economic conditions.
Dividend Stability: QSR has an unstable dividend track record, which may concern income-focused investors seeking reliable dividend payouts.
Insider Selling: There has been significant insider selling over the past three months, which could indicate potential concerns about the company's future prospects among its leadership.
Market Competition: The quick-service restaurant industry is highly competitive, with numerous players vying for market share, which could impact QSR's profitability and growth.
Economic Sensitivity: As a consumer discretionary company, QSR's performance is closely tied to economic conditions. Economic downturns or reduced consumer spending can negatively affect sales and profitability.
In summary, Restaurant Brands International Inc. presents a mix of growth opportunities and potential risks. While the company benefits from strong earnings growth, analyst optimism, and a global presence, investors should be mindful of its high debt levels, dividend stability concerns, and the competitive landscape when making investment decisions.
CVX 0.00%↑
Chevron Corporation (NYSE: CVX) is a leading global energy company involved in various sectors, including oil and gas exploration, production, refining, and marketing.
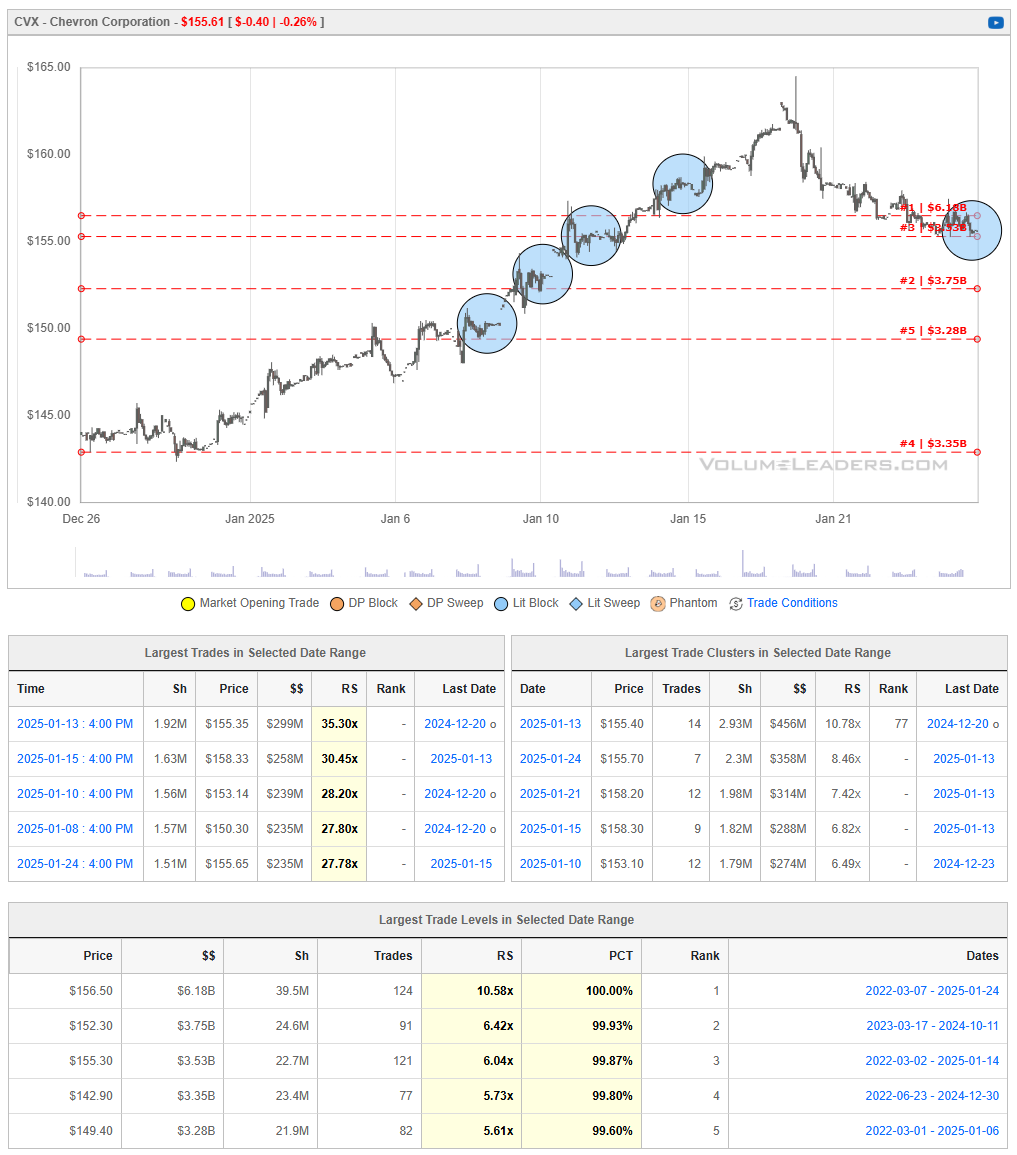
Bullish Perspective:
Strategic Asset Developments: Chevron has recently achieved significant milestones, such as commencing oil production at the Future Growth Project in Kazakhstan, which is expected to enhance its production capacity.
Technological Advancements: The company is leveraging artificial intelligence to optimize operations in the Permian Basin, leading to increased efficiency and profitability.
Strategic Partnerships: Chevron has entered into a 20-year agreement with Energy Transfer's subsidiary to secure liquefied natural gas (LNG) supply, ensuring long-term energy resources.
Bearish Perspective:
Capital Expenditure Reduction: Chevron has announced a reduction in its capital expenditure budget for 2025, marking the first cut since the pandemic-induced oil crash, which may impact future growth prospects.
Regulatory Challenges: The recent Supreme Court decision overturning the "Chevron deference" could lead to increased legal uncertainties and challenges for the company.
Environmental Criticisms: Chevron has faced environmental criticisms, including receiving the Public Eye Lifetime Award in 2015 for its environmental impact in the Amazon, which may affect its public image and investor sentiment.
In summary, Chevron Corporation demonstrates strengths through strategic asset developments, technological advancements, and long-term partnerships. However, potential investors should consider the implications of reduced capital expenditures, regulatory changes, and environmental criticisms when evaluating investment decisions.
LB 0.00%↑
LandBridge Company LLC (LB) is a company that manages land and resources to support oil and natural gas development in the United States. The company was founded in 2021 and is based in Houston, Texas and trade under a ticker belonging to former company L Brands, Inc.
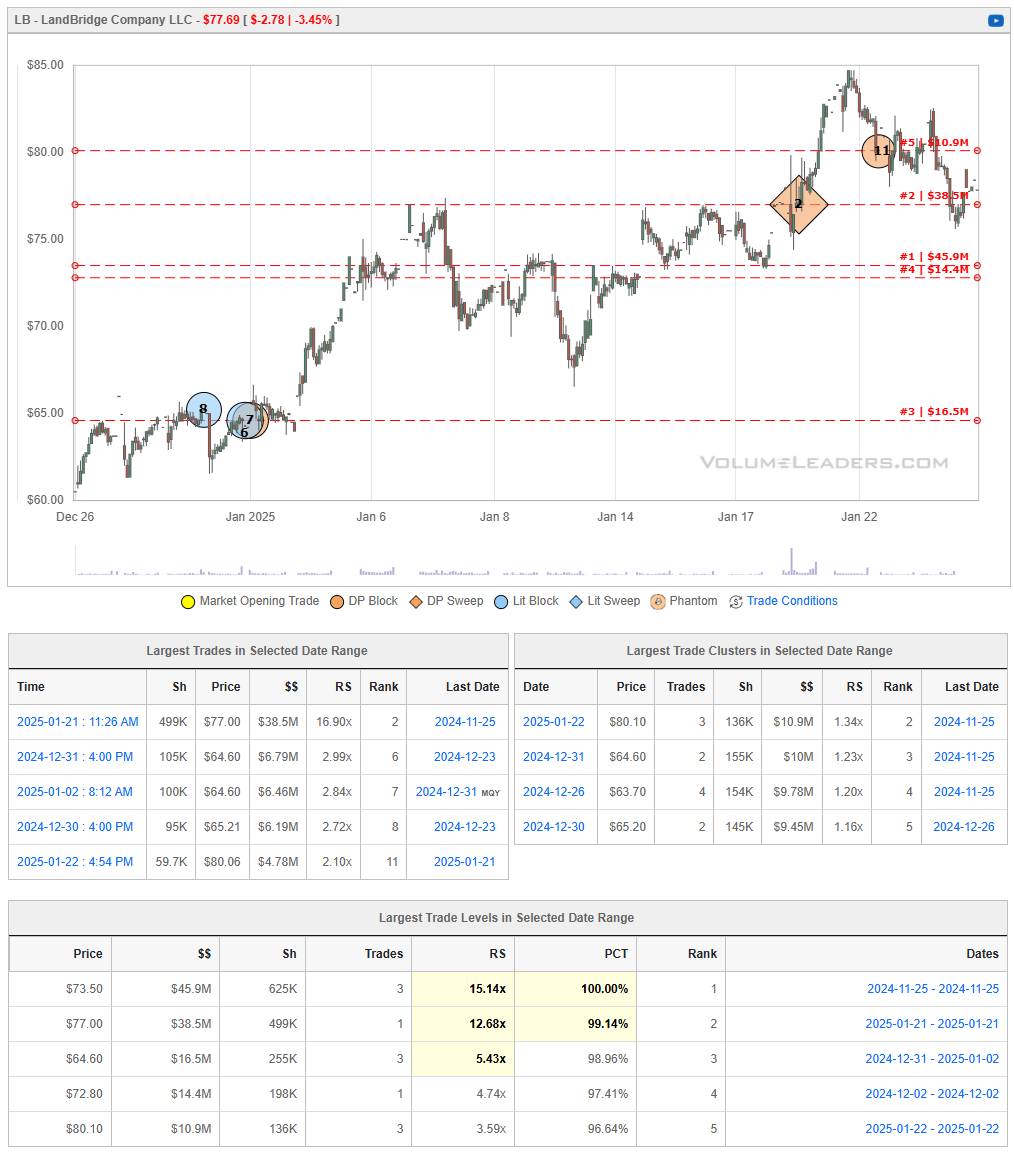
Bullish Perspective:
Strong Year-to-Date Performance: Since January 1, 2025, LB's stock has risen from $64.60 to $77.69, marking a 20.26% increase, indicating robust investor confidence.
Recent IPO Success: LB's initial public offering on June 28, 2024, raised $246 million, reflecting strong market interest and providing capital for growth initiatives.
Strategic Asset Portfolio: The company holds a diverse portfolio of oil and gas royalties and engages in the sale of brackish water and other surface composite materials, positioning it well in the energy sector.
Bearish Perspective:
Recent Earnings Miss: In Q3 2024, LB reported earnings per share of $0.07, missing analyst expectations of $0.31, which may raise concerns about its financial performance.
High Market Volatility: The stock has experienced significant fluctuations, with a 52-week range between $18.75 and $84.70, indicating potential instability.
Limited Public Information: As a relatively new public entity, there is limited historical data available, which may pose challenges for comprehensive investment analysis.
In summary, Landbridge Company LLC has demonstrated notable stock performance and holds strategic assets in the energy sector. However, investors should be cautious of recent earnings shortfalls, stock volatility, and the limited availability of public information when considering investment decisions.
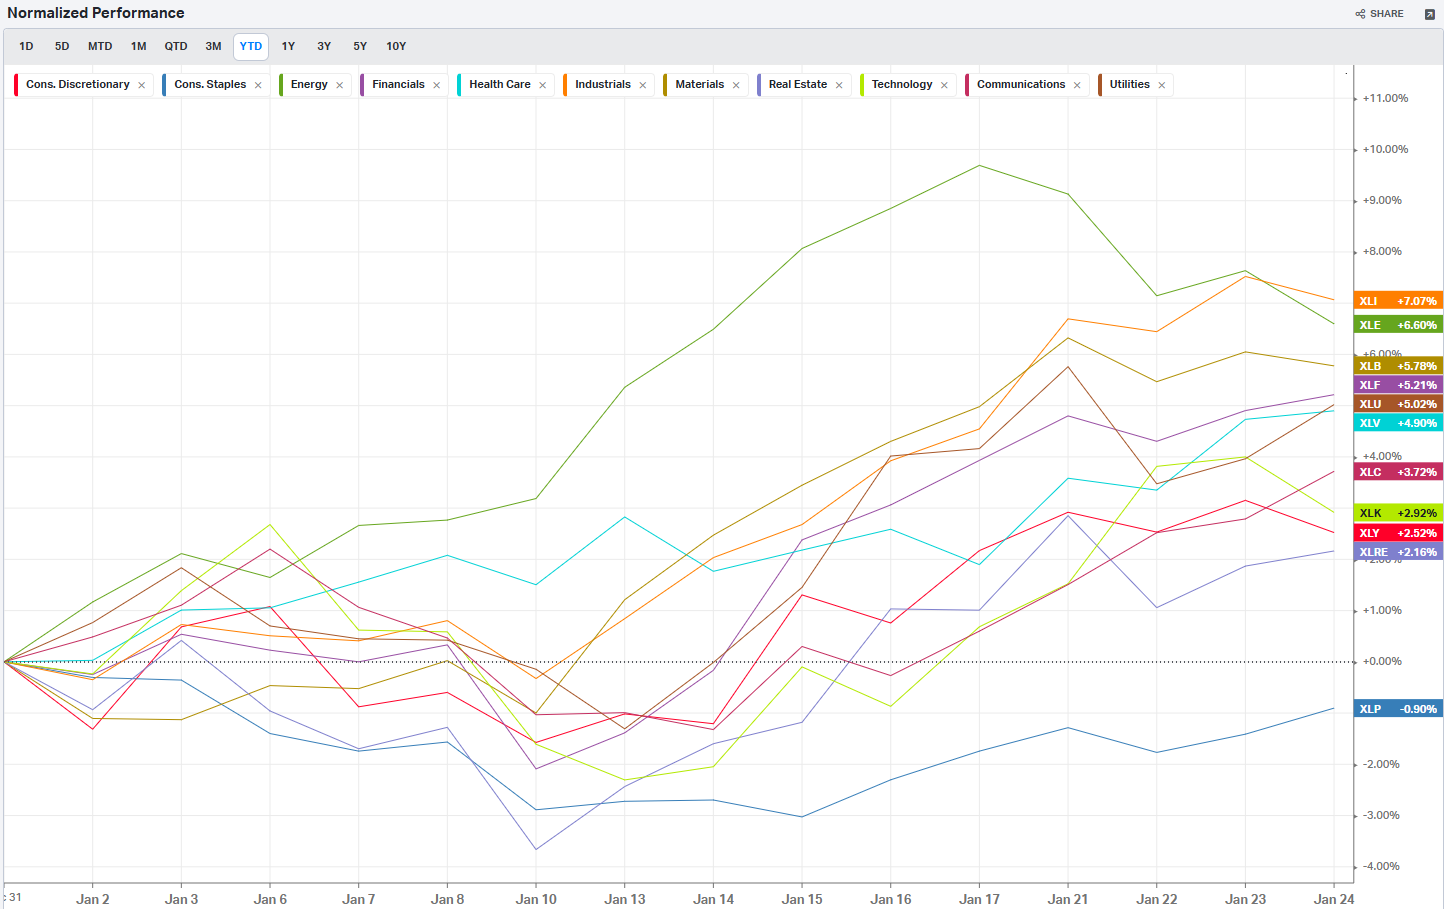
Summary Of Thematic Performance YTD
VolumeLeaders.com provides a lot of pre-built filters for thematics so that you can quickly dive into specific areas of the market. These performance overviews are provided here only for inspiration. Consider targeting leaders and/or laggards in the best and worst sectors, for example.
S&P By Sector
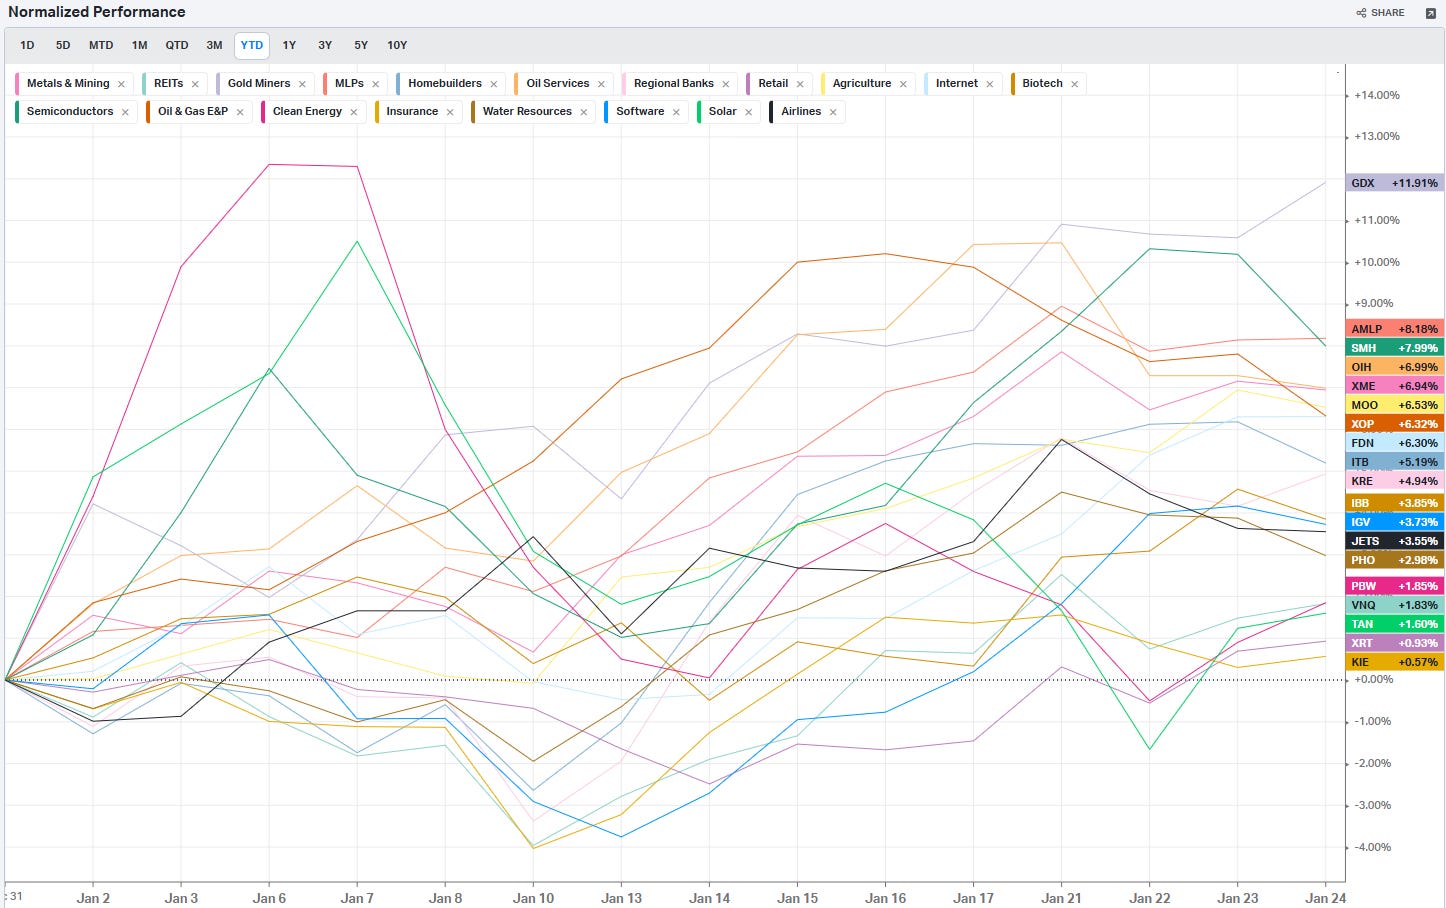
S&P By Industry
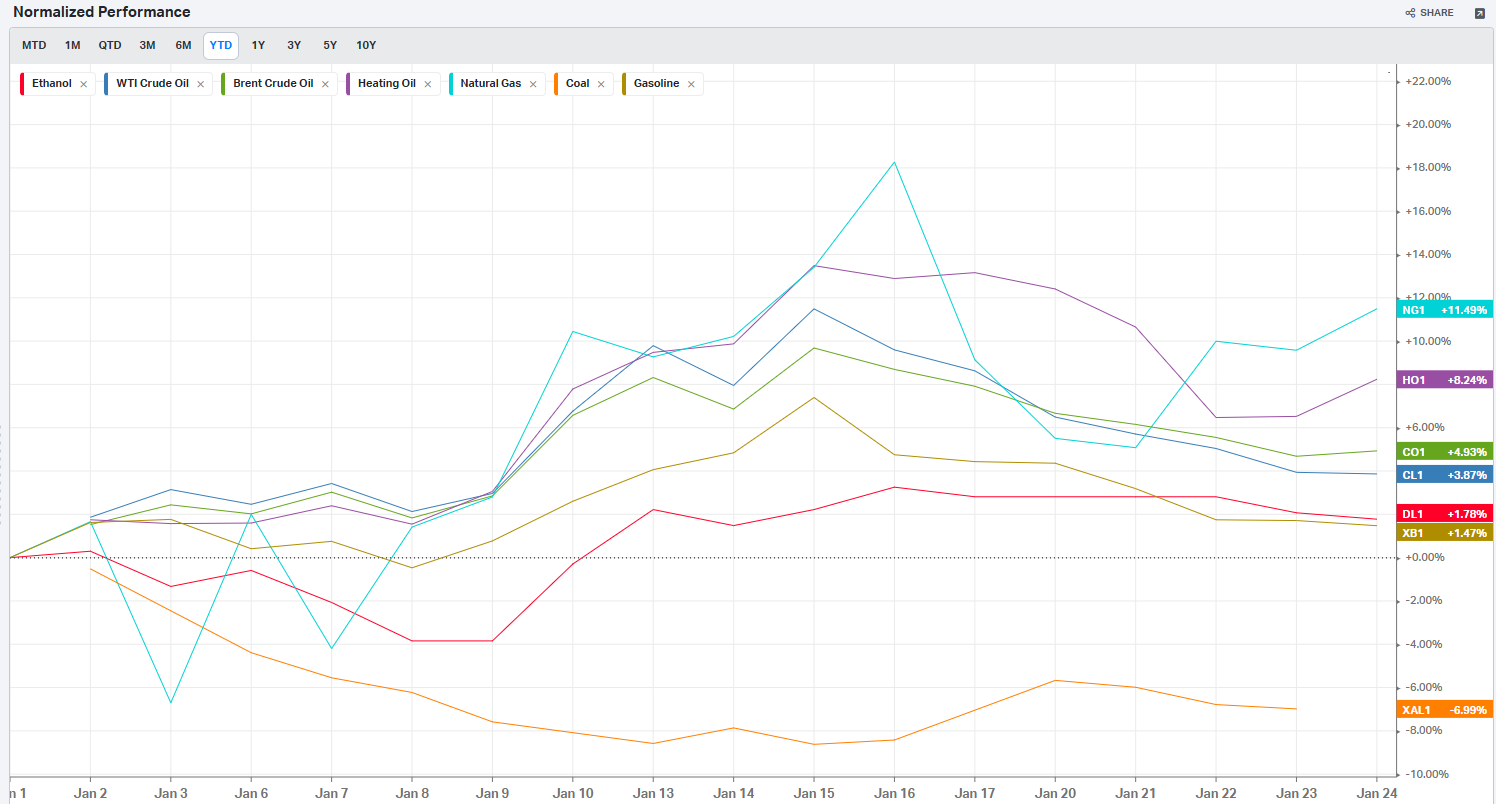
Commodities: Energy
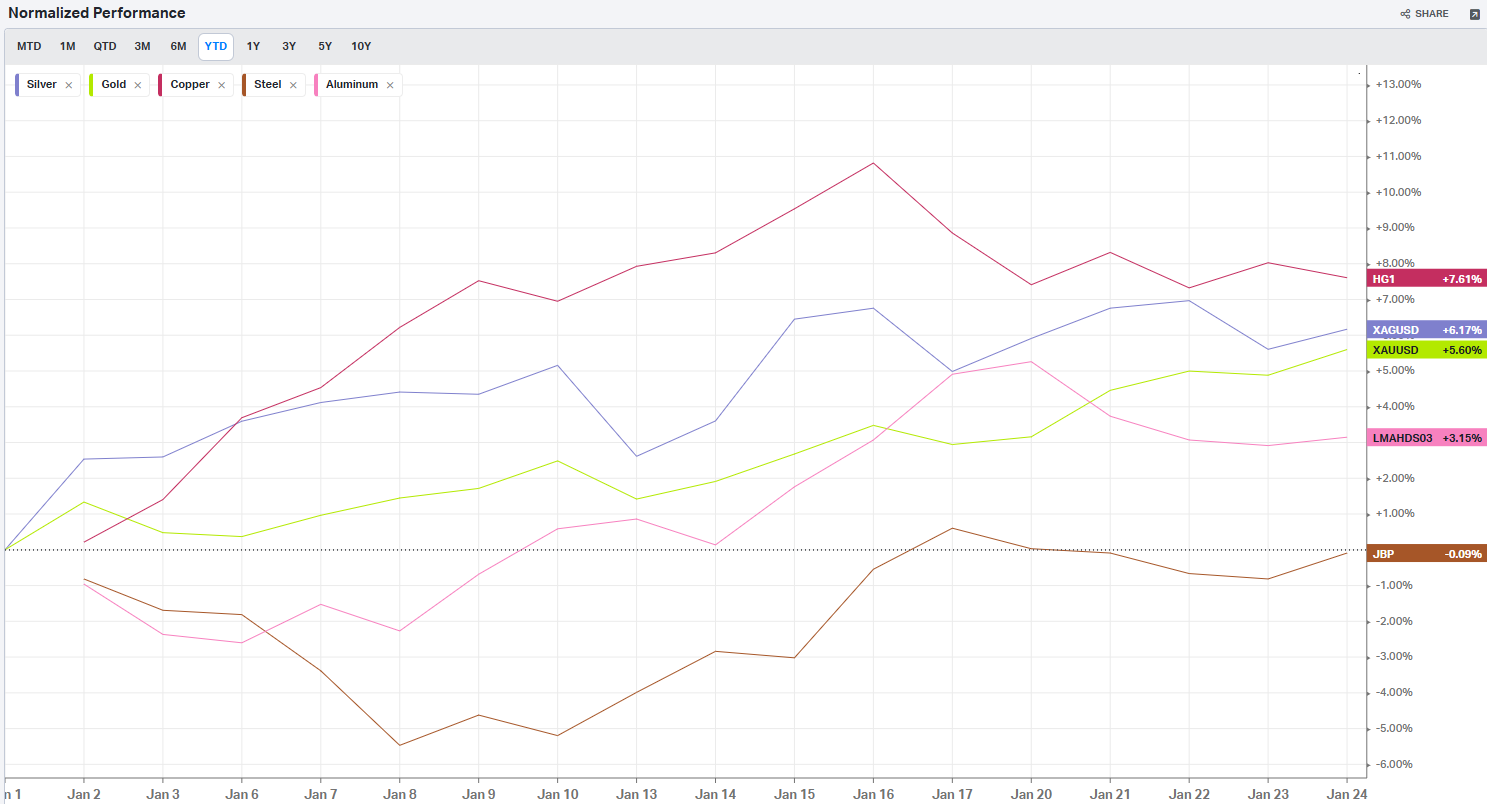
Commodities: Metals
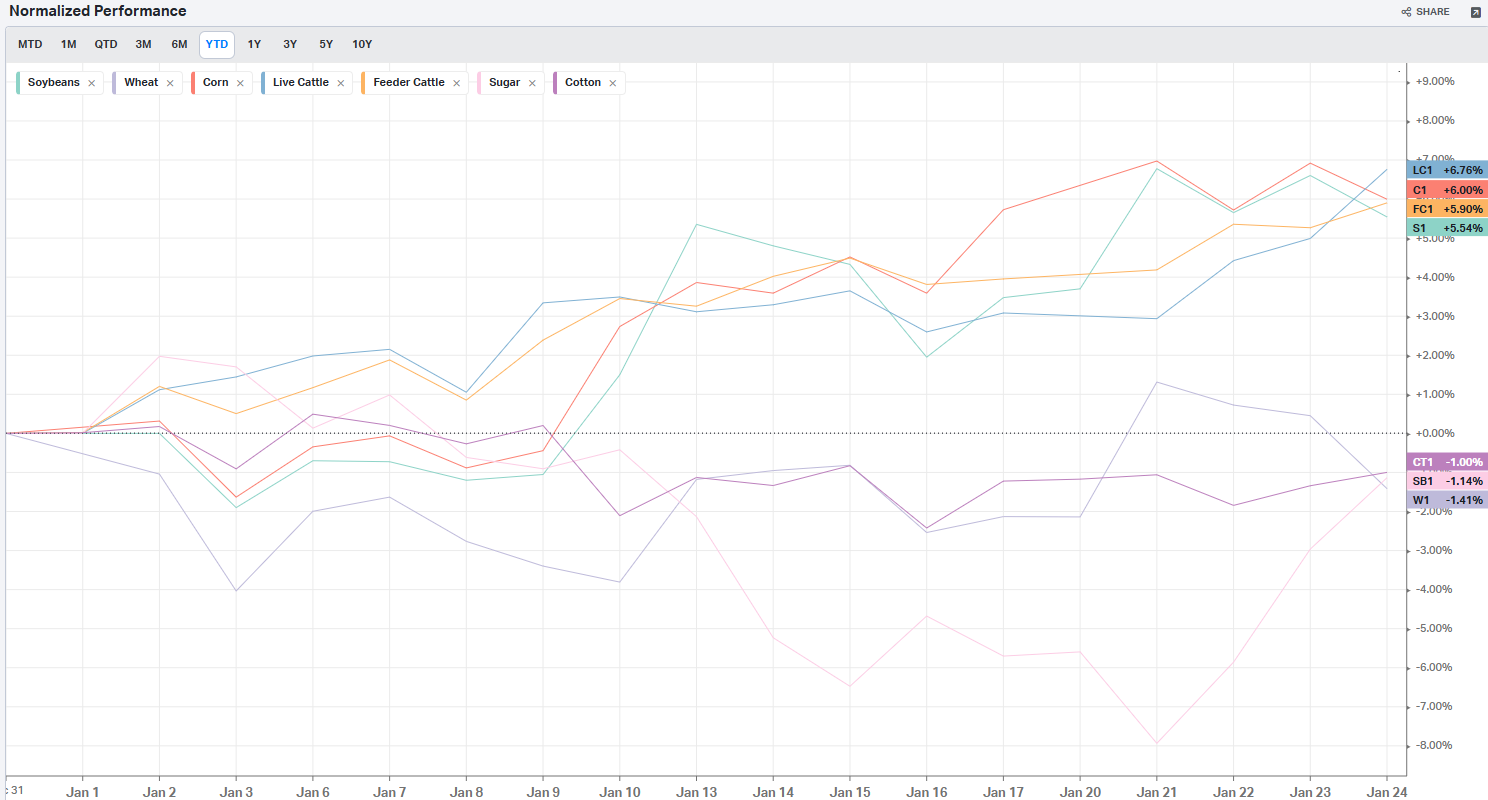
Commodities: Agriculture
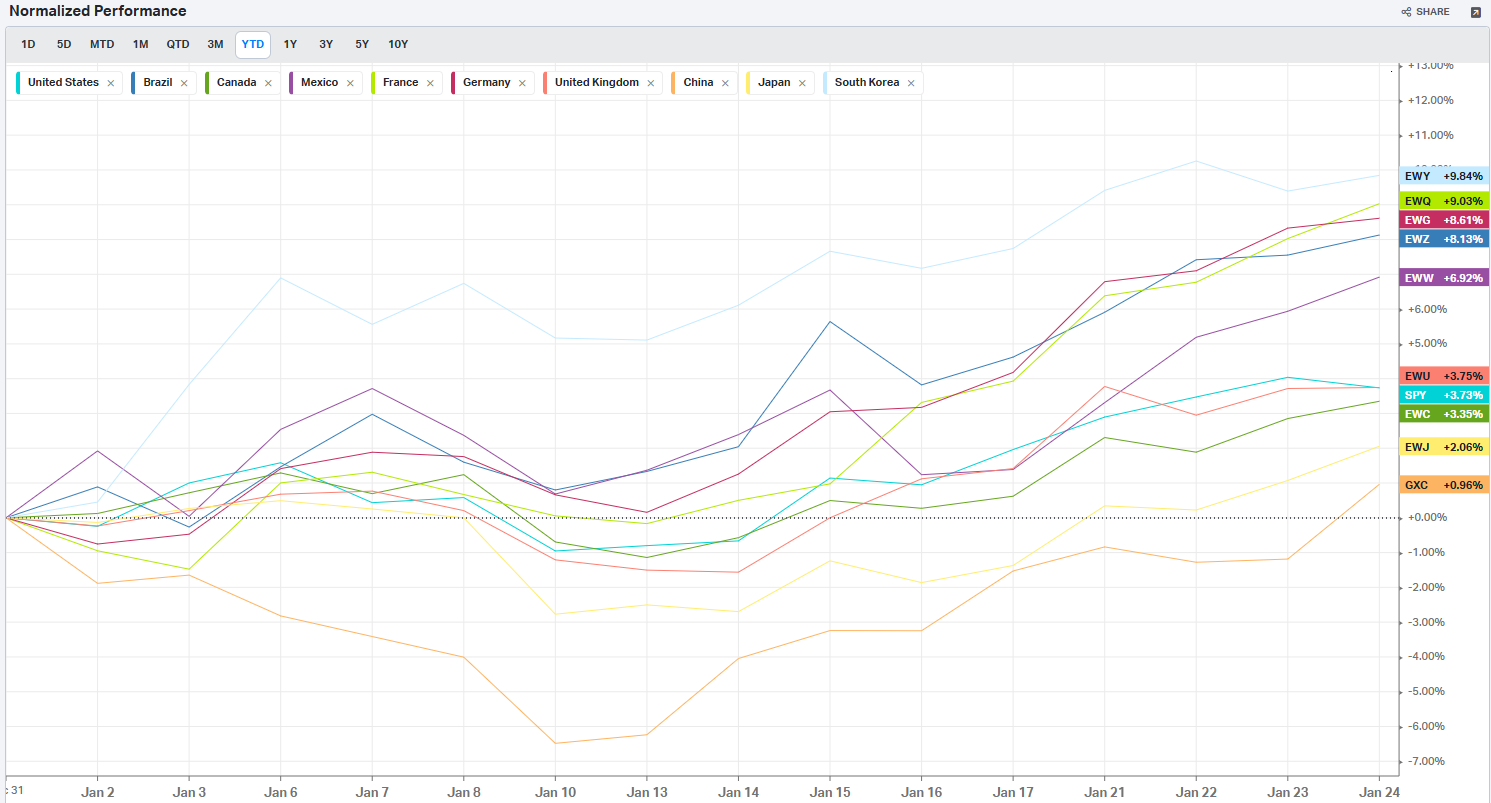
Country ETFs
Currencies
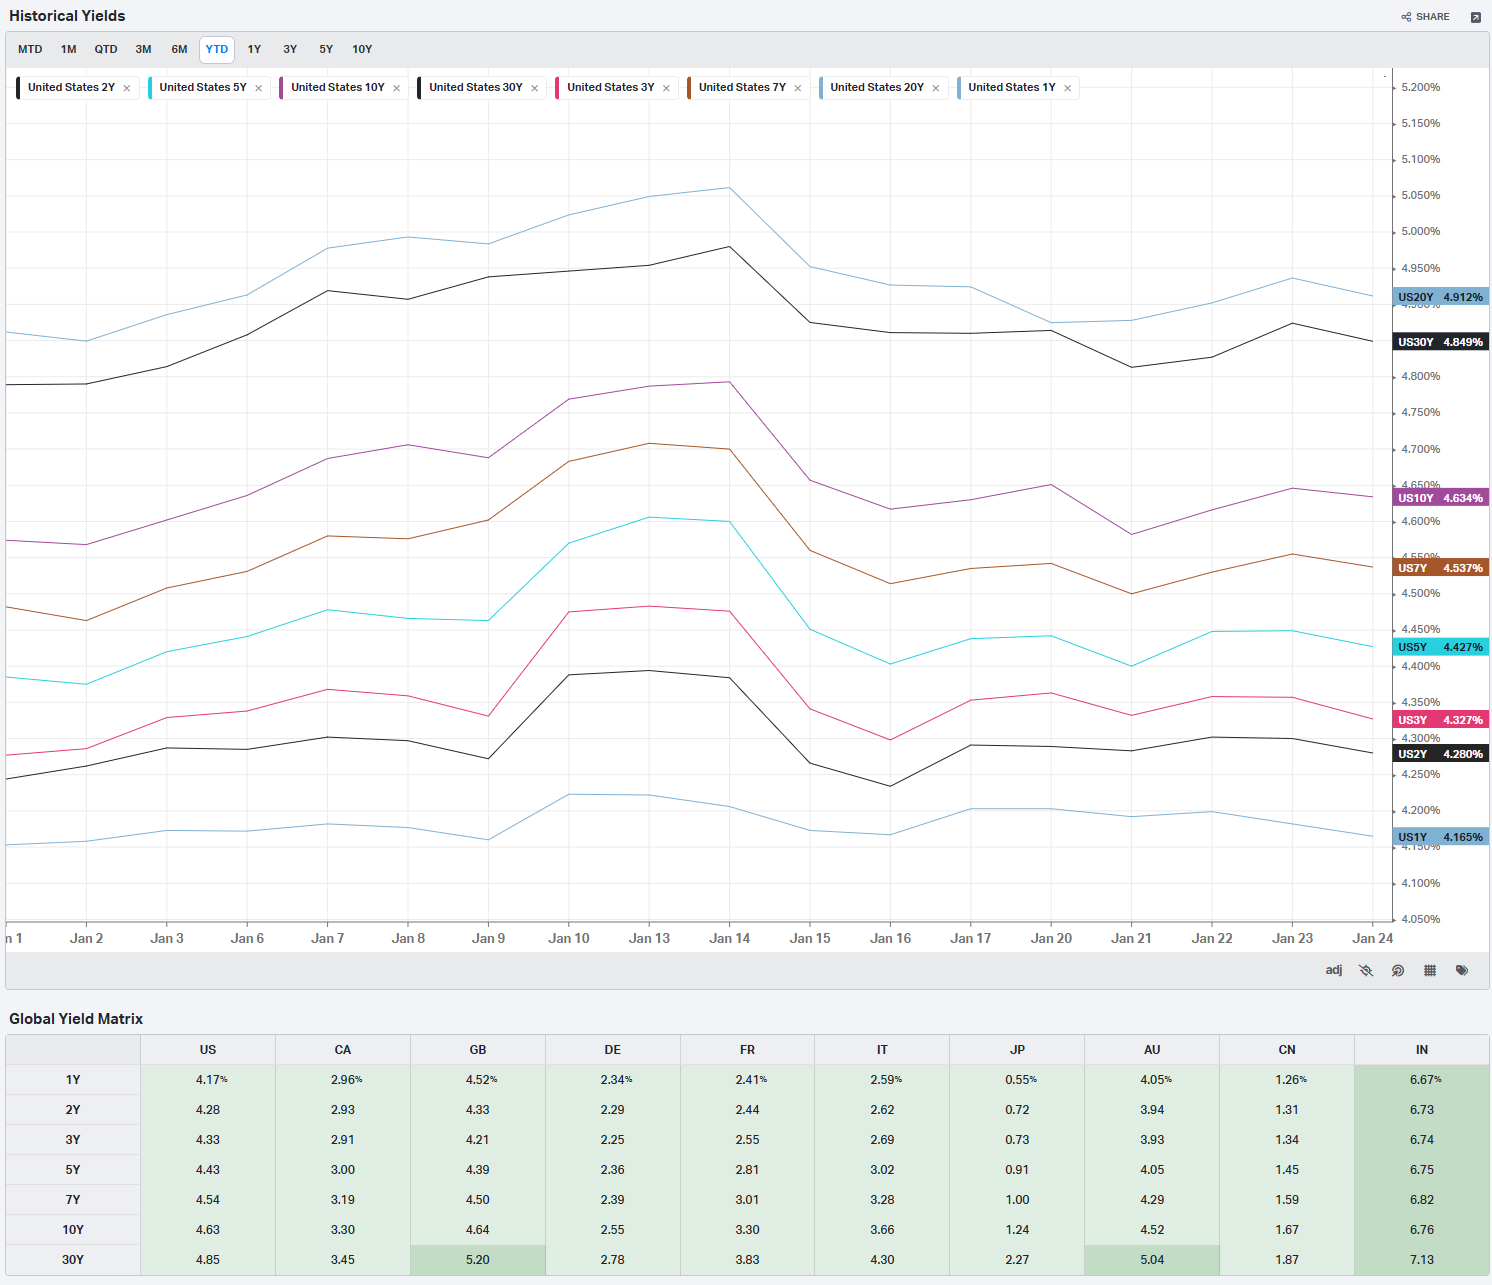
Global Yields
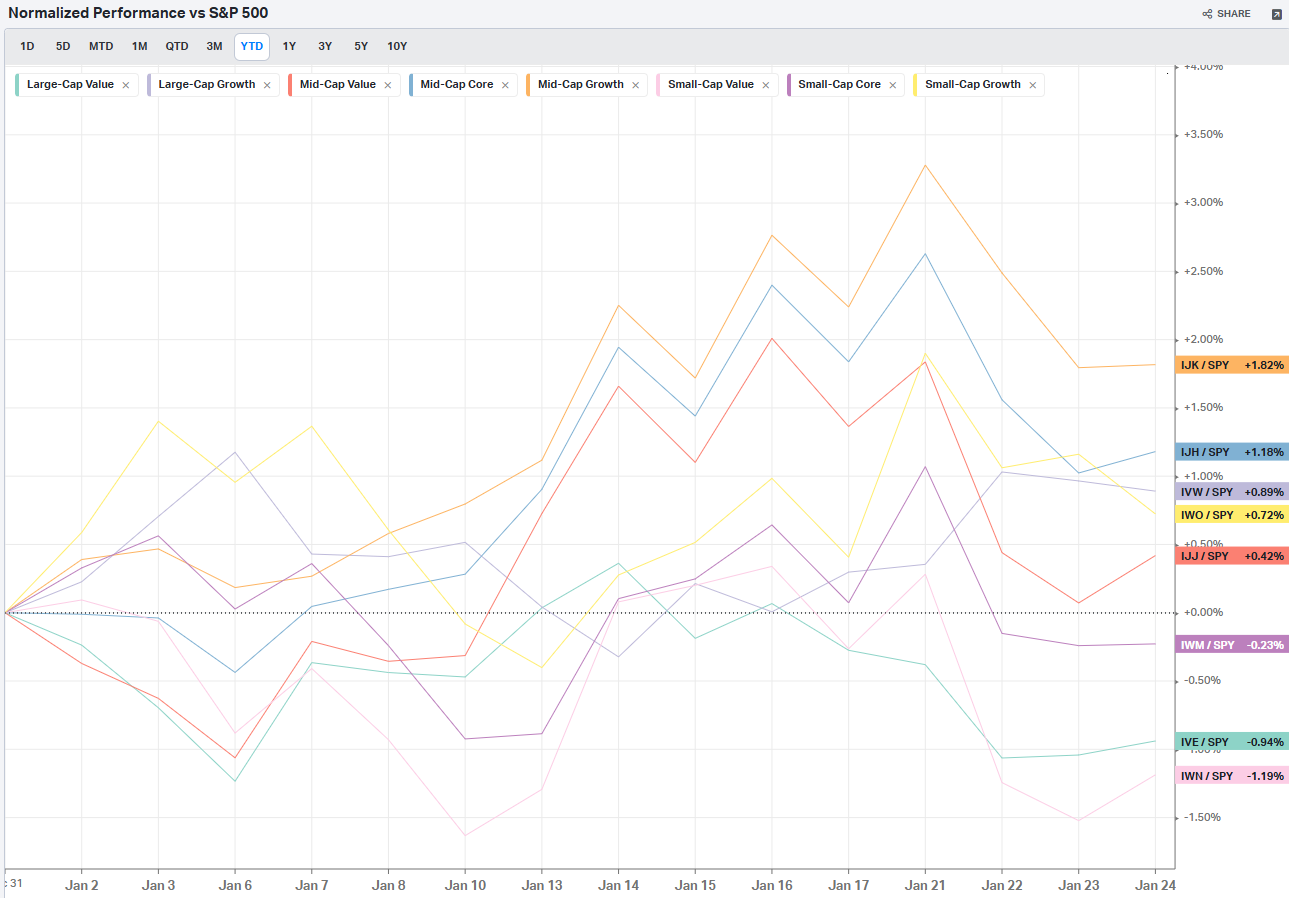
Factors: Style
Factors: Size vs Value
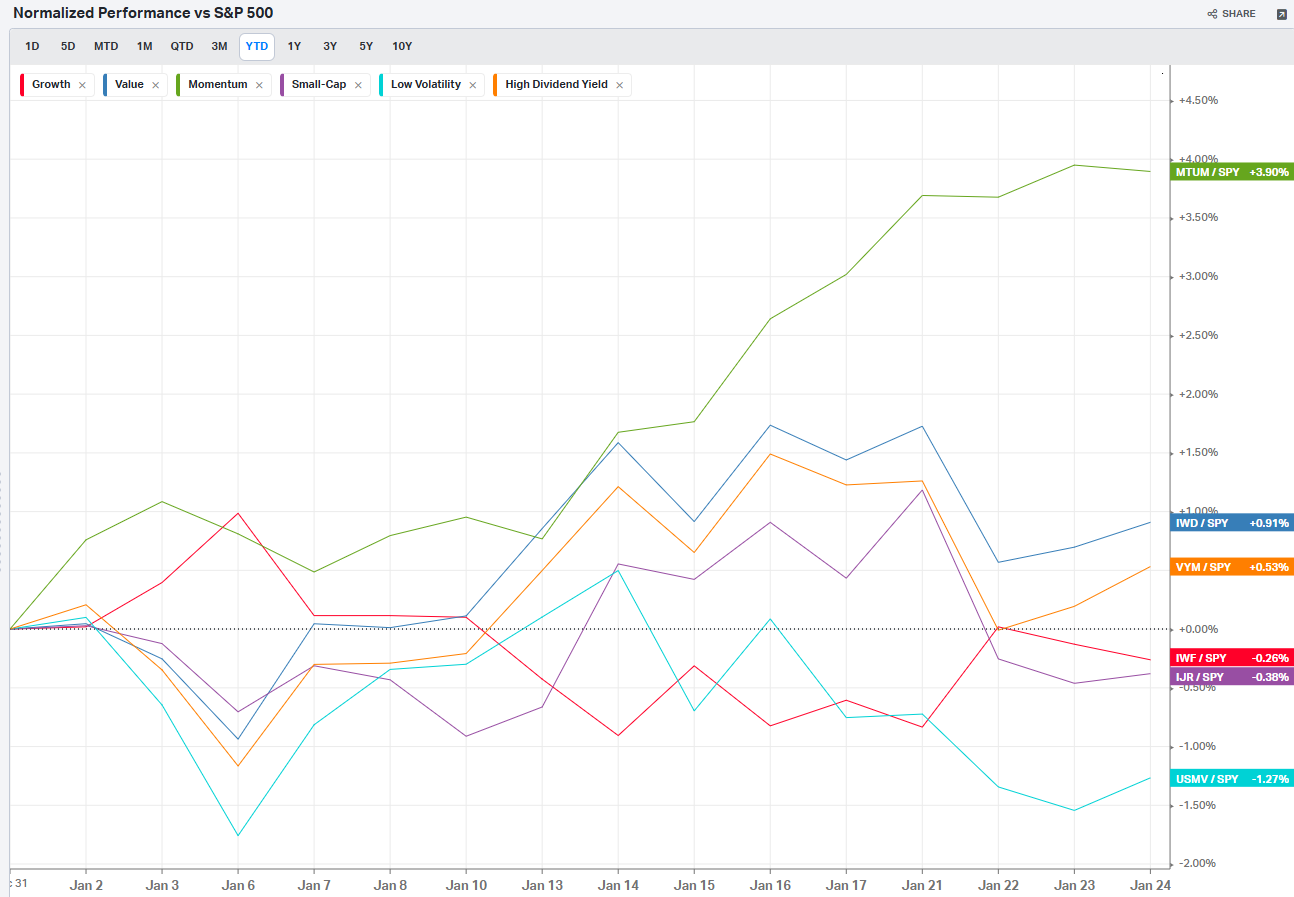
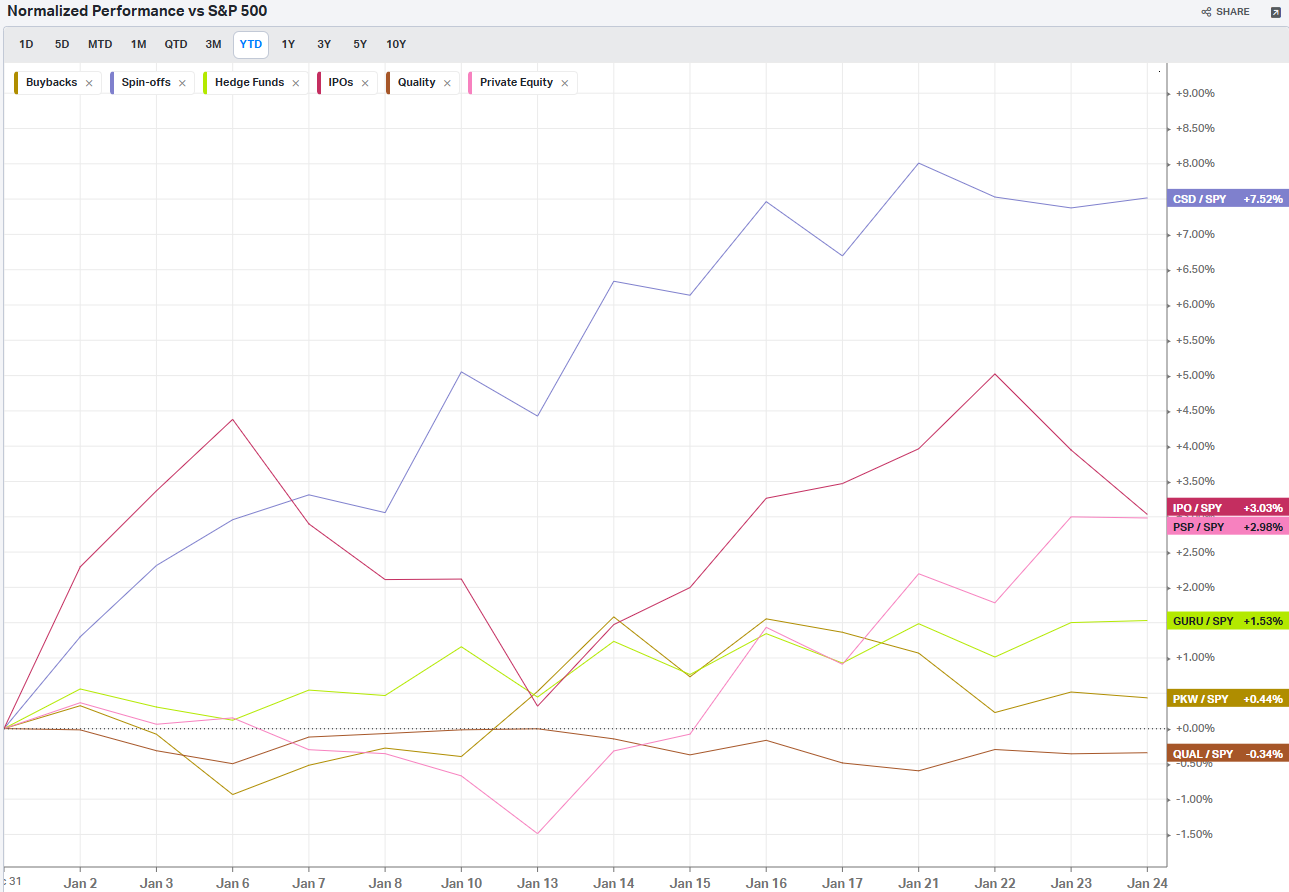
Factors: Qualitative
Social Media Favs
Analyzing social sentiment can provide valuable insights for investment strategies by offering a pulse on public perception, mood, and market sentiment that traditional financial indicators might not capture. Here’s how social sentiment analysis can enhance investment decisions:
Market Momentum: Positive or negative social sentiment can signal impending momentum shifts. When public opinion on a stock, sector, or asset class changes sharply, it can create buying or selling pressure, especially if that sentiment becomes widespread.
Early Detection of Trends: Social sentiment data can help investors spot trends before they show up in technical or fundamental data. For example, increased positive chatter around a particular company or sector might indicate growing interest or excitement, which could lead to price appreciation.
Gauge Retail Investor Impact: With the rise of retail investor platforms, collective sentiment on social media can lead to significant price movements (e.g., meme stocks). Understanding how retail investors view certain stocks can help in identifying high-volatility opportunities.
Event Reaction Monitoring: Social sentiment can provide real-time reactions to news events, product releases, or earnings reports. Investors can use this information to gauge market reaction quickly and adjust their strategies accordingly.
Complementing Quantitative Models: By adding a social sentiment layer to quantitative models, investors can enhance predictions. For example, a model that tracks historical price and volume data might perform even better when factoring in sentiment trends as a measure of market psychology.
Risk Management: Negative sentiment spikes can be a signal of potential downturns or increased volatility. By monitoring sentiment, investors might avoid or hedge against investments in companies experiencing a public relations crisis or facing negative perceptions.
Long-Term Sentiment Trends: Sustained sentiment trends, whether positive or negative, often mirror longer-term market cycles. Tracking sentiment trends over time can help identify shifts in investor psychology that could affect longer-term investments or sector rotations.
For these reasons, sentiment analysis, when combined with other tools, can provide a comprehensive view of both immediate market reactions and underlying investor attitudes, helping investors position themselves strategically across various time frames. Here are the most mentioned/discussed tickers on Reddit from some of the most active Subreddits for trading:

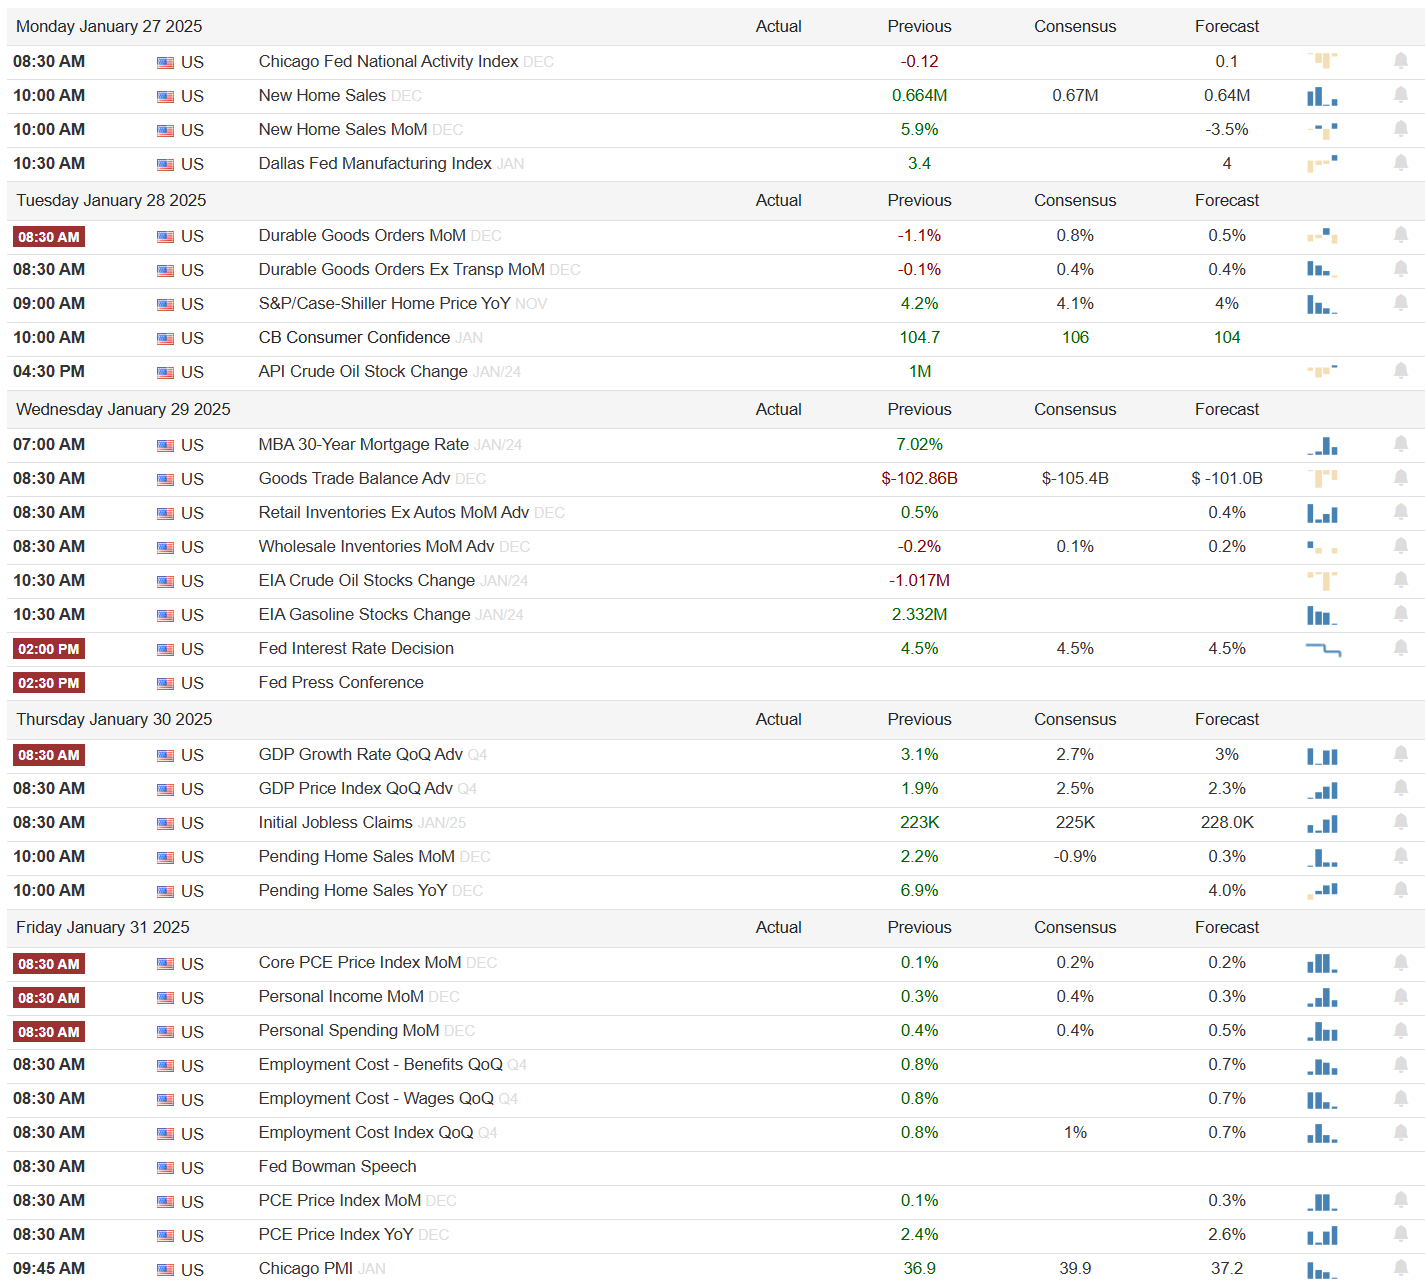
Events On Deck This Week
Here are key events happening this week that have the potential to cause outsized moves in the market or heightened short-term volatility.
Econ Events By Day of Week
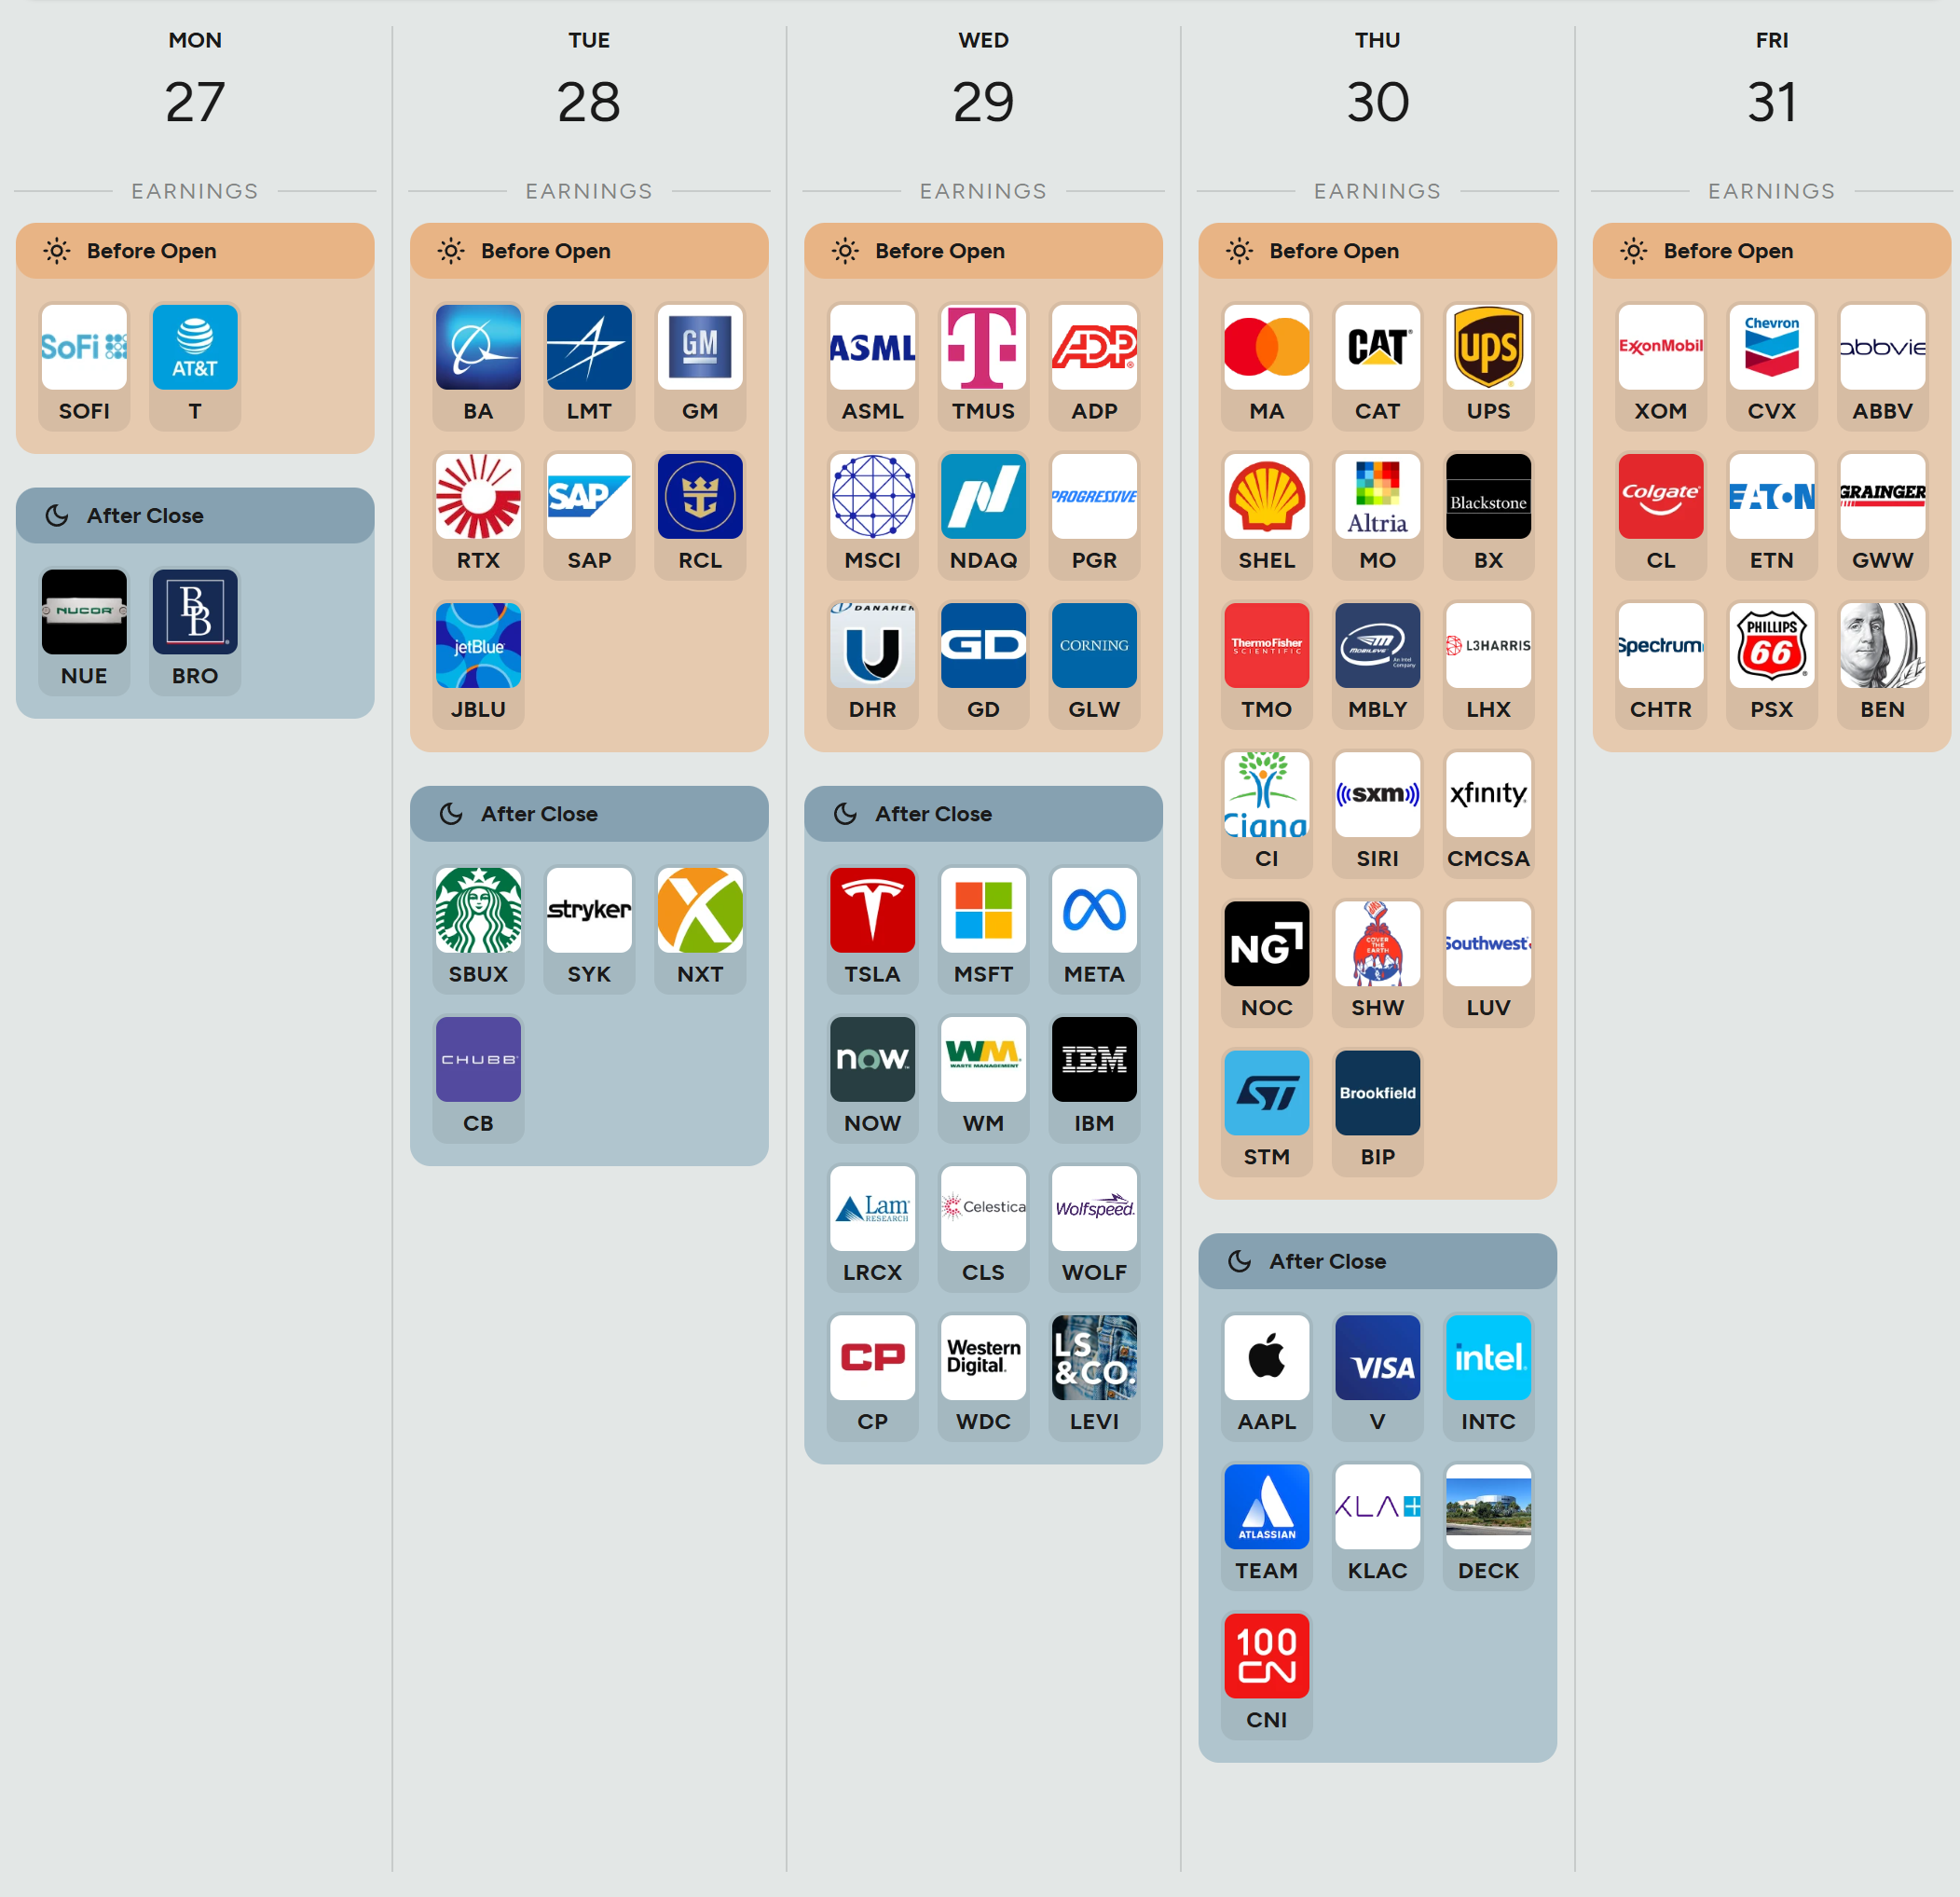
Anticipated Earnings By Day of Week
Thank you for being part of our community and for taking the time to read this publication. Your engagement and insights mean a great deal to all of us, and we're genuinely grateful to share this space with such dedicated and thoughtful readers. Wishing you a productive and successful week ahead in the markets. May the coming days bring clarity and great opportunities. Happy trading!