Market Momentum: Your Weekly Financial Forecast & Market Prep
Issue 32 / What to expect Feb 10, 2025 thru Feb 14, 2025
In This Issue
Market-On-Close: All of last week’s market-moving news and macro context in under 5 minutes + futures-snapshots
Special Coverage: Tough Tariff Talk: What It Means for Investors & the U.S. Stock Market
The Latest Investor Sentiment Readings
Institutional Support & Resistance Levels For Major Indices: Exactly where to look for support and resistance this week in SPY, QQQ, IWM & DIA
Institutional Activity By Sector: Institutional order flow by sector including the top institutionally-backed names in those sectors. We break it all down and provide the key insights and take-aways you need to navigate institutional positioning this week.
Top Institutional Order Flow In Individual Names: All of the largest sweeps and blocks on lit exchanges and hidden dark pools
Investments In Focus: Bull vs Bear arguments for CART, MCD, ASTS
Top Institutionally-Backed Gainers & Losers: An explosive watchlist for day traders seeking high-volatility
Normalized Performance By Thematics YTD (Sector, Industry, Factor, Energy, Metals, Currencies, and more): which corners of the markets are beating benchmarks, which ones are overlooked and which ones are over-crowded
Key Econ Events and Earnings On-Deck For This Week

Market-On-Close
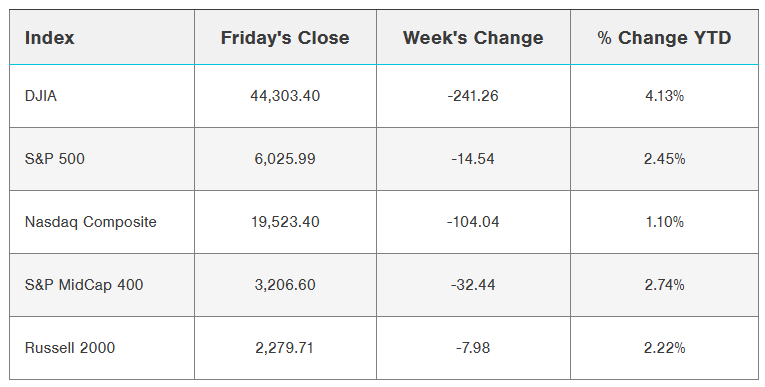
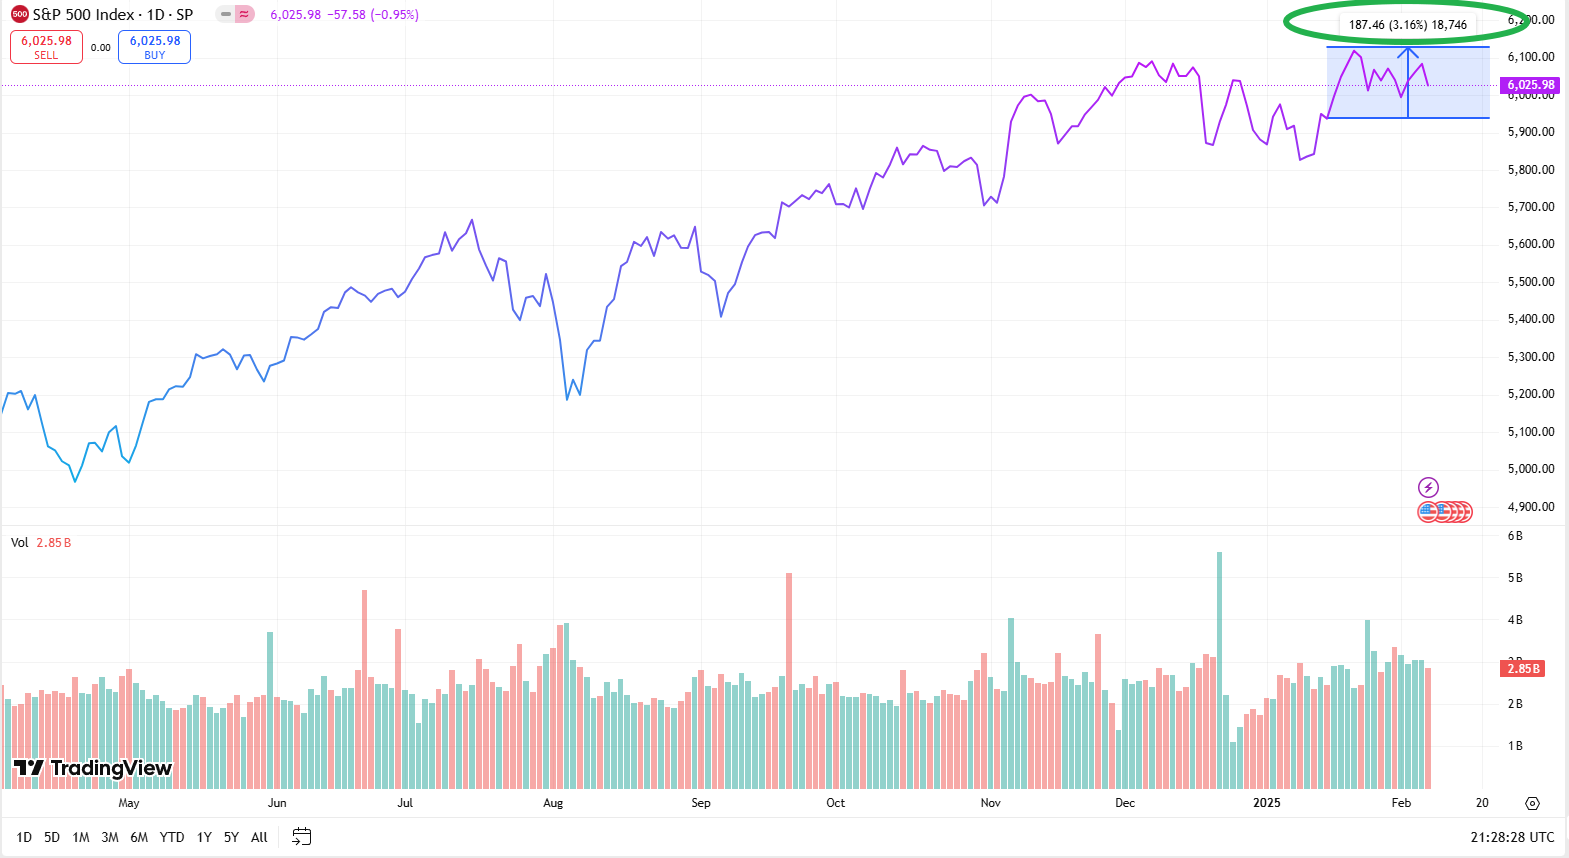
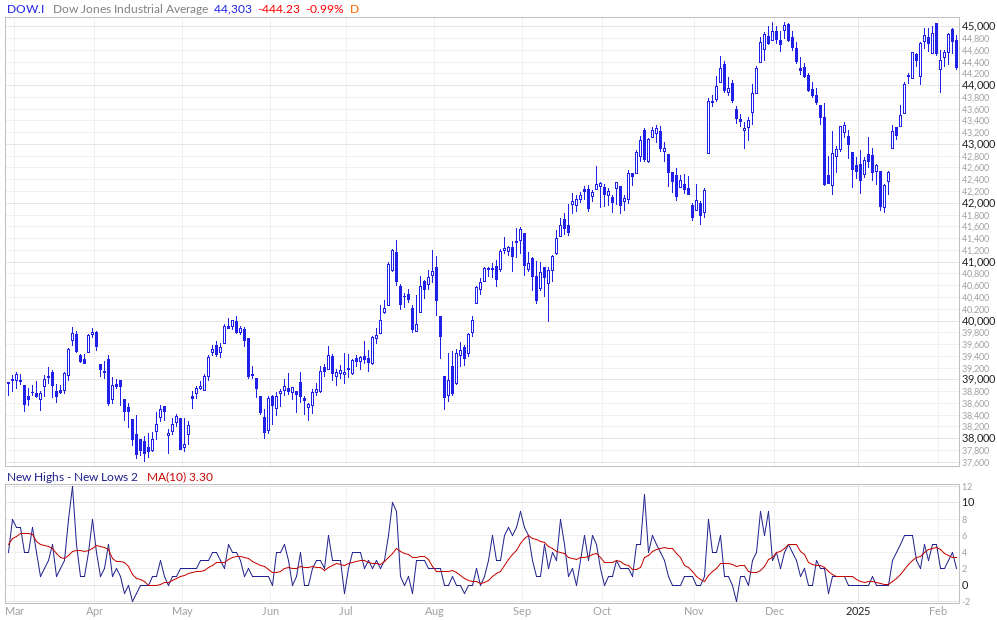
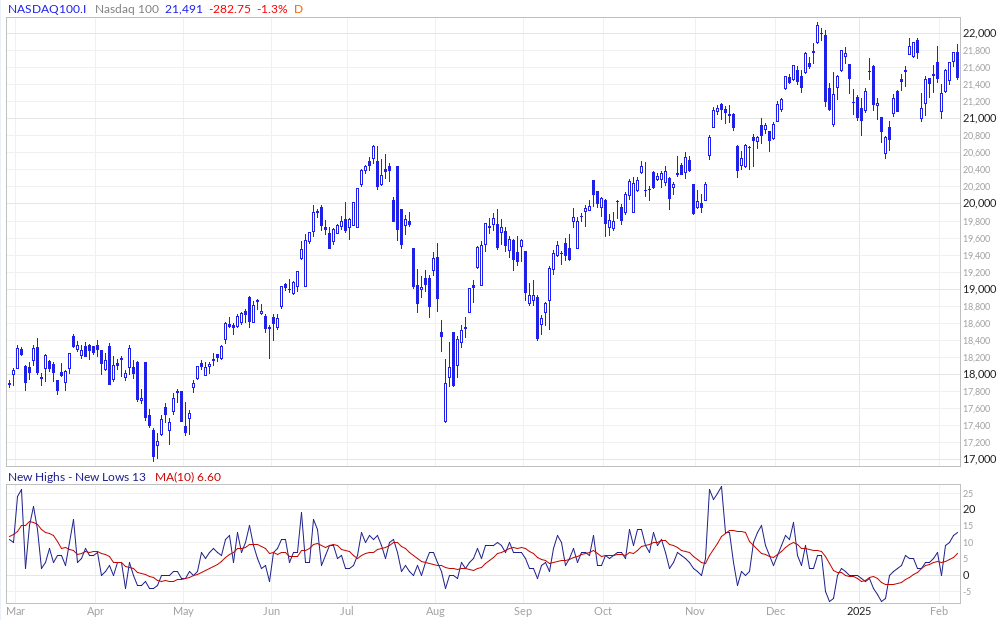
The first week of February 2025 brought significant challenges to U.S. financial markets as multiple headwinds converged to pressure equity indices. The S&P 500 demonstrated relative resilience with a modest decline of 0.95%, while the Dow Jones Industrial Average fell 0.99% and the Nasdaq 100 experienced a more pronounced drop of 1.30%. These movements came amid a complex interplay of economic data, policy developments, and corporate earnings releases that shaped market sentiment throughout the week.
The week's trading narrative was dramatically altered by President Trump's announcement regarding new tariff implementations. The declaration of potential reciprocal tariffs sent immediate ripples through the market, though some pressure was alleviated when tariffs on Mexico and Canada were subsequently postponed for 30 days. This development injected a new element of uncertainty into market dynamics, particularly affecting sectors with significant international exposure.

January's employment data presented market participants with a nuanced picture of labor market conditions. While the headline nonfarm payrolls figure of 143,000 fell short of the anticipated 175,000, the December figures received a substantial upward revision to 307,000 from the previously reported 256,000. More notably, the unemployment rate unexpectedly decreased to 4.0%, marking an eight-month low and suggesting continued labor market strength. Wage growth also exceeded expectations, with average hourly earnings rising 0.5% month-over-month and 4.1% year-over-year, surpassing projected increases of 0.3% and 3.8% respectively.

Consumer sentiment data raised some concerns as the University of Michigan's February index unexpectedly declined to 67.8, its lowest level in seven months. The reading came in well below expectations of 71.8, reflecting growing consumer anxiety about potential inflationary pressures from trade policies. Adding to these concerns, inflation expectations showed marked increases, with the one-year outlook jumping to 4.3% and the five-to-ten-year projection reaching 3.3%, representing fifteen-month and sixteen-year highs respectively.
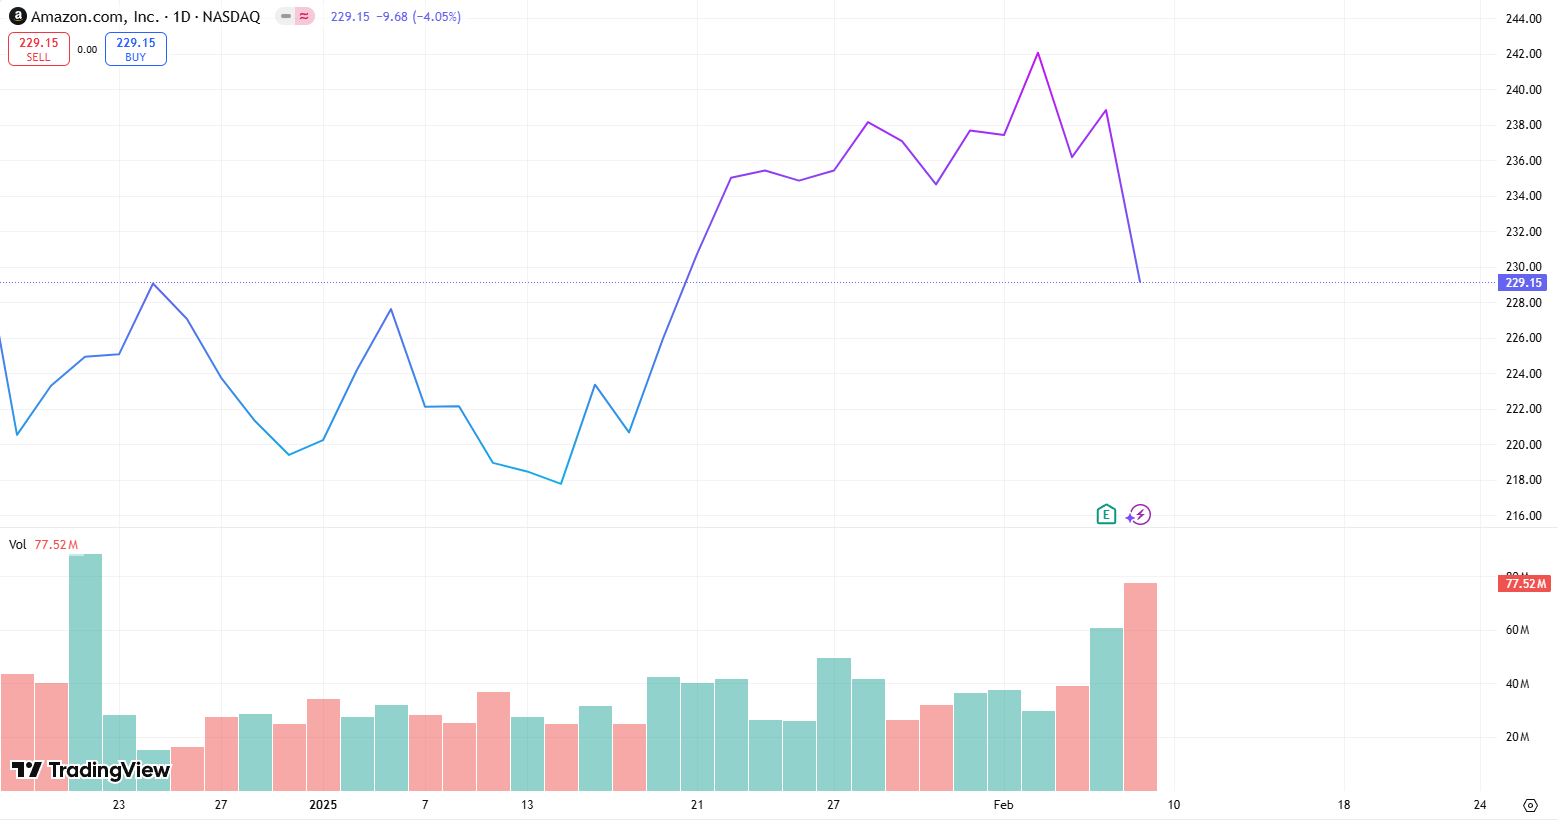
The ongoing fourth-quarter earnings season has largely exceeded initial expectations, with companies reporting an average growth rate of 7.5% year-over-year. Corporate performance, however, showed significant divergence across sectors. Amazon.com declined more than 4% after providing weaker-than-expected guidance, while Expedia Group surged over 17% following strong quarterly results. The technology sector displayed particular sensitivity to interest rate movements, with chip makers experiencing broad declines as bond yields advanced.
In the fixed income markets, March 10-year T-notes closed down by eleven ticks, with the yield rising 4.9 basis points to 4.483%. The trading session saw notable volatility as notes initially spiked to a one-and-a-half month high before retreating, with the yield rebounding from a low of 4.380%. These movements were largely driven by the employment data and inflation expectations, though some recovery occurred as equity market weakness increased demand for safe-haven assets.
Manufacturing sector data provided a bright spot in the economic landscape, as January marked the first expansion in activity since 2022. This development carries particular significance given the sector's previous extended contraction, though concerns about the impact of potential tariffs on the manufacturing recovery persist. German economic data meanwhile showed mixed signals, with December industrial production falling 2.4% month-over-month while exports unexpectedly rose 2.9%.
 for the first time in 26 months in January.")
The homebuilding sector faced significant pressure as rising yields and deteriorating consumer sentiment weighed on housing demand prospects. Companies like Toll Brothers and DR Horton experienced notable declines, with the sector's weakness reflecting broader concerns about interest rate sensitivity in the current market environment.
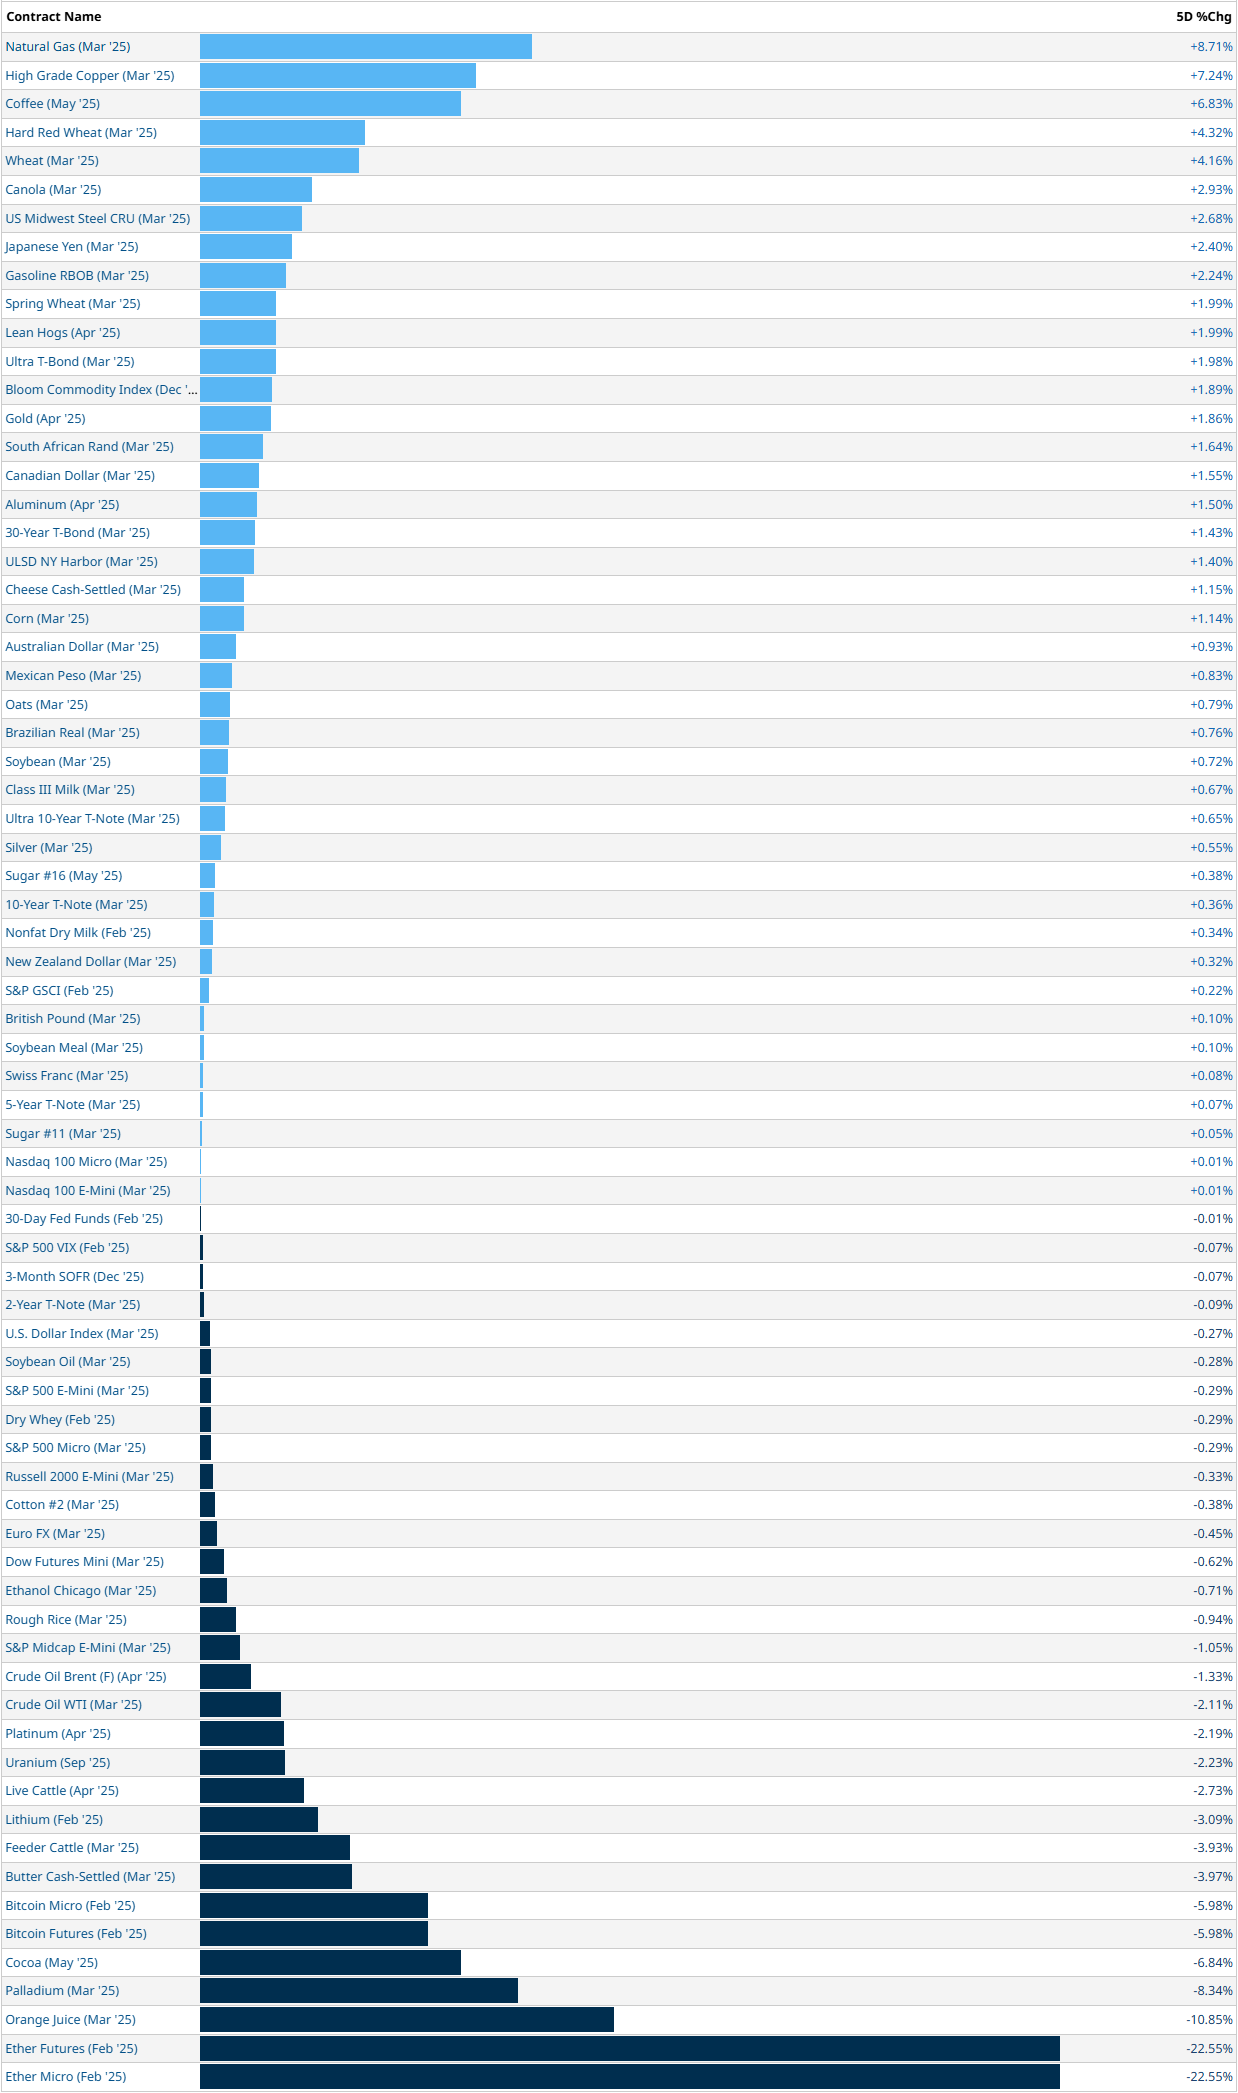
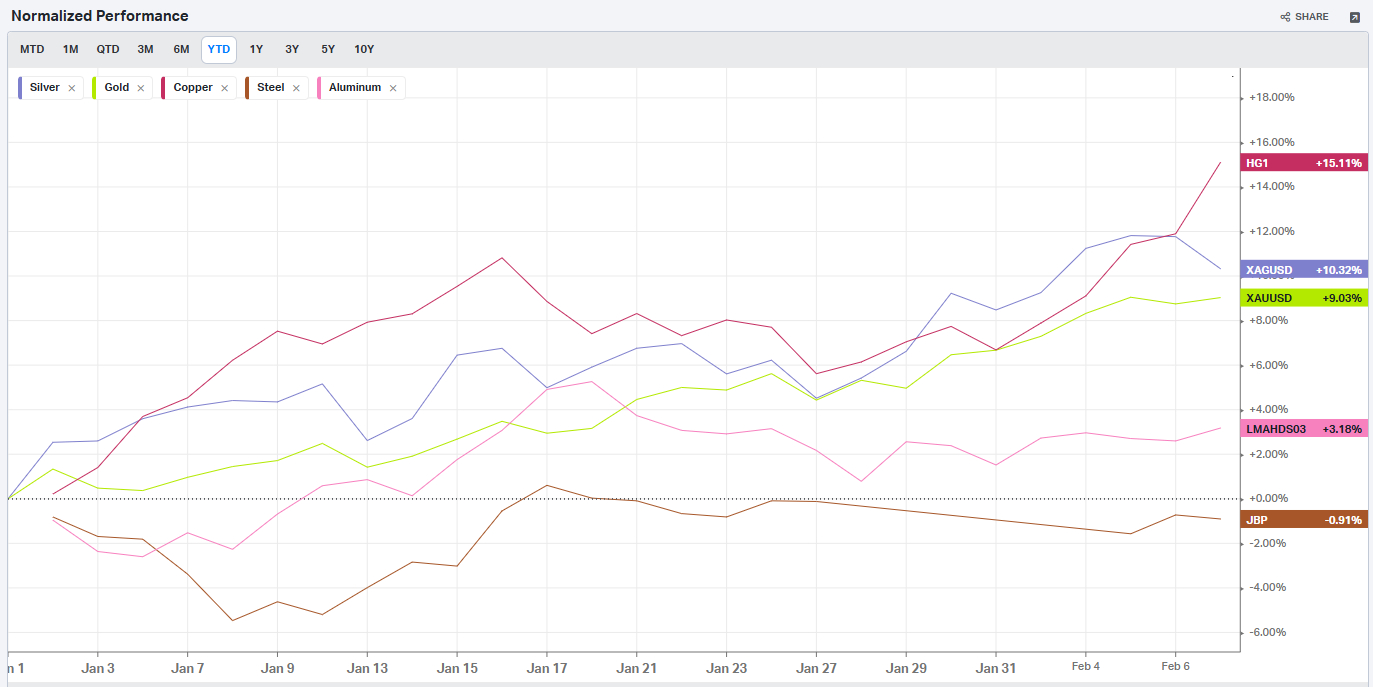
Commodity markets saw notable movements, with gold setting new record highs above $2,900 per ounce before settling around $2,890. Oil prices continued their recent decline, trading around $71 per barrel amid concerns about demand implications from trade tensions. Copper prices showed strength, rising more than 3% to reach a four-month high.
Current economic indicators suggest the U.S. economy remains on a solid growth trajectory. Fourth-quarter GDP growth came in at 2.3% annualized, contributing to full-year 2024 growth of 2.8%. Consumer spending has maintained robust momentum, with fourth-quarter consumption growing at 4.2%, well above long-term averages of approximately 3%. This strength in consumption, which accounts for roughly 68% of GDP, provides important support for continued economic expansion.
The Federal Reserve's policy trajectory has become increasingly complex given recent data. Markets are currently pricing just a 10% probability of a rate cut at the March FOMC meeting. Fed officials have provided mixed signals, with Minneapolis Fed President Kashkari suggesting inflation's continued moderation could allow for modest rate cuts by year-end, while Dallas Fed President Logan indicated rates might already be near neutral levels.
Looking ahead, market participants must navigate several key variables. The implementation and scope of trade policies remain a significant source of uncertainty, with potential implications for both economic growth and inflation. These policies could particularly impact sectors with high international exposure, as Mexico, Canada, and China collectively account for approximately 42% of total U.S. trade, representing over $2 trillion in value.
Historical precedent suggests meaningful economic impact from trade actions, with Fed research indicating that U.S. tariffs during 2018-2019 contributed to a 0.1%-0.3% increase in inflation while reducing economic growth by 0.3%-0.5%. The current situation could potentially have larger effects given the broader scope of proposed trade actions.
Corporate earnings will continue to influence market direction, with current results suggesting resilient profit growth. Among S&P 500 companies reporting thus far, 77% have exceeded earnings expectations and 63% have surpassed sales forecasts. This performance supports the narrative of underlying corporate strength, though guidance and outlook statements suggest increasing caution about potential headwinds.

The market environment heading into the remainder of 2025 suggests a period of potentially increased volatility following two years of solid gains and relatively low market fluctuations. While fundamental supports remain in place, including above-trend economic growth and strong corporate profits, the intersection of trade policy uncertainty, inflation concerns, and Federal Reserve policy adjustments creates a more complex trading landscape. The upcoming Consumer Price Index report will provide another important data point for assessing inflation trends, with particular attention to whether the recent pattern of slightly hotter-than-expected readings continued into January.

This evolving market environment underscores the importance of maintaining a balanced approach to risk management while remaining attuned to shifting sector dynamics and correlation patterns. The interaction between trade policy developments, monetary policy expectations, and underlying economic fundamentals suggests a trading environment that will reward careful analysis and robust risk management practices.
5-Day Futures Performance Leaders
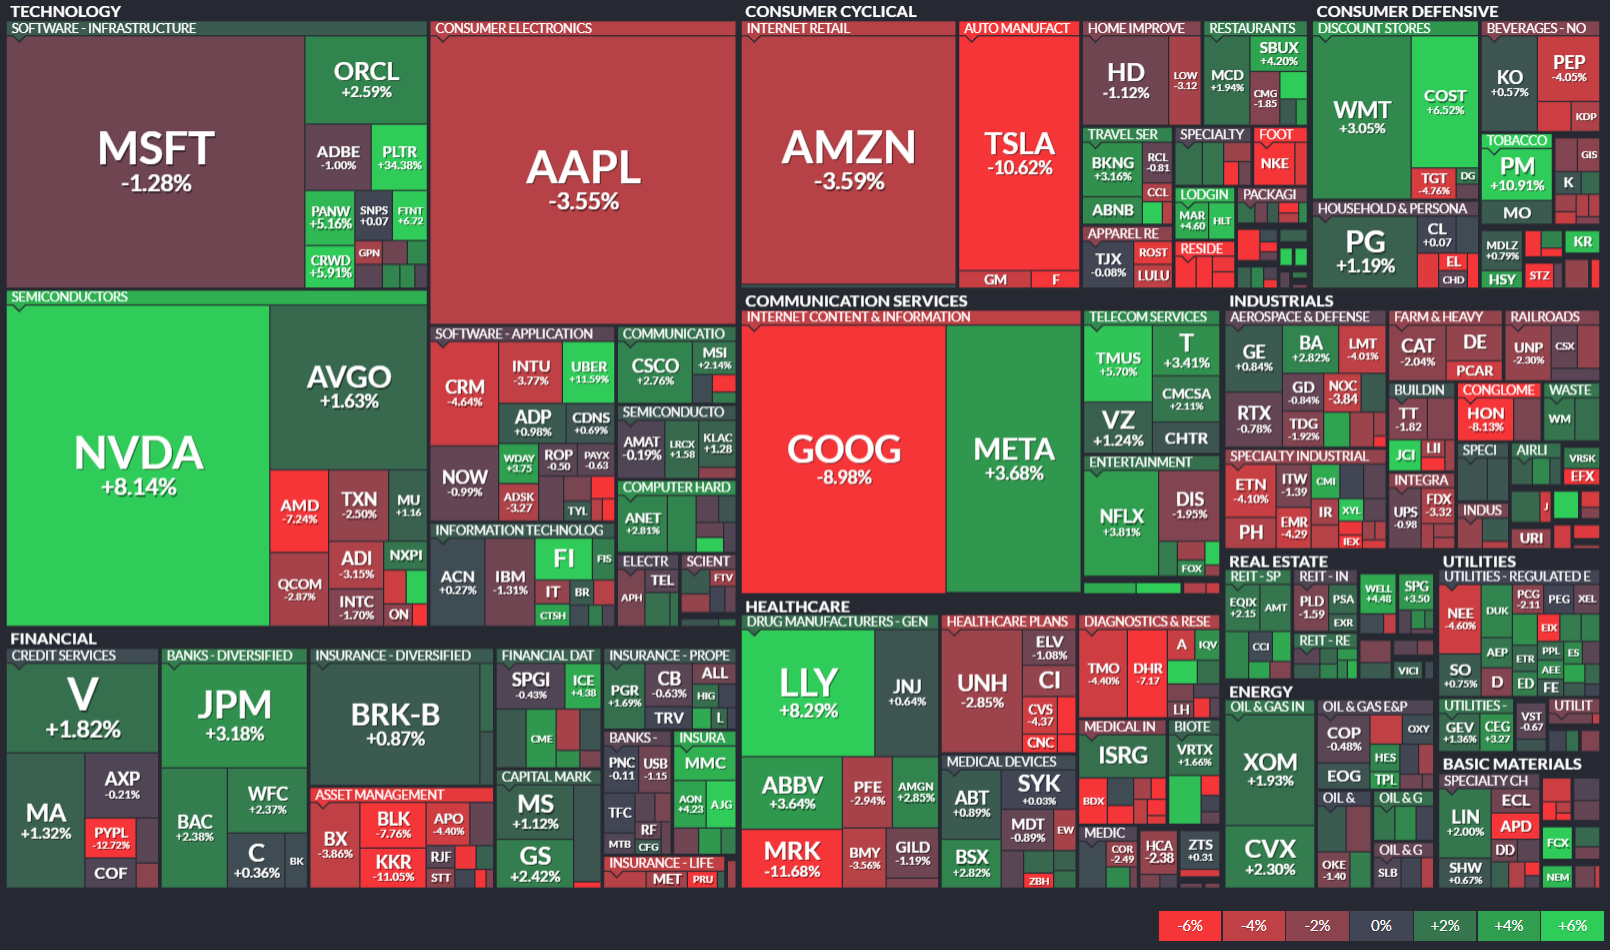
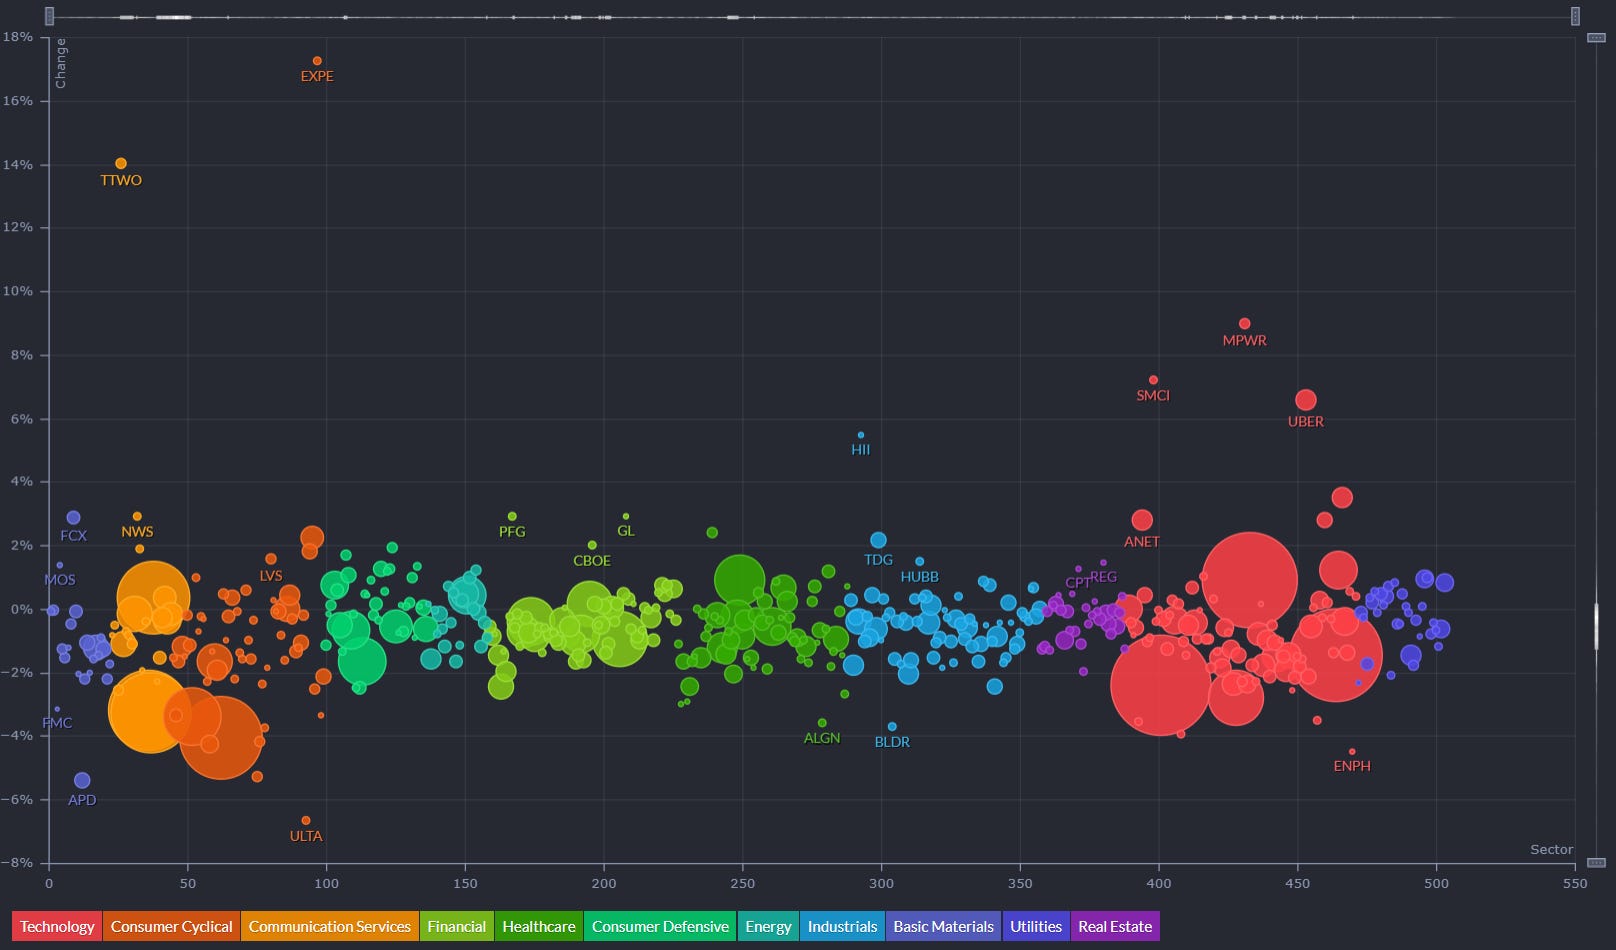
S&P 500 Sector Insights
Sector Overview With Individual Names By Market Cap
Sector 5-Day Leaderboard
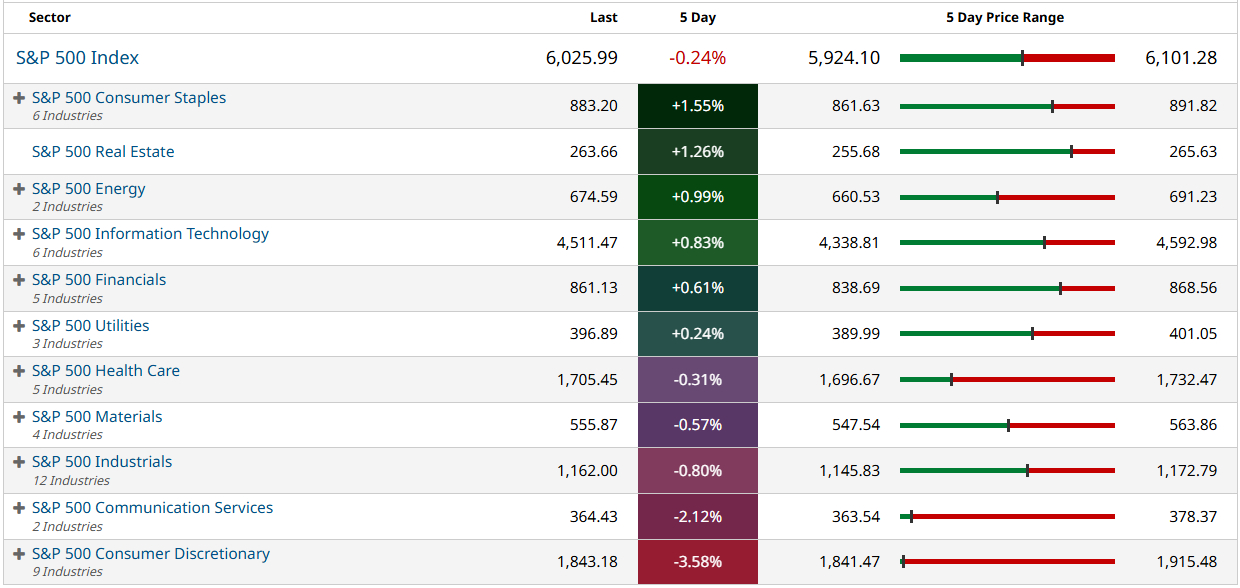
Sector Sinkers vs Swimmers
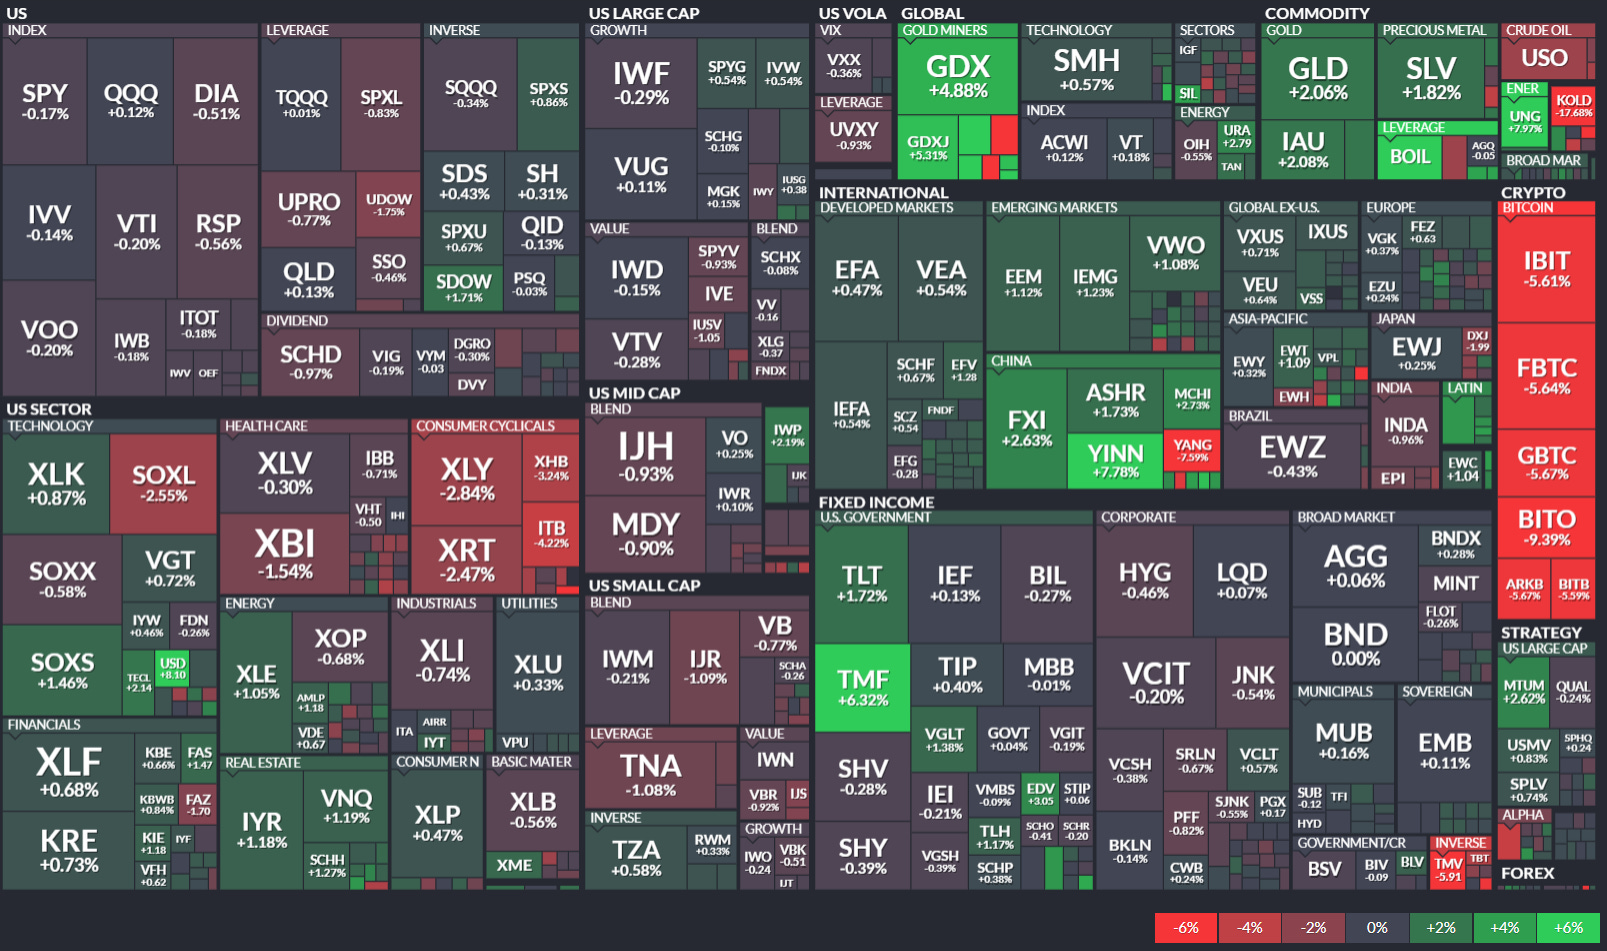
ETF Insights
Reviewing a heatmap like this weekly can be incredibly helpful for investors as it provides a quick and visual summary of market performance across various sectors, asset classes, and geographies.
1. Sector and Asset Class Trends
Identify Strong and Weak Sectors: Investors can quickly spot which sectors (e.g., technology, energy, healthcare) are performing well or underperforming.
Asset Class Diversification: Seeing how commodities, fixed income, equities, and cryptocurrencies performed helps assess diversification.
2. Market Sentiment
Risk-On or Risk-Off: A green-dominated map suggests bullish sentiment, while red indicates bearish sentiment. Investors can align their strategies accordingly.
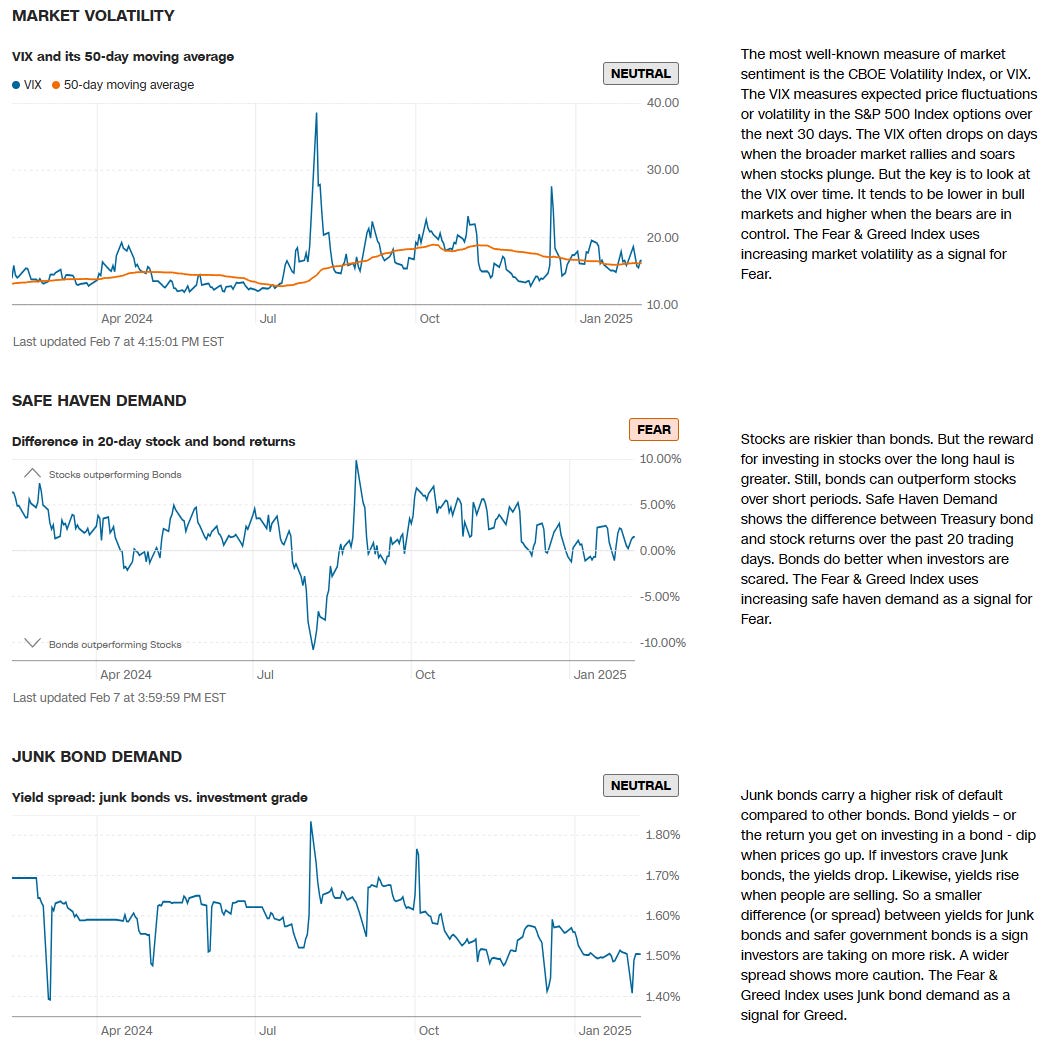
Volatility Indicators: Observing movements in volatility indices (e.g., VIX) can highlight changing market dynamics.
3. Regional Analysis
Global Insights: Performance in developed and emerging markets (e.g., Europe, China, Asia-Pacific) helps in gauging international investment opportunities or risks.
Currency Impacts: Movements in forex or country-specific ETFs can indicate currency-driven market trends.
4. Thematic Trends
Growth vs. Value: Comparing the performance of growth ETFs (e.g., VUG) versus value ETFs (e.g., VTV) reveals the prevailing market preference.
Industry Leadership: Highlighting leadership within industries (e.g., gold miners, semiconductors) can inform thematic plays.
5. Monitoring Investments
Portfolio Alignment: Investors can track how their existing investments or watchlist align with broader market trends.
Rotation Signals: Seeing week-over-week changes in sector dominance may signal sector rotation opportunities.
6. Risk Management
Recognizing Overbought/Oversold Conditions: Consistent underperformance or overperformance in specific areas may indicate potential mean-reversion trades.
Correlation Awareness: By observing how different asset classes move, investors can manage portfolio correlation and risk.
7. Decision Support
Identify Outperformers/Underperformers: ETFs, sectors, or indices that repeatedly outperform or underperform can help refine trading or investment strategies.
Macro Perspective: Weekly trends highlight macroeconomic or geopolitical influences affecting markets.
Regularly reviewing a heatmap like this is a strategic practice that supports data-driven decision-making while fostering a holistic understanding of market dynamics.
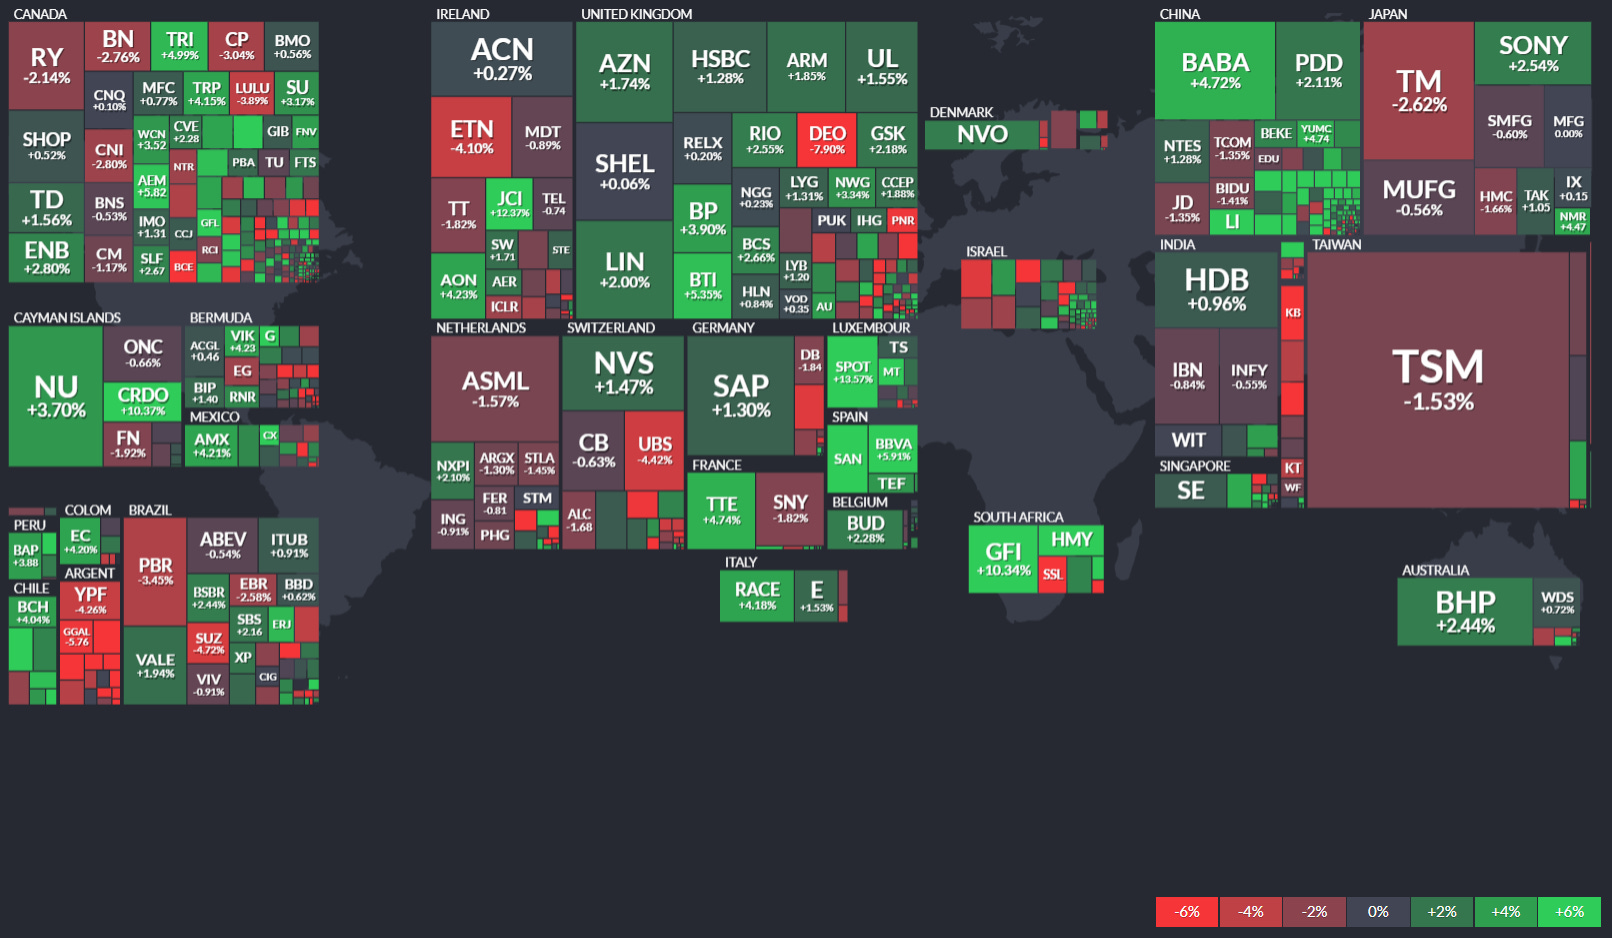
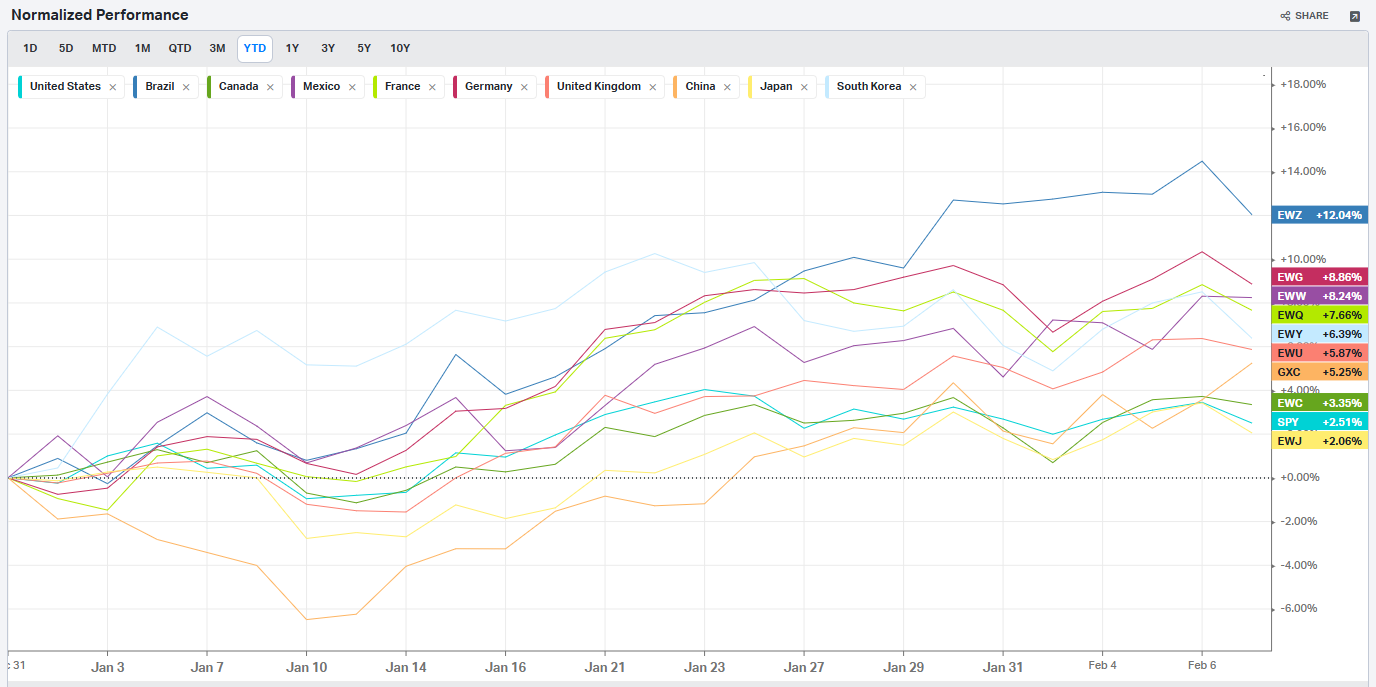
Global Overview
Reviewing a global heatmap like this weekly is valuable for investors because it offers insights into international markets, helping to:
Identify Global Trends: Spot which regions or countries are performing well or underperforming.
Assess Sector and Regional Performance: Understand how industries are faring across different regions.
Diversify Portfolios: Uncover opportunities in emerging or developed markets for greater diversification.
Gauge Global Sentiment: Recognize the impact of macroeconomic events on specific regions.
Align with Global Strategies: Refine investment strategies based on regional strengths or weaknesses.
This overview ensures investors stay informed about global opportunities and risks, complementing their domestic market analysis.

Special Coverage
Tough Tariff Talk: What It Means for Investors & the U.S. Stock Market
The U.S. equity market has been caught in a peculiar state of suspended animation. Despite maintaining levels near all-time highs, beneath the surface, crosscurrents of uncertainty are roiling individual sectors and creating notable divergences that sophisticated investors can't afford to ignore. The catalyst? A renewed wave of tariff rhetoric that's forcing traders to recalibrate their positioning across asset classes.
Market Technicals: Reading Between the Lines
The S&P 500's apparent calm – trading within a mere 3% band since the U.S. election – masks significant rotation beneath the surface.
Technical analysts at Strategas Research highlight a troubling development: the percentage of large-cap stocks maintaining their uptrends has slipped below 60%, marking the lowest reading in over a year. This deterioration in market breadth typically serves as an early warning signal for institutional investors.
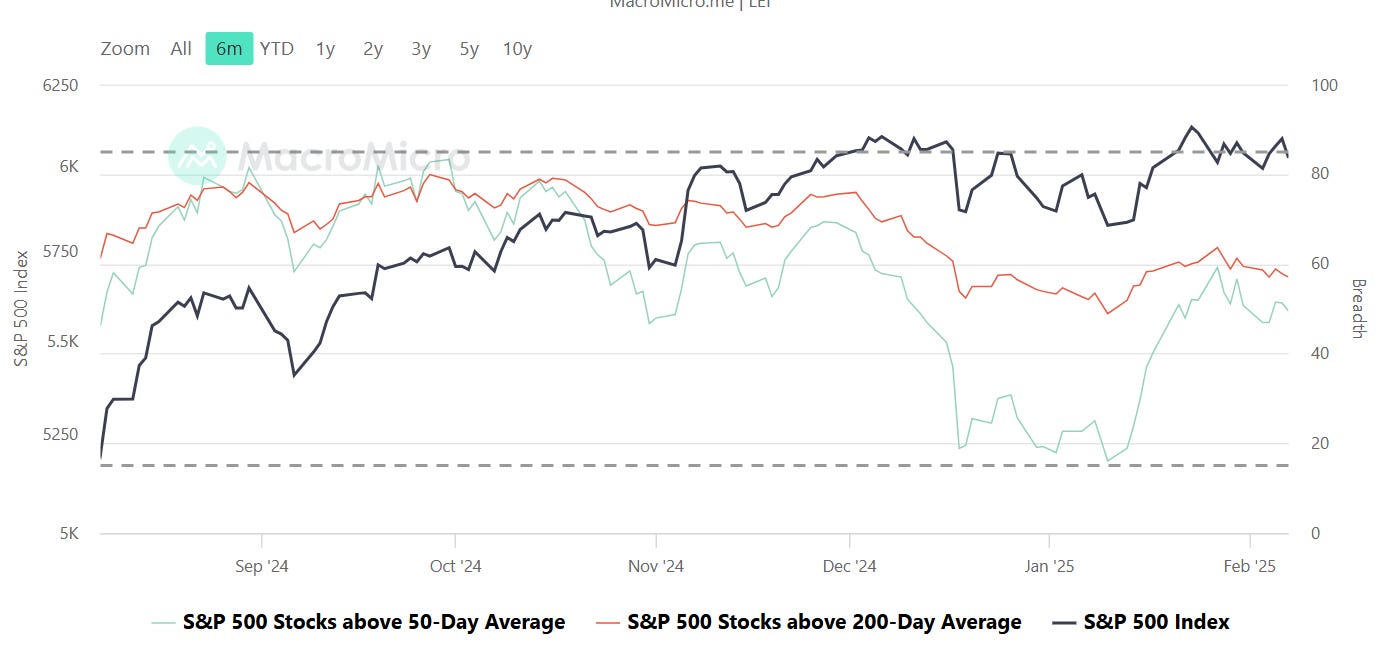
The index's stubborn persistence near the 6,000 level speaks more to the market's sophisticated game of musical chairs than genuine strength. As one sector falters, another rises to take its place, creating what veteran traders call a "rolling correction" rather than a traditional broad-based selloff.
The Magnificent Seven: A Changing of the Guard?
Perhaps most telling is the recent underperformance of the market's longtime leaders. The vaunted Magnificent Seven tech giants have lagged the broader S&P 500 by six percentage points since the Federal Reserve's December 19th meeting – a meaningful divergence that's catching the attention of quantitative strategists.
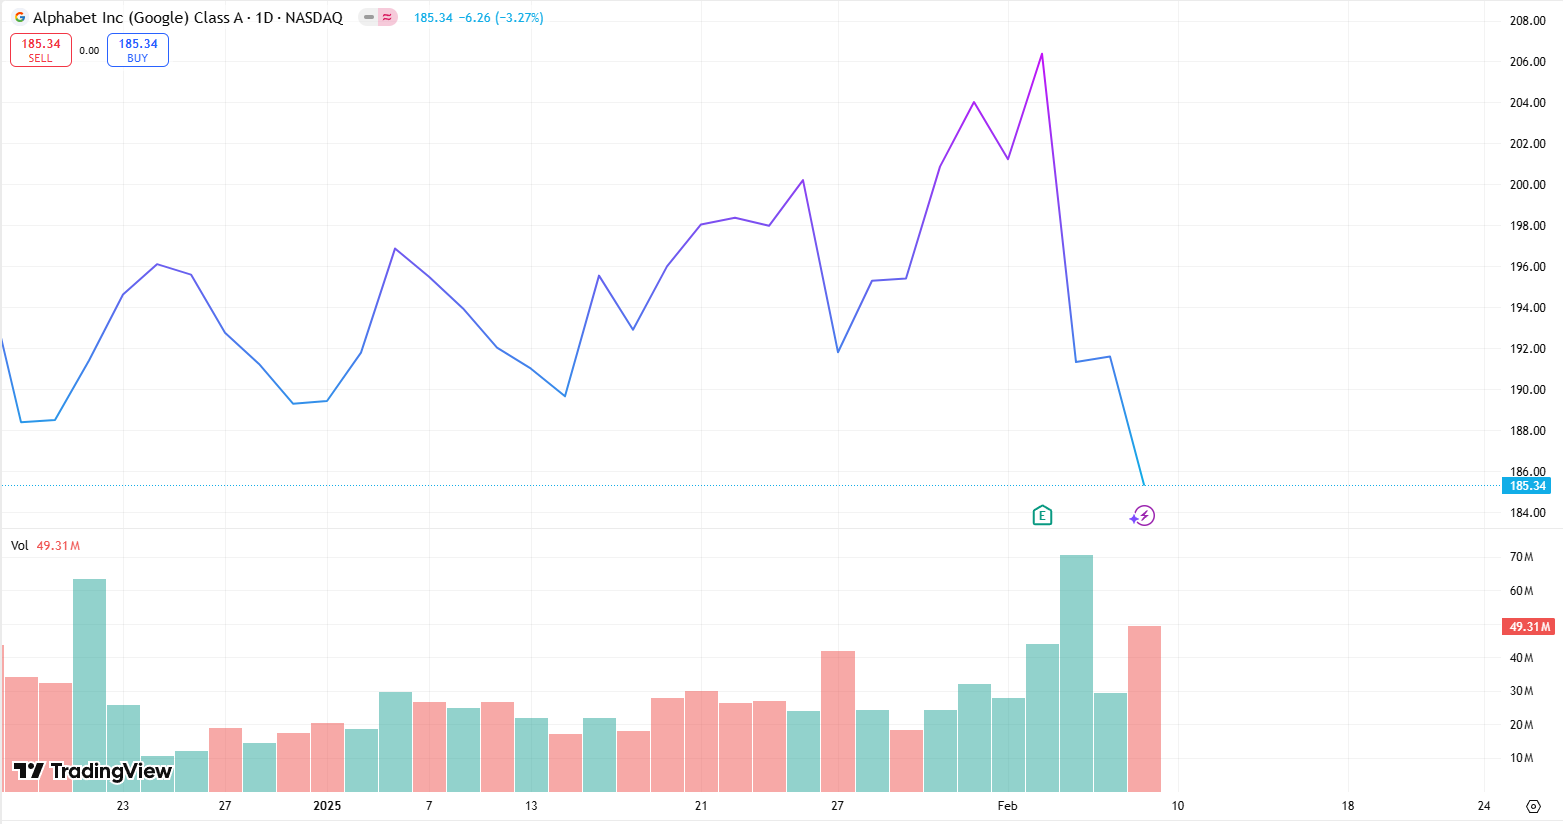
The weakness became particularly apparent last week when both Alphabet and Amazon posted ostensibly solid results. Yet the market's reaction proved brutal: Alphabet shares plunged 9% while Amazon shed 4%. The culprit? Forward guidance and capital expenditure plans that suggested peak margins might be in the rearview mirror. For momentum traders who had grown accustomed to these stocks being a one-way bet, the shift in narrative is forcing a wholesale reassessment of positioning.
Retail Traders: The New Market Force
While institutional investors may be growing cautious, the retail trading community is showing no such restraint. JPMorgan's equity desk reported that retail sentiment hit all-time highs last week, exceeding even the famous meme stock mania of 2021. This exuberance is most visible in names like Palantir Technologies, which saw its dollar trading volume on Friday handily exceed that of Apple – a company with 13 times its market capitalization.
The JPMorgan analysis comes with an important caveat for short-term traders: historically, such extreme readings in retail participation have correlated with positive returns over the subsequent two weeks. However, the signal's predictive value dissipates beyond that timeframe, suggesting tactical traders should remain nimble.

The Tariff Timeline: Understanding the Latest Developments
President Trump's latest salvo in the trade wars has introduced a new level of complexity for market participants. The announcement of impending "reciprocal tariffs" represents a significant escalation from previous measures. Unlike targeted actions against specific countries or sectors, this approach threatens to reshape the entire global trading landscape.
The mechanics of these proposed tariffs are straightforward in theory but complex in execution: if a foreign nation imposes a 100% tariff on American goods, the U.S. would respond with an identical 100% duty on their products. The implications for supply chains, inflation, and corporate margins are profound.

Sector Implications: Winners and Losers
The industrial sector, once a darling of the "Trump trade," has notably underperformed the broader market as tariff concerns mount. The Russell 2000 small-cap index has retreated to mid-October levels, suggesting traders are reducing exposure to companies with primarily domestic revenue streams – a striking reversal from the conventional wisdom that small-caps offer a haven during trade disputes.
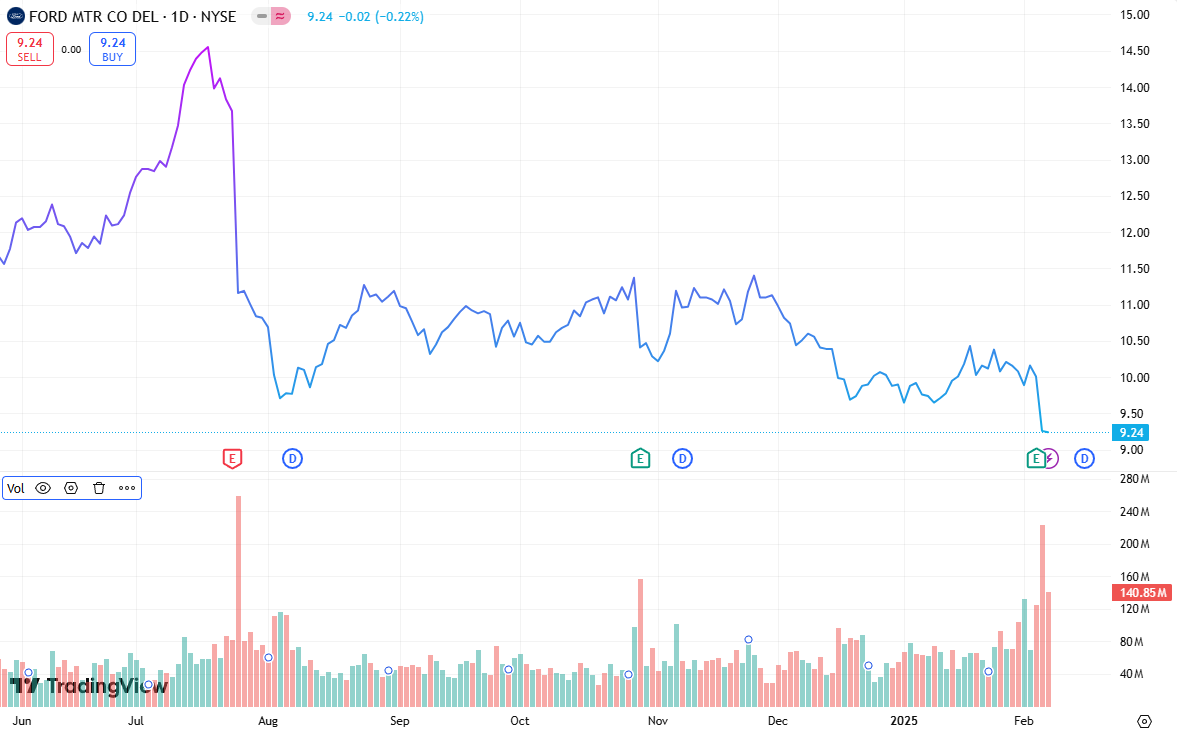
The automotive sector faces particular scrutiny. European automakers like Stellantis and Volkswagen saw their shares drop more than 7% on initial tariff headlines before recovering on news of potential negotiations. Ford's CEO has publicly acknowledged that while the company could weather brief tariff disruptions, sustained 25% duties on Mexican and Canadian imports would "wipe out billions in industry profits."
Global Currency Markets: The First Line of Response
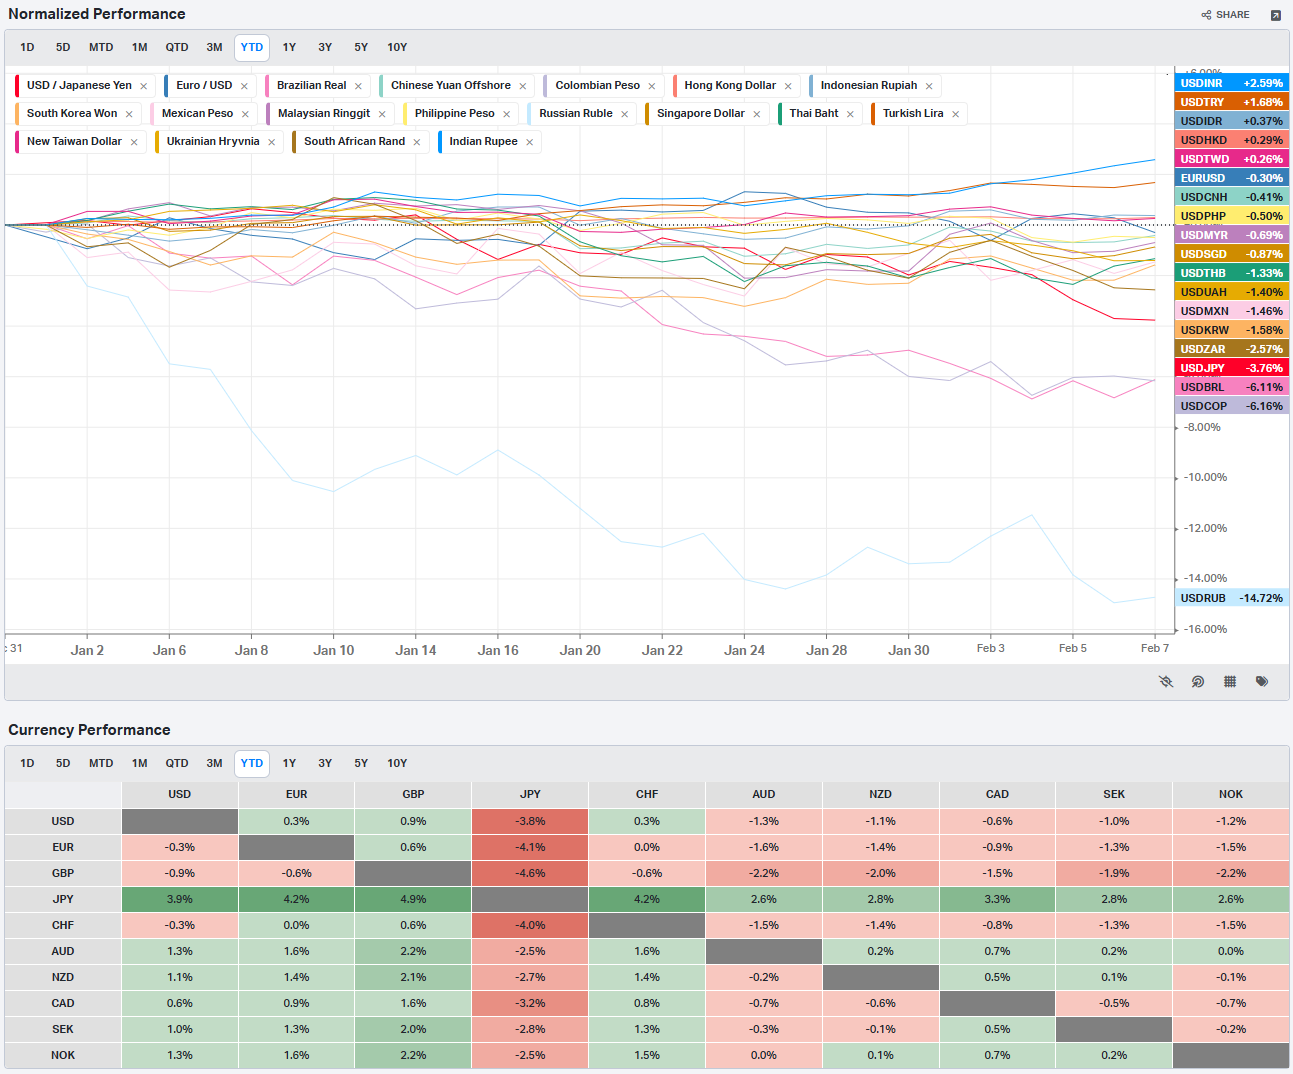
Currency traders have been quick to price in the tariff threats, with notable volatility in the Canadian dollar and Mexican peso. The loonie briefly touched 20-year lows before rebounding on news of a temporary tariff delay, while the peso has swung between gains of 3.5% and losses of 2.2% year-to-date.

The euro hasn't escaped unscathed either, sliding 5% since the U.S. election and briefly touching $1.0125 – levels not seen since late 2022. Nearly one-third of currency strategists now project the euro could reach parity with the dollar within a year, citing the combination of trade uncertainty and divergent monetary policy expectations.

The China Factor: A Calculated Response
While much attention focuses on North American and European trading partners, China's response to the tariff threats has been notably measured. The yuan remains slightly stronger than its pre-Trump administration levels, while both mainland and Hong Kong equity indices have posted gains.
Bank of Singapore's chief economist Mansoor Mohi-uddin suggests this restraint may be strategic. China's initial retaliatory tariffs affected just $14 billion in U.S. exports, potentially leaving room for negotiation. Moreover, Beijing has resisted the temptation to weaken its currency significantly, prioritizing financial stability and relationships with other trading partners over short-term export advantages.
Economic Implications: Threading the Needle
The timing of these tariff threats adds another layer of complexity to the Federal Reserve's decision-making process. Friday's jobs report showed nonfarm payrolls increasing by 143,000 in January, with upward revisions to previous months painting a picture of a moderating but still healthy labor market. However, the 0.5% increase in hourly wages, combined with elevated inflation expectations in the University of Michigan consumer survey, suggests price pressures remain stubborn.
Economists at the Peterson Institute for International Economics estimate that the proposed tariffs on China, Mexico, and Canada alone could drive inflation higher by 0.6% in the near term while creating a 0.2% drag on real GDP growth. This stagflationary combination complicates the Fed's ability to deliver the rate cuts markets have been eagerly anticipating.

Trading Strategies: Navigating Uncertain Waters
For active investors, the current environment demands a more nuanced approach than the "buy-the-dip" mentality that dominated recent years. Several strategies warrant consideration:
Quality Over Momentum: With market breadth deteriorating, emphasis should shift toward companies with strong balance sheets and pricing power rather than those merely benefiting from momentum flows.
Options Protection: The CBOE Volatility Index (VIX) testing its floor near 15 provides relatively inexpensive opportunities to add portfolio protection through put options.
Sector Rotation: The market's clockwork rotations suggest opportunities for tactical traders willing to monitor relative strength carefully and adjust positions accordingly.
Currency Hedging: For investors with significant international exposure, the elevated volatility in currency markets may justify the cost of hedging positions, particularly in Canadian and Mexican assets.
Legal and Political Considerations
While the president has broad authority to negotiate changes in U.S. trade policy, legal experts note that sweeping tariff changes may face challenges. Previous tariff actions have been justified under national security provisions, particularly citing the fentanyl crisis for measures against Mexico, China, and Canada. Extending this argument to a broader set of trading partners may prove more difficult.
International trade lawyer Laura Siegel Rabinowitz of Greenberg Traurig expects legal challenges to emerge, particularly regarding WTO compliance. While she believes the targeted measures against China, Canada, and Mexico may withstand scrutiny due to the national emergency argument, broader reciprocal tariffs could face stronger headwinds.
Looking Ahead: Key Signposts for Investors
Markets will be closely monitoring several developments in the coming weeks:
The specific details of the reciprocal tariff program, expected to be announced next week
Potential negotiations with the European Union, particularly regarding auto tariffs
The Federal Reserve's response to potentially higher inflation readings
Corporate guidance during the remainder of earnings season, especially regarding margin pressures
Technical levels around S&P 500 6,100, which has emerged as significant resistance
Conclusion: Maintaining Perspective
While the market's resilience in the face of mounting uncertainties is impressive, investors would be wise to remember that periods of low volatility often precede significant moves. The combination of aggressive retail positioning, deteriorating market breadth, and potential policy shocks suggests heightened risk of market discontinuities.
For long-term investors, however, it's worth noting that previous rounds of tariff threats have ultimately led to negotiations rather than sustained trade wars. The key will be maintaining discipline during periods of elevated volatility while remaining alert for opportunities that arise from any market dislocations.
As we navigate these challenges, the words of veteran traders ring true: the market can remain irrational longer than you can stay solvent. In the current environment, preparation, agility and vigilance remain the watchwords for successful investment strategies.

US Investor Sentiment
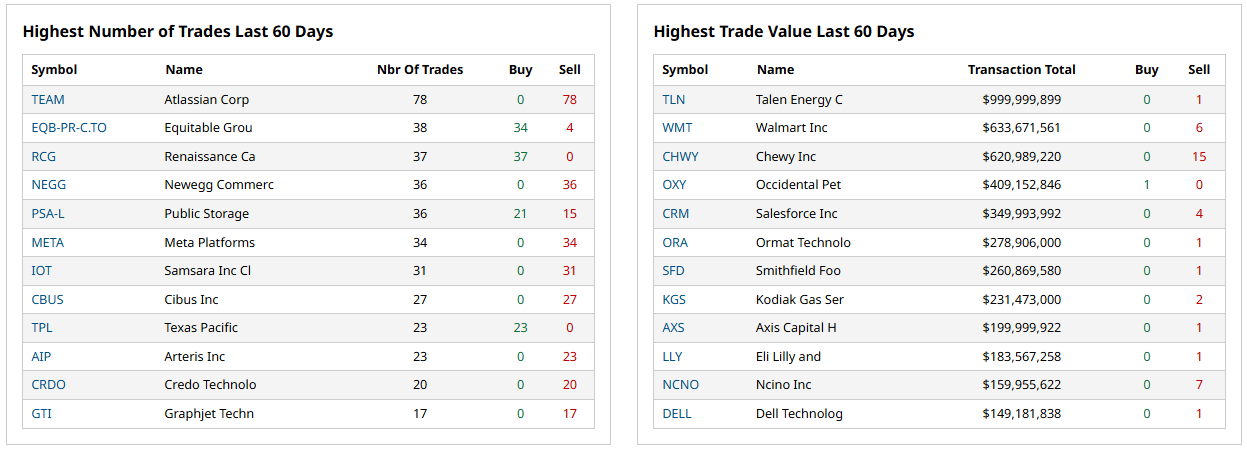
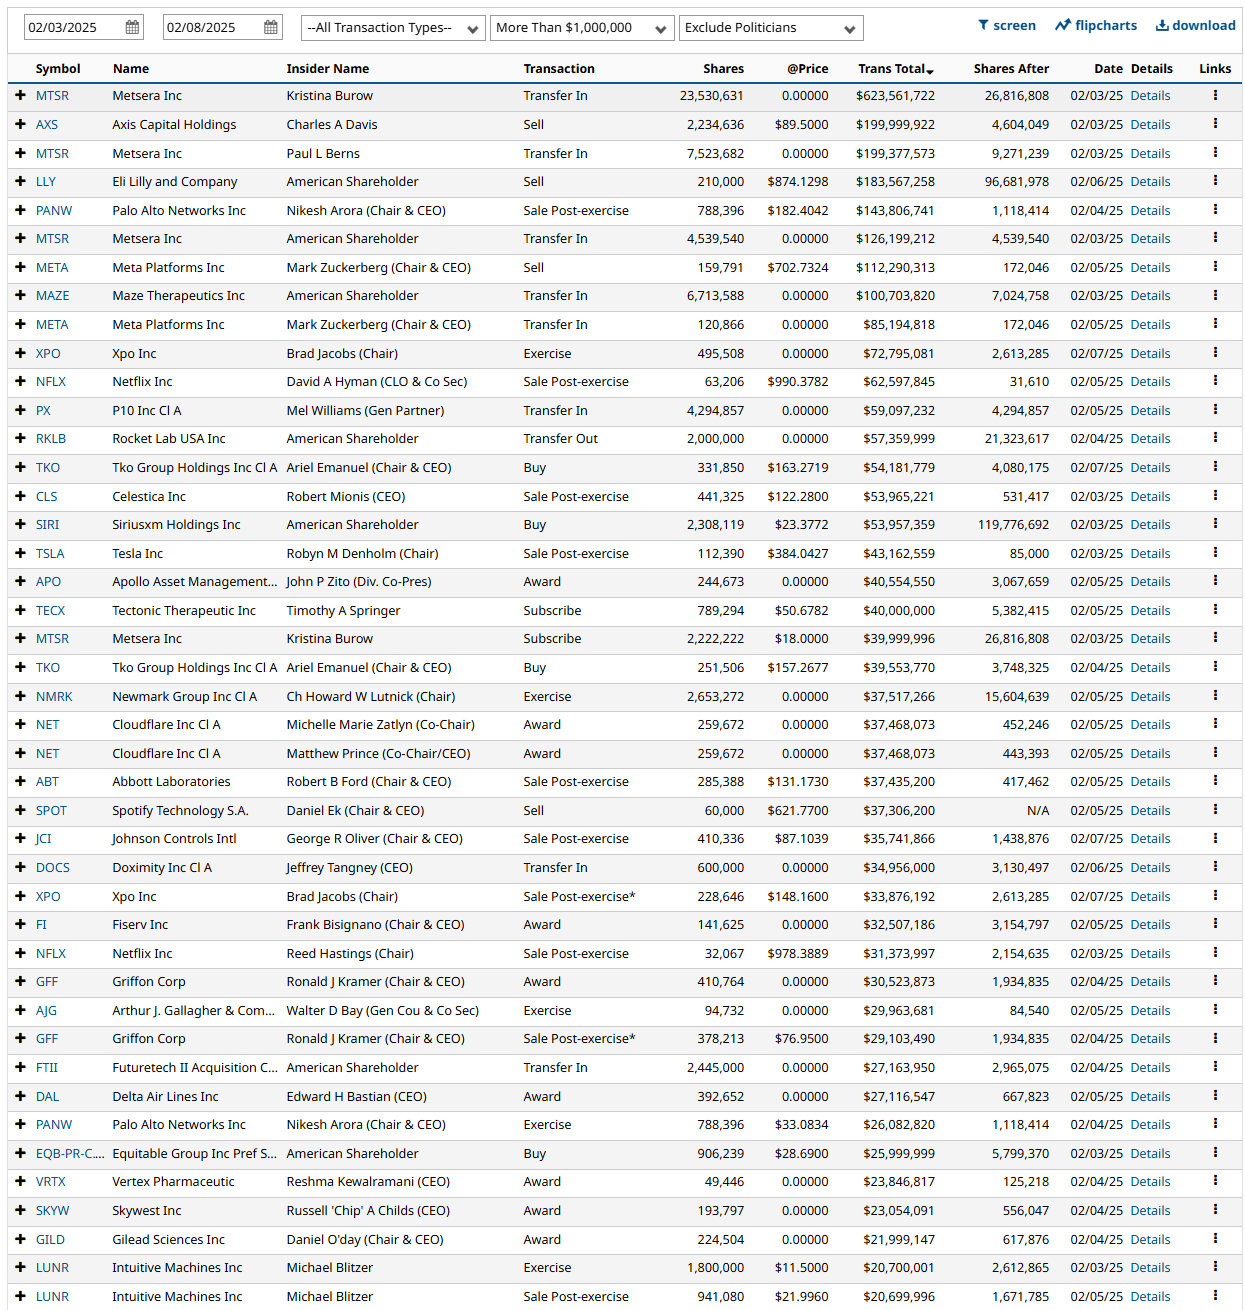
Insider Trading
Insider trading occurs when a company’s leaders or major shareholders trade stock based on non-public information. Tracking these trades can reveal insider expectations about the company’s future. For example, large purchases before an earnings report or drug trial results might indicate confidence in upcoming good news.
%Bull-Bear Spread
The %Bull-Bear Spread chart is a sentiment indicator that shows the difference between the percentage of bullish and bearish investors, often derived from surveys or sentiment data, such as the AAII (American Association of Individual Investors) sentiment survey. This spread tells investors about the prevailing mood in the market and can provide insights into market extremes and potential turning points.
Bullish or Bearish Sentiment:
When the spread is positive, it means more investors are bullish than bearish, indicating optimism about the market’s direction.
A negative spread indicates more bearish sentiment, meaning more investors expect the market to decline.
Contrarian Indicator:
The %Bull-Bear Spread is often used as a contrarian indicator. For example, extremely high levels of bullish sentiment might suggest that the market is overly optimistic and could be due for a correction.
Similarly, when bearish sentiment is extremely high, it might indicate that the market is overly pessimistic, and a rally could be on the horizon.
Market Extremes and Reversals:
Historically, extreme values of the spread (both positive and negative) can signal turning points in the market. A very high positive spread can signal market exuberance, while a very low or negative spread may indicate fear or capitulation.

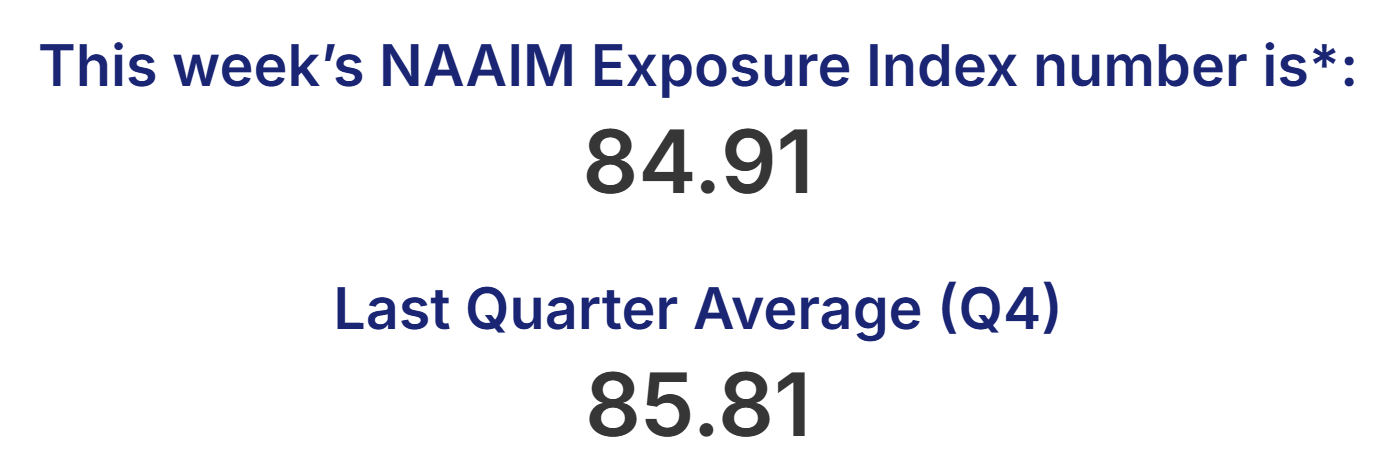
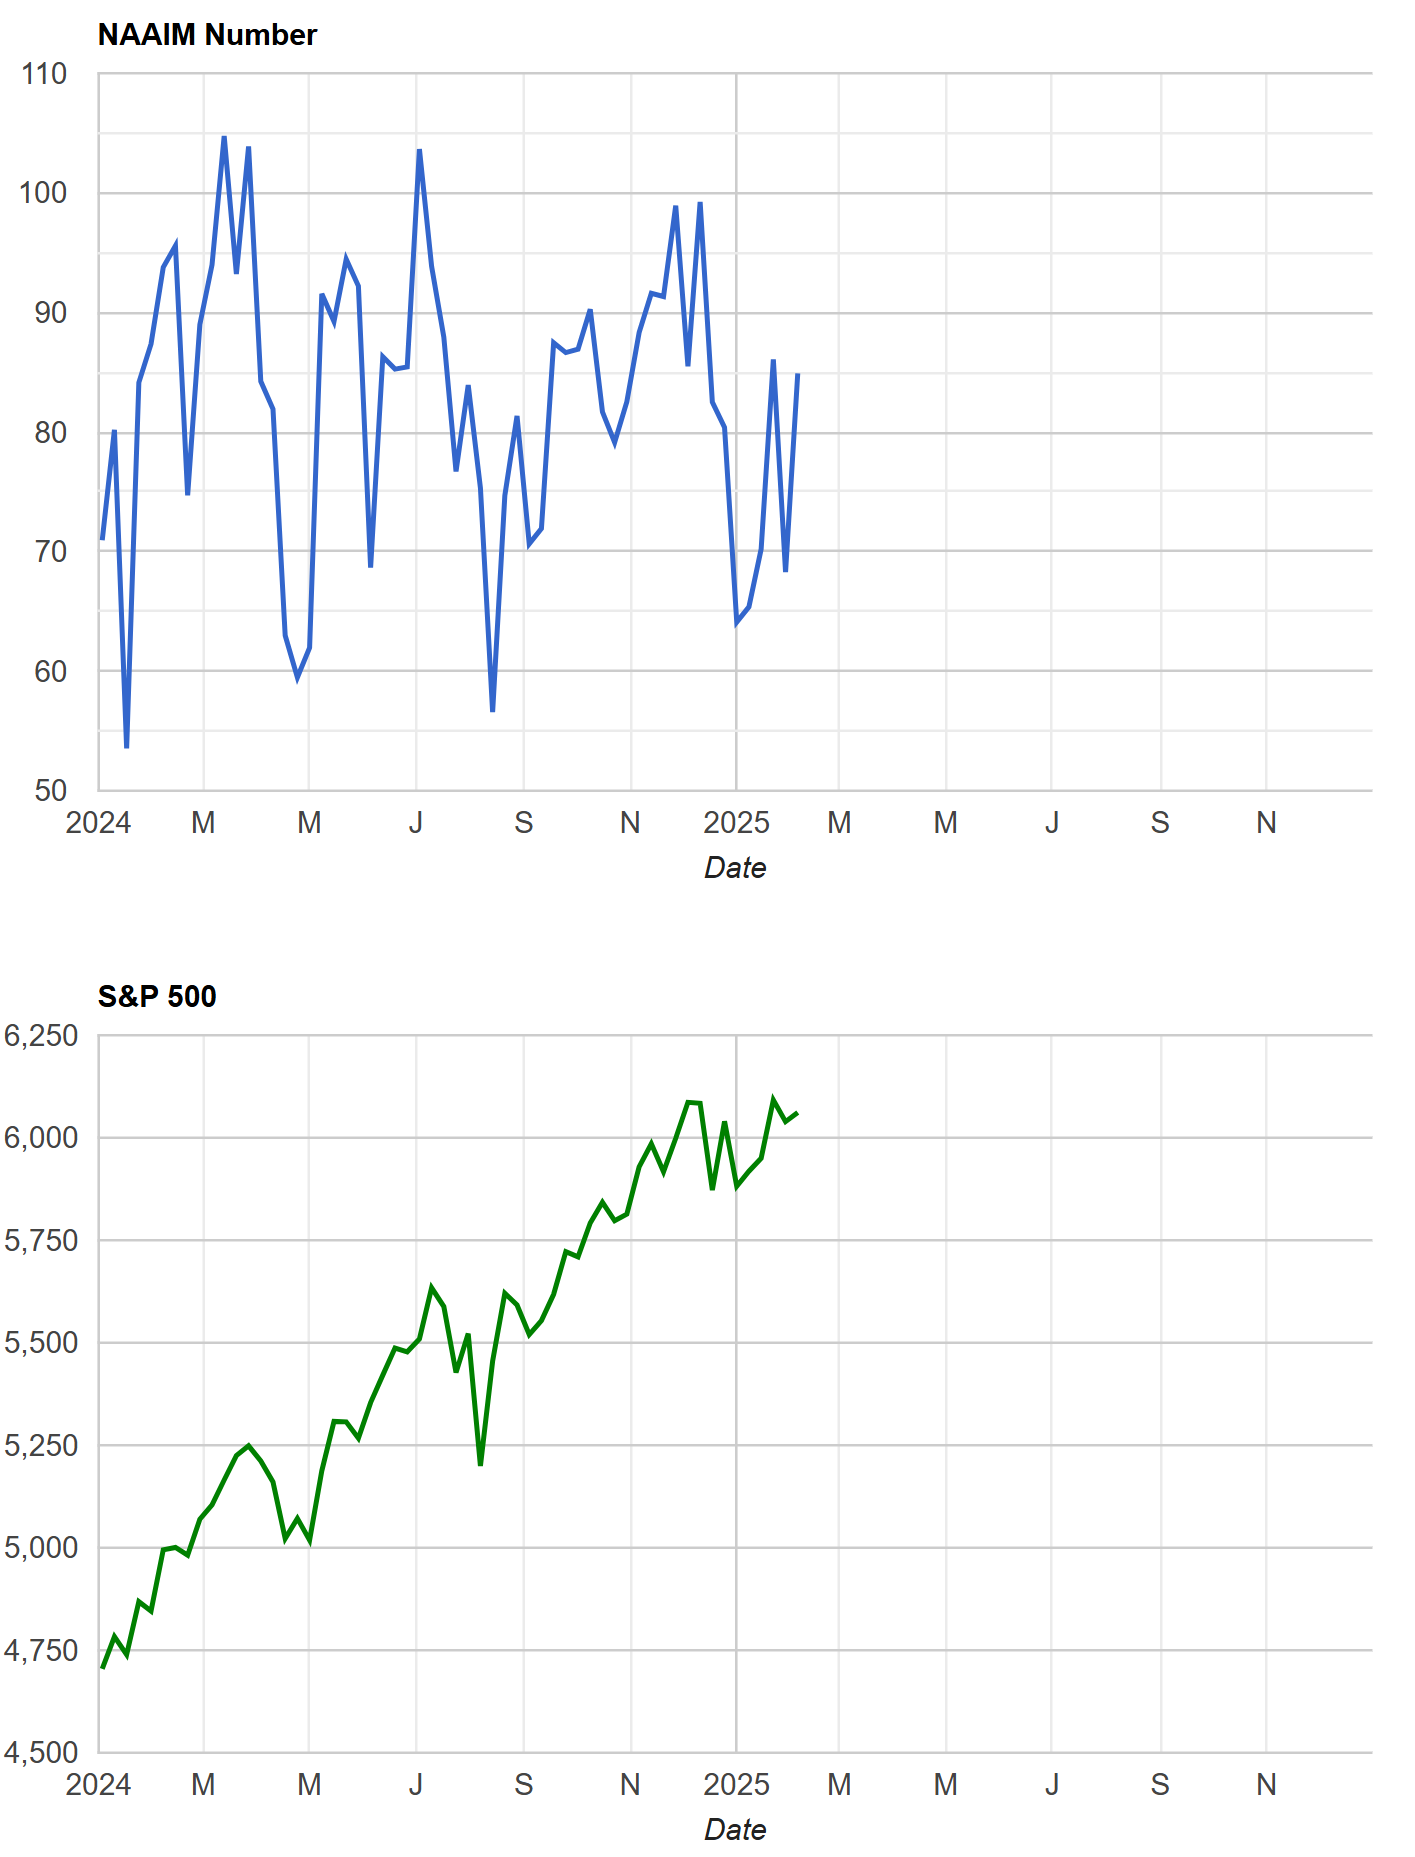
NAAIM Exposure Index
The NAAIM Exposure Index (National Association of Active Investment Managers Exposure Index) measures the average exposure to U.S. equity markets as reported by its member firms. These are typically active money managers who provide their equity exposure levels weekly. The index offers insight into how much these managers are investing in equities at any given time, ranging from being fully short (-100%) to leveraged long (up to +200%).

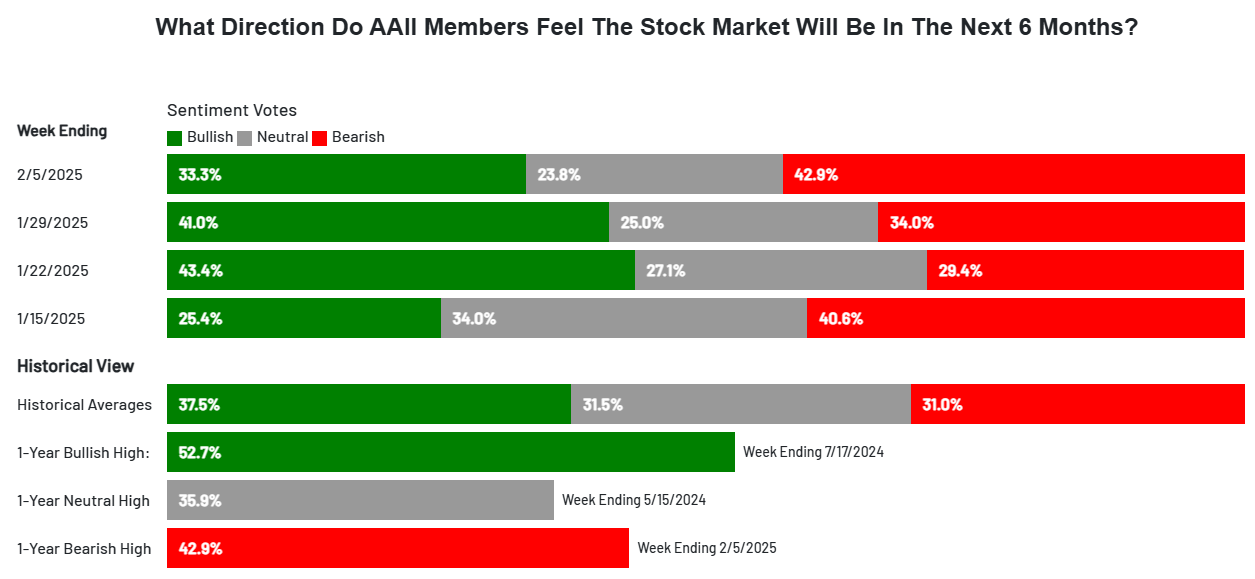
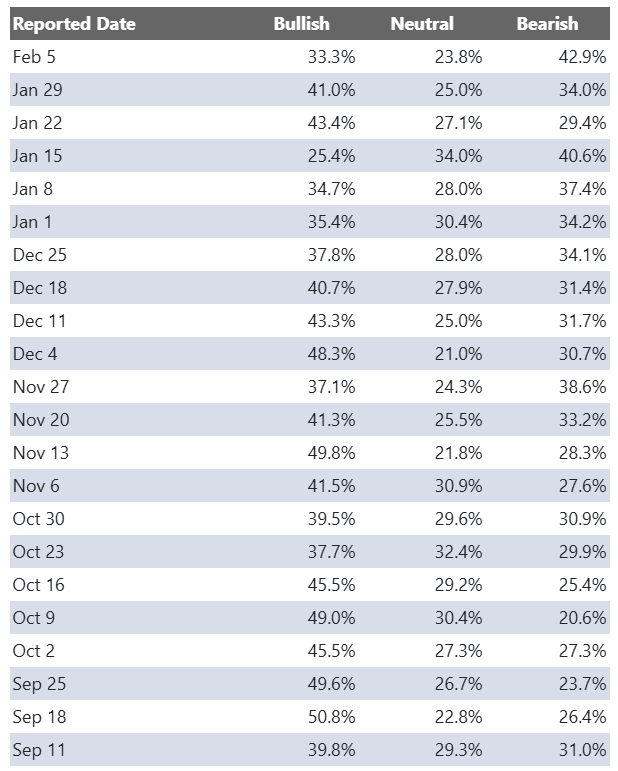
AAII Investor Sentiment Survey
The AAII Investor Sentiment Survey is a weekly survey conducted by the American Association of Individual Investors (AAII) to gauge the mood of individual investors regarding the direction of the stock market over the next six months. It provides insights into whether investors are feeling bullish (expecting the market to rise), bearish (expecting the market to fall), or neutral (expecting the market to stay about the same).
Key Points:
Bullish Sentiment: Reflects the percentage of investors who believe the stock market will rise in the next six months.
Bearish Sentiment: Represents those who expect a decline.
Neutral Sentiment: Reflects investors who anticipate little to no market movement.
The survey is widely followed as a contrarian indicator, meaning that extreme levels of bullishness or bearishness can sometimes signal market turning points. For example, when a large number of investors are overly optimistic (high bullish sentiment), it could suggest a market top, while excessive pessimism (high bearish sentiment) may indicate a market bottom is near.
SPX Put/Call Ratio
The SPX Put/Call Ratio is an indicator that is used to gauge market sentiment. This is calculated as the ratio between trading S&P 500 put options and S&P call options. A high put/call ratio can indicate fear in the markets, while a low ratio indicates confidence. For example, in 2015, the Put-Call ratio was as high as 3.77 because of market fears stemming from various global economic issues like a GDP growth slowdown in China and a Greek debt default.
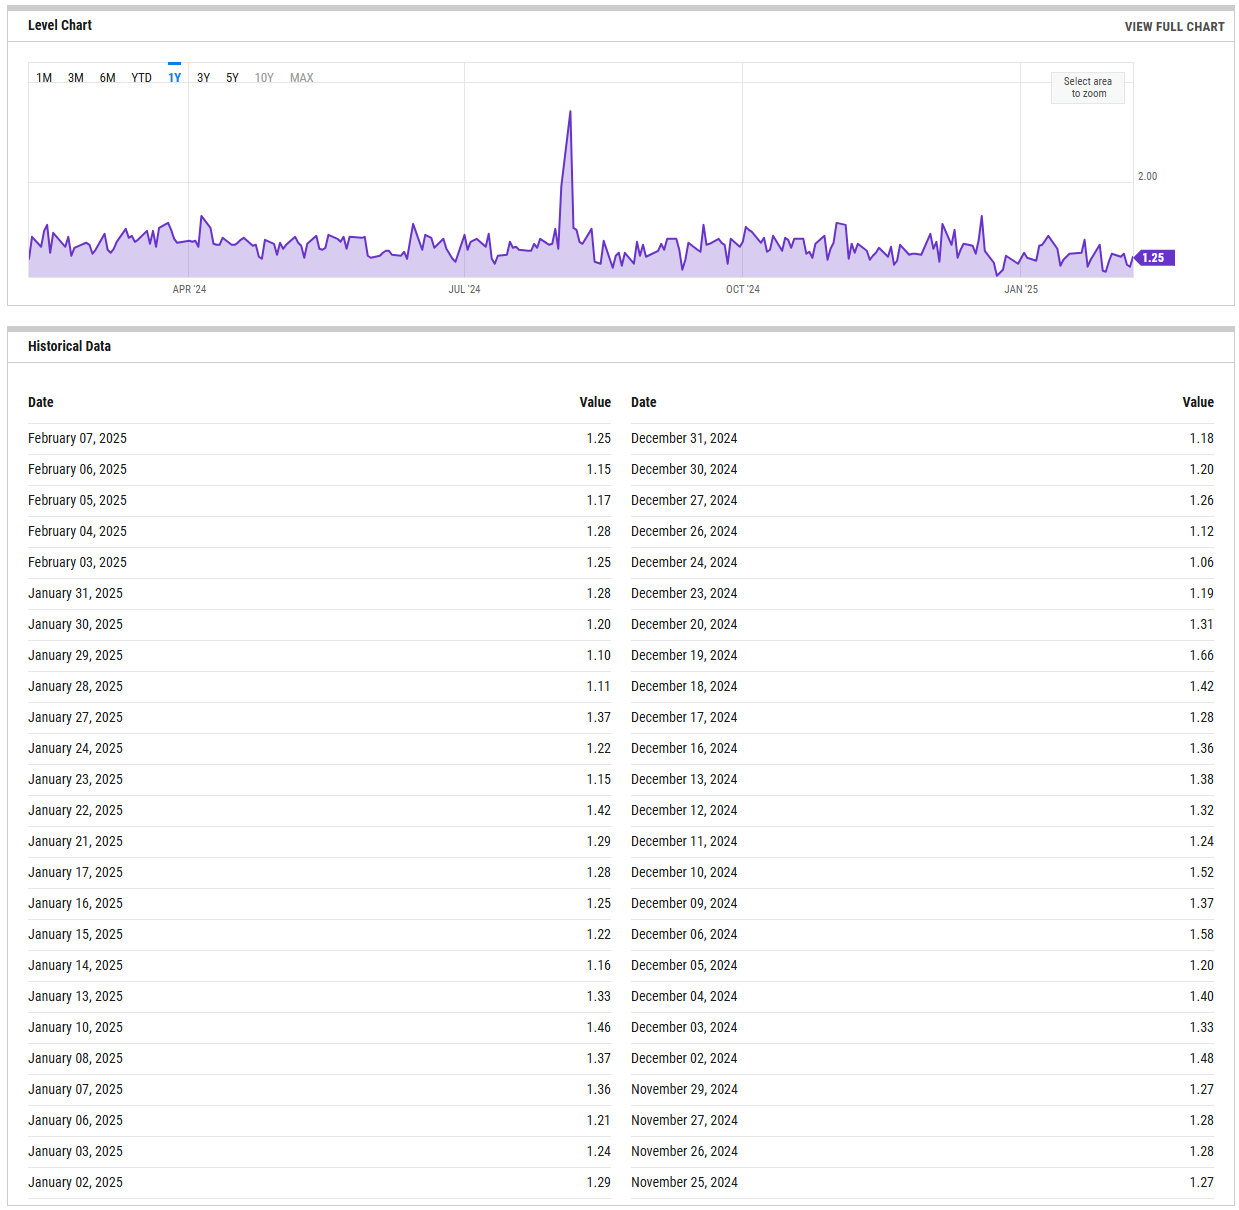
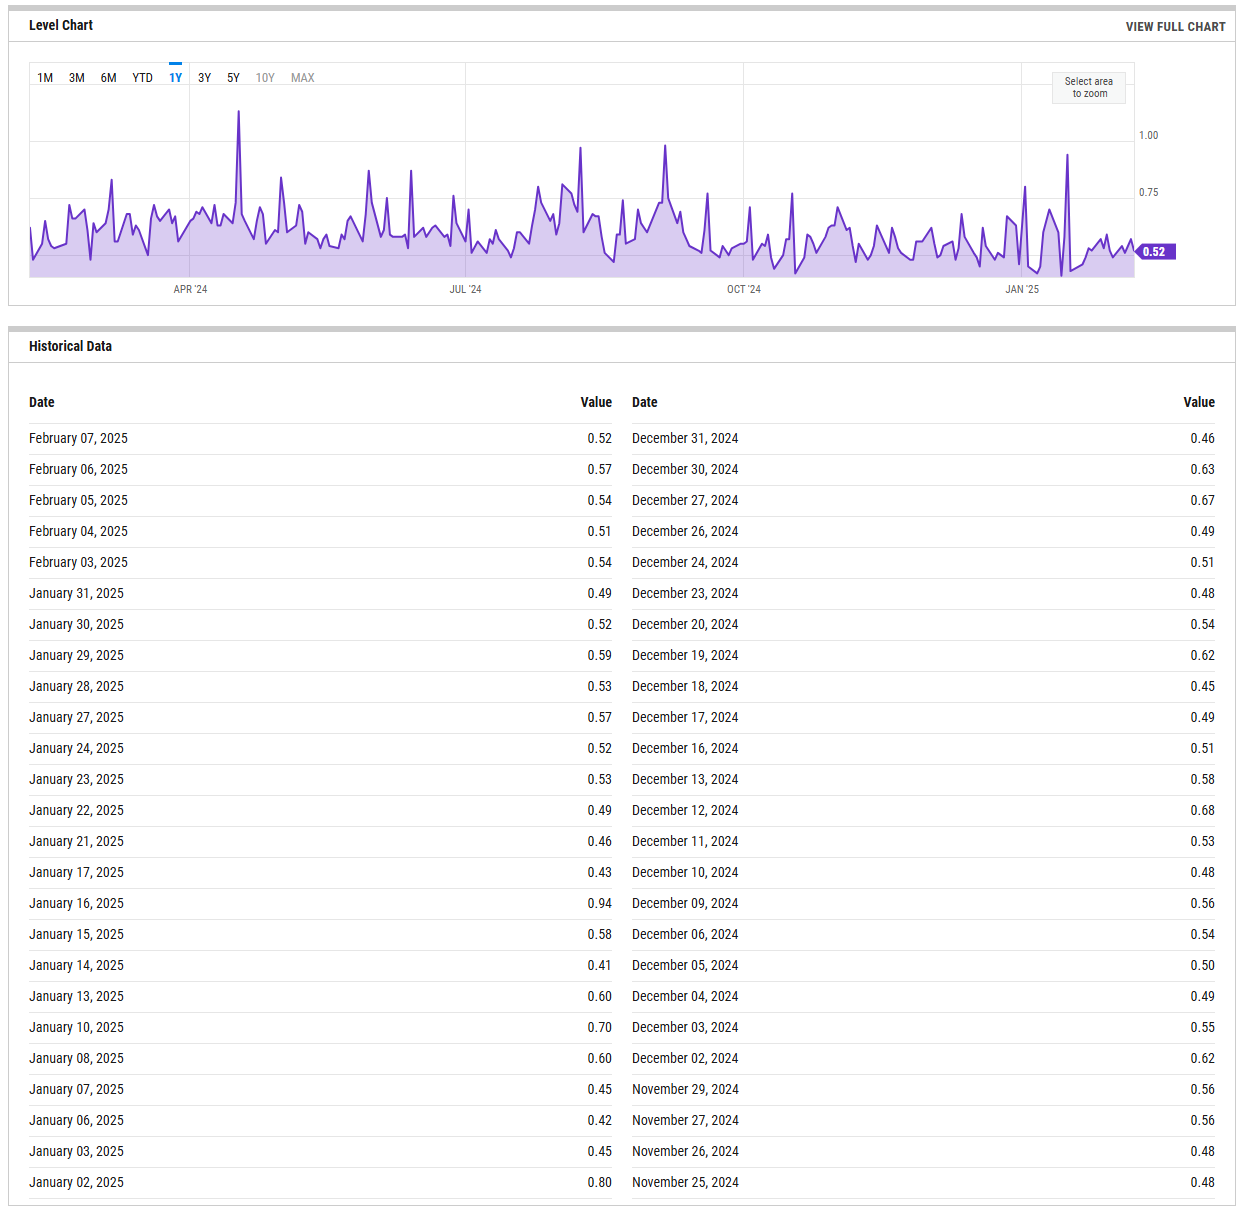
CBOE Equity Put/Call Ratio
The CBOE (Chicago Board Options Exchange) equity put/call ratio is a sentiment indicator used by traders and analysts to gauge market sentiment and potential shifts in investor behavior. It is calculated by dividing the volume of put options by the volume of call options on equities. Here’s what it reveals and how it is generally interpreted:
High Put/Call Ratio: When the put/call ratio is high (above 1.0), it suggests that there is more demand for put options than call options. This typically reflects a more bearish sentiment, as investors may be hedging against potential declines or expecting the market to fall.
Low Put/Call Ratio: Conversely, a low put/call ratio (below 0.7) indicates a higher volume of call options compared to puts, reflecting bullish sentiment. Investors may be expecting upward momentum and are positioning themselves to profit from price gains
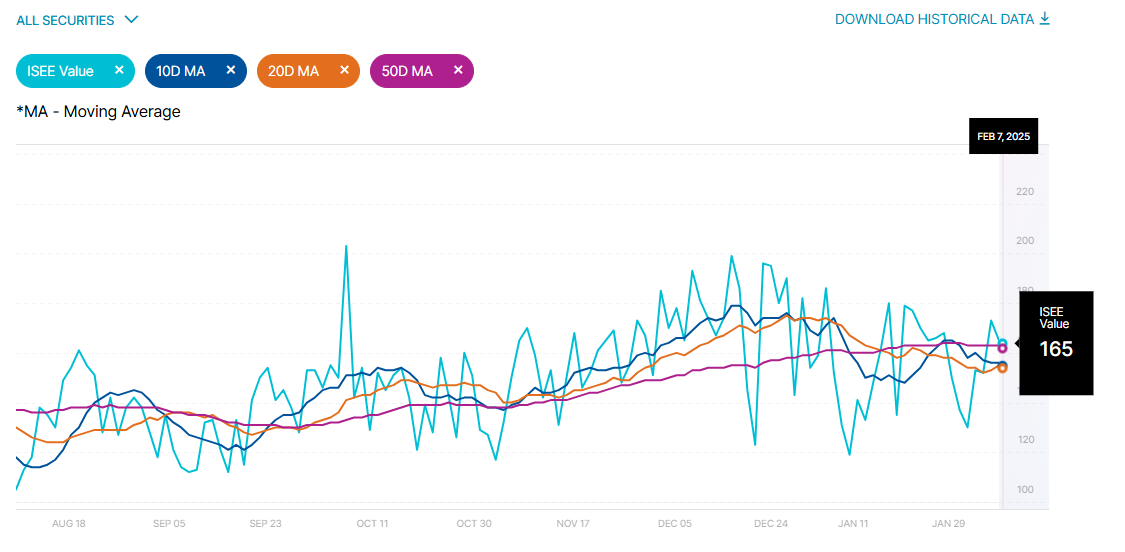
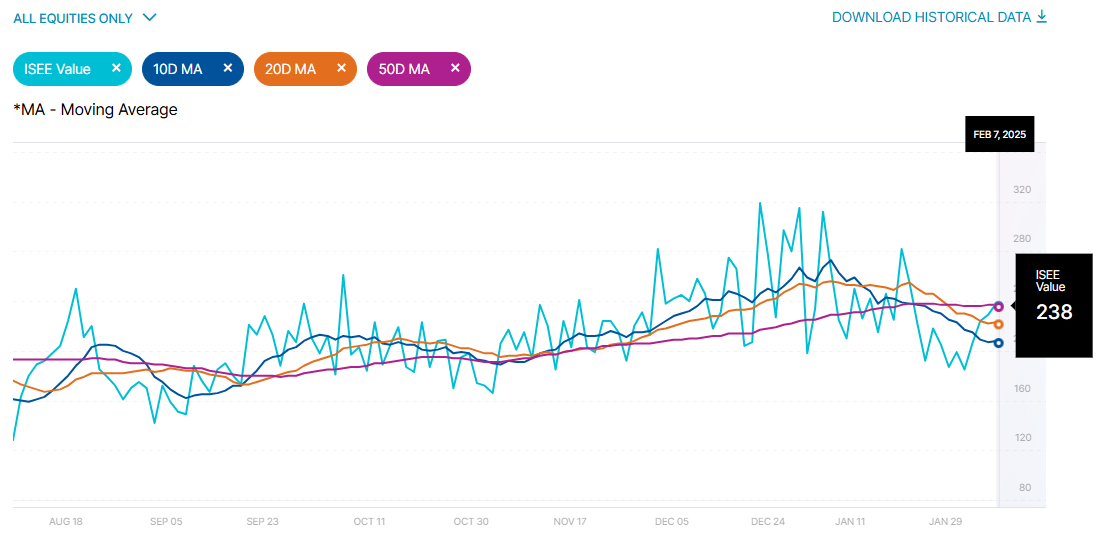
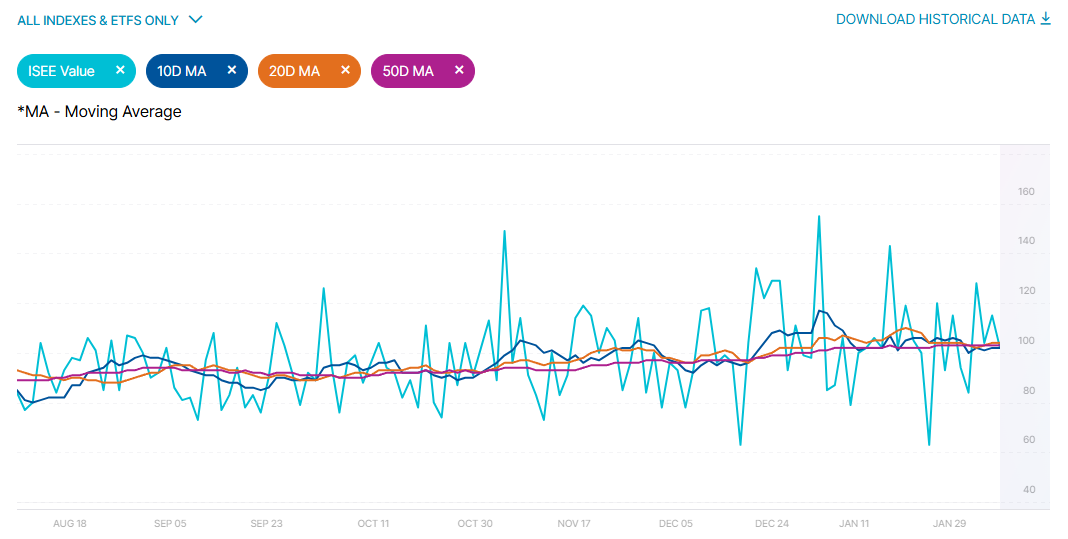
ISEE Sentiment Index
The ISEE (International Securities Exchange Sentiment) Index is a measure of investor sentiment derived from options trading. Unlike traditional put/call ratios, the ISEE Index focuses only on opening long customer transactions and is adjusted to remove market-maker and firm trades, providing a purer sentiment reading.
The ISEE Index typically ranges from 0 to 200, with readings above 100 indicating more call options being bought relative to put options, suggesting bullish sentiment. Conversely, readings below 100 suggest bearish sentiment, with more puts being purchased relative to calls.
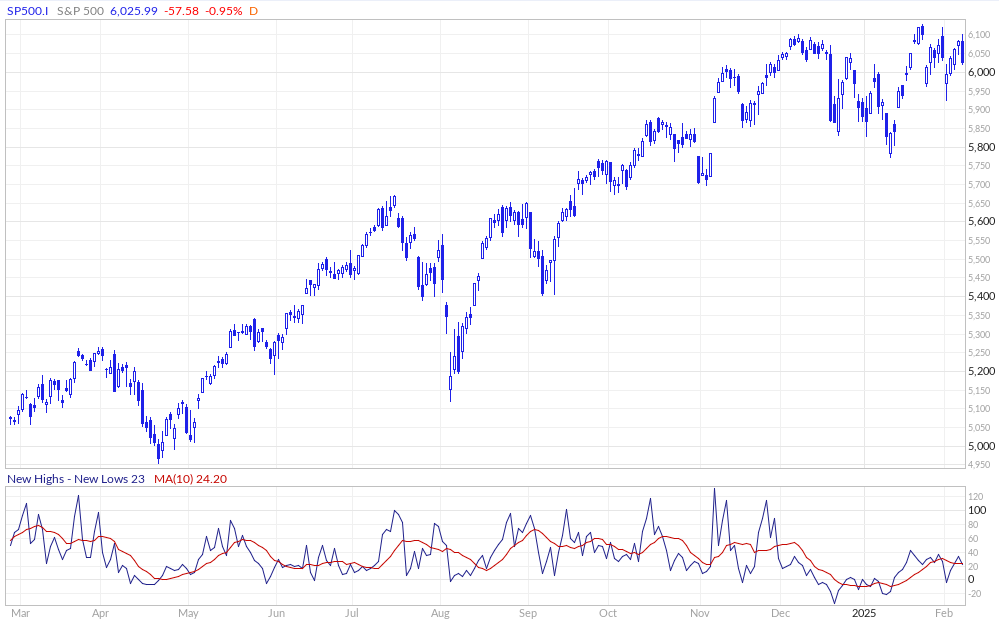
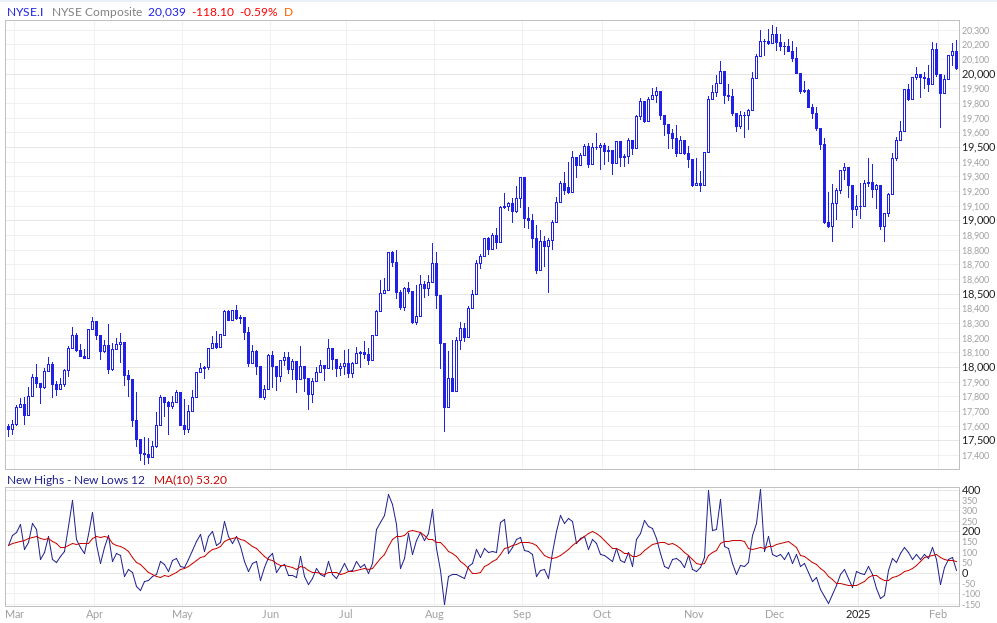
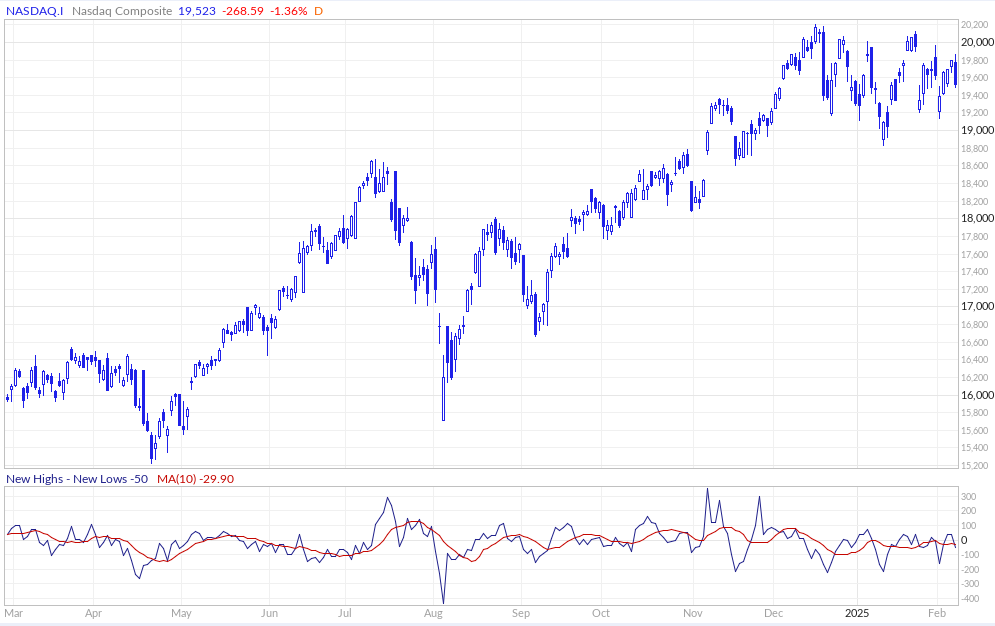
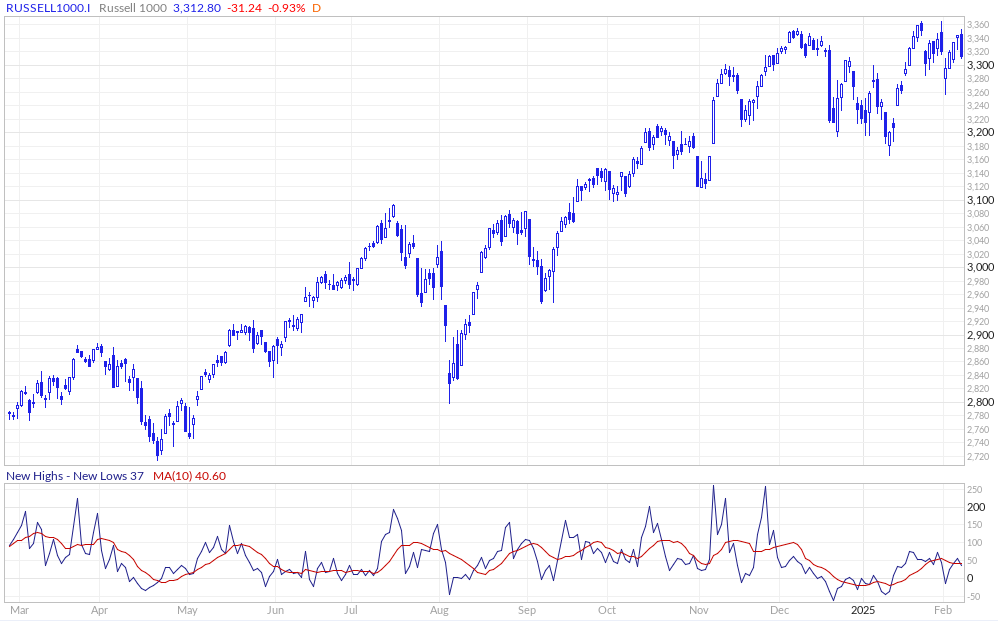
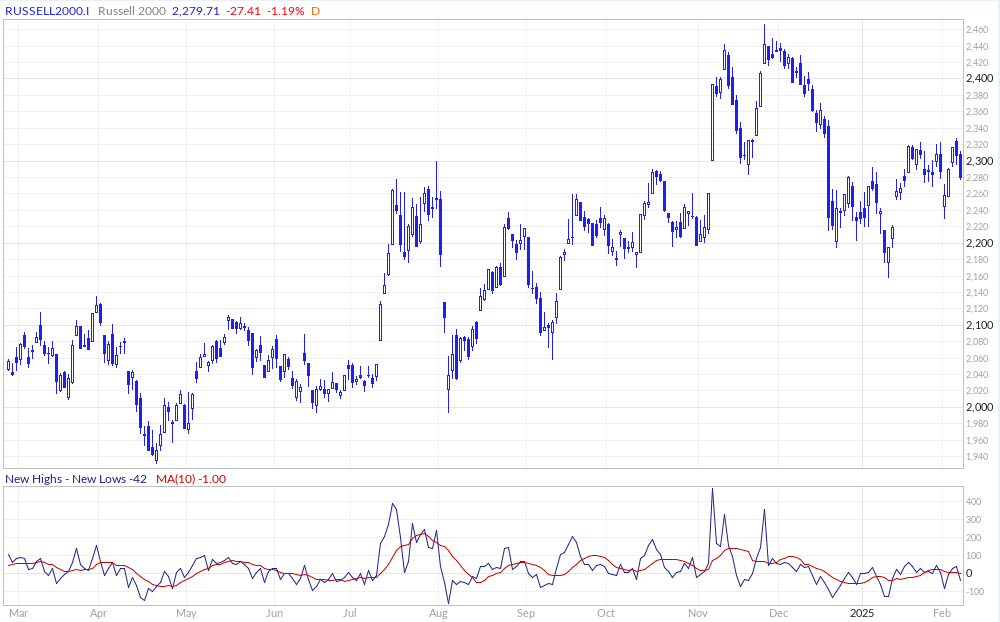
New Highs - New Lows
The New Highs - New Lows indicator (NH-NL) displays the daily difference between the number of stocks reaching new 52-week highs and the number of stocks reaching new 52-week lows. The NH-NL indicator generally reaches its extreme lows slightly before a major market bottom. As the market then turns up from the major bottom, the indicator jumps up rapidly. During this period, many new stocks are making new highs because it's easy to make a new high when prices have been depressed for a long time. The NH-NL indicator oscillates around zero. If the indicator is positive, the bulls are in control. If it is negative, the bears are in control. As the cycle matures, a divergence often occurs as fewer and fewer stocks are making new highs (the indicator falls), yet the market indices continue to reach new highs. This is a classic bearish divergence that indicates that the current upward trend is weak and may reverse.
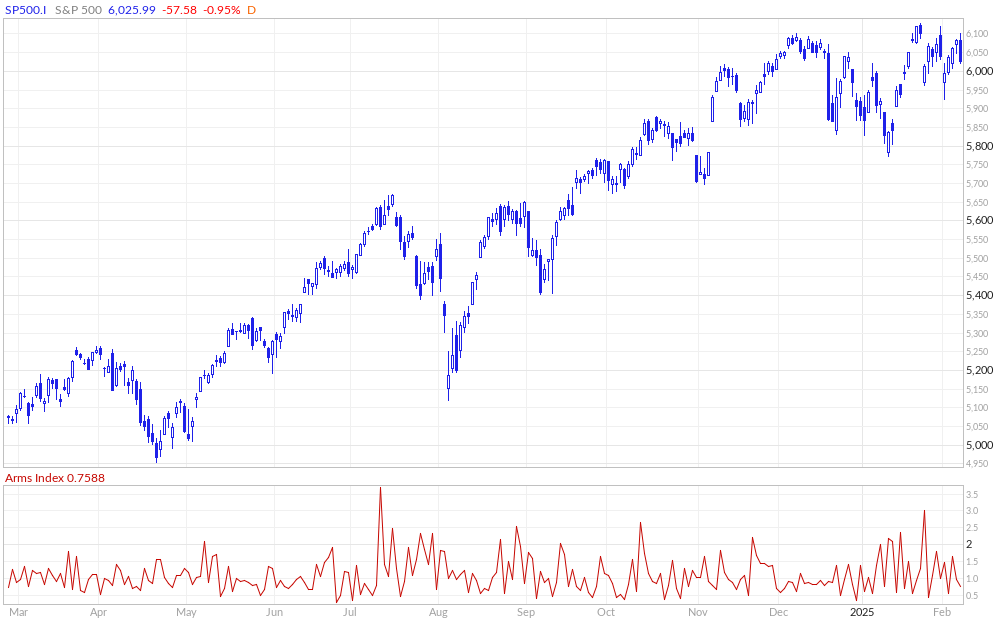
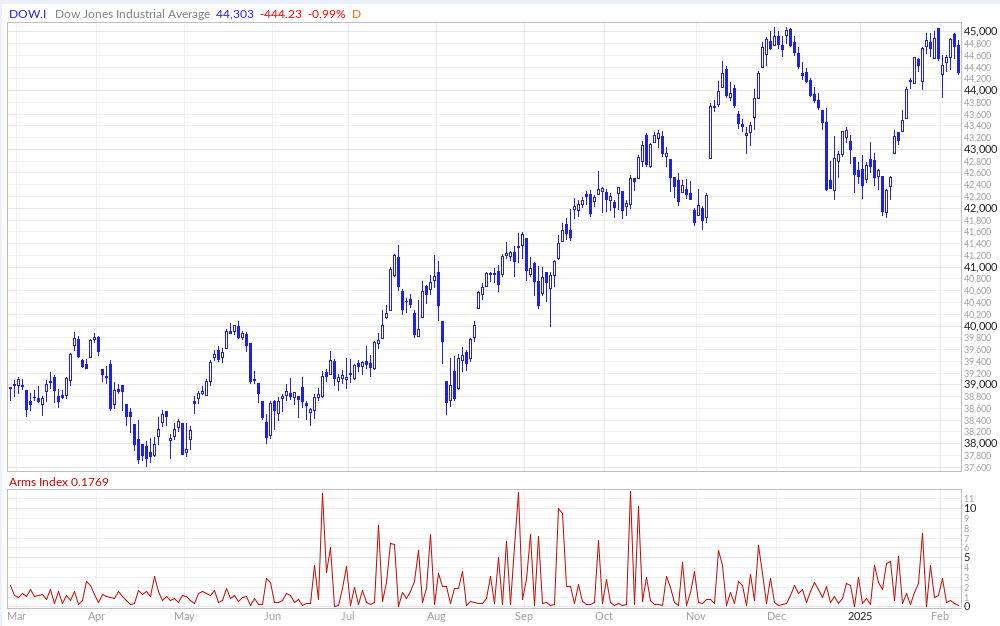
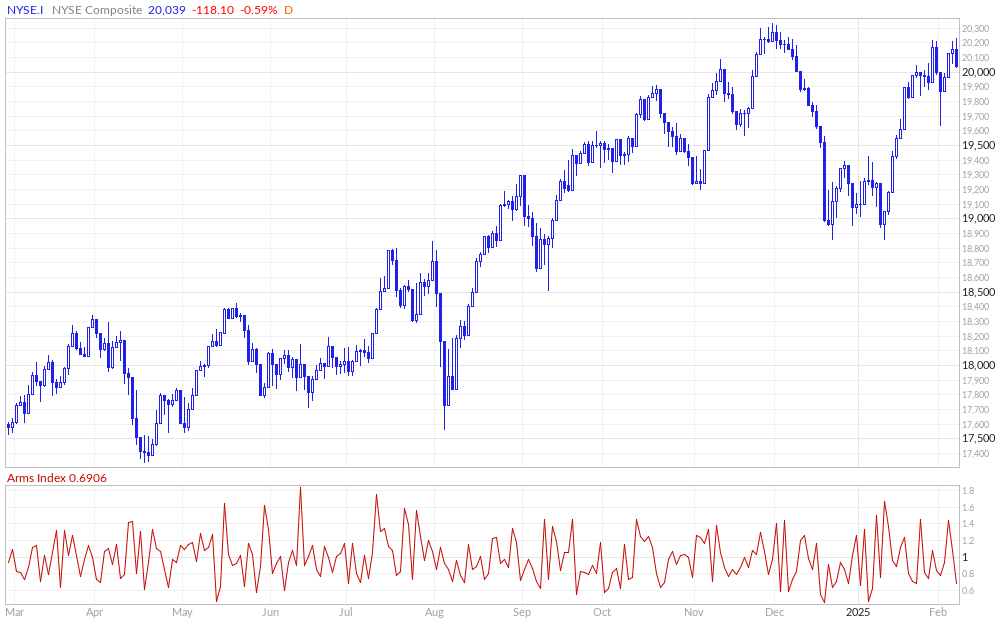
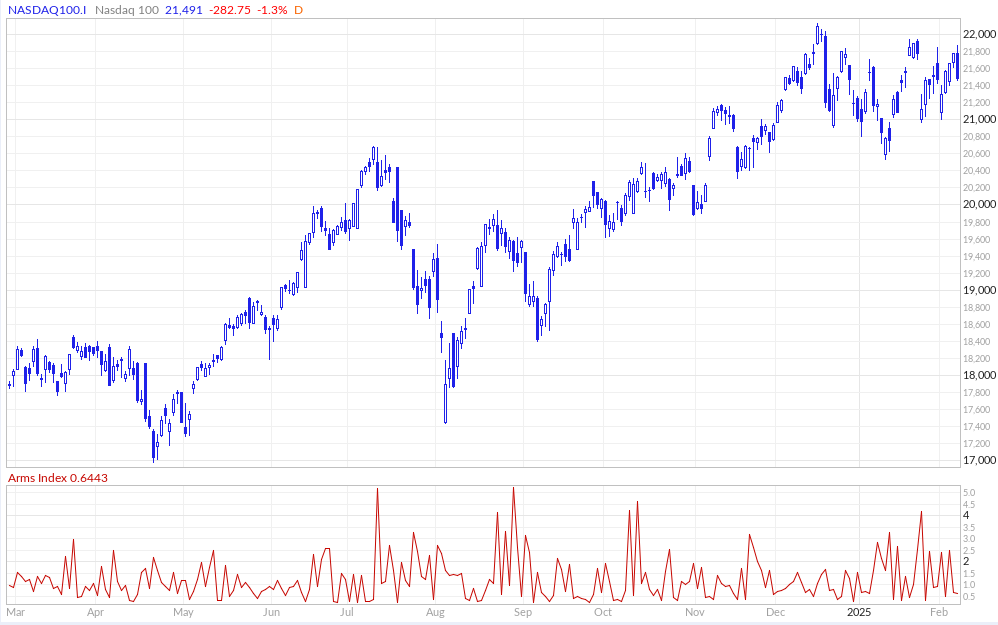
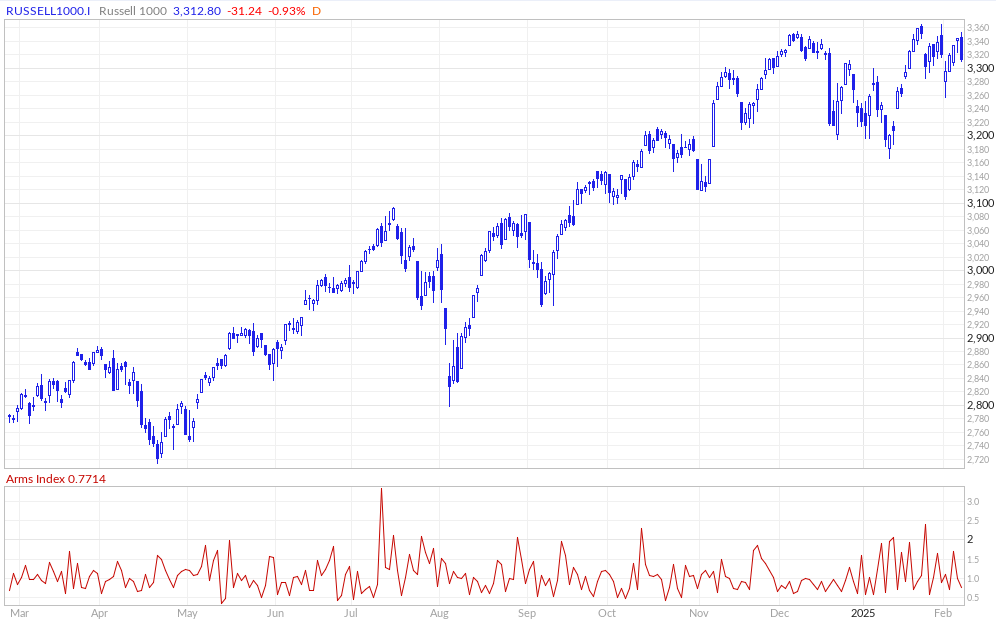
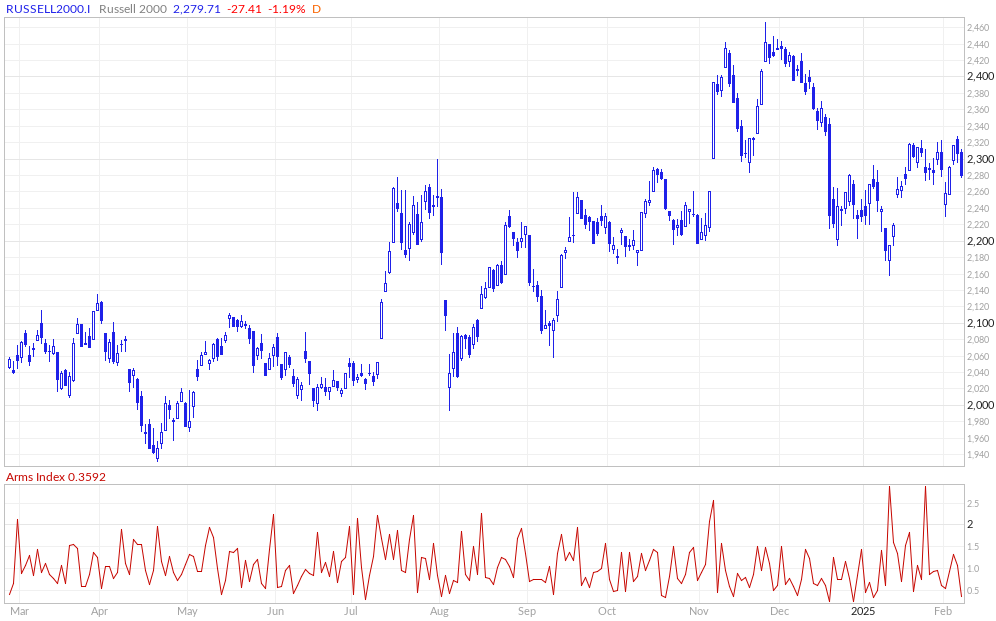
ARMS Index
The Arms Index, also known as the TRIN (Short-Term TRading INdex), was developed by Richard Arms in the 1960s. It is calculated by dividing the ratio of advancing stocks to declining stocks by the ratio of advancing volume to declining volume. Interpreting the Arms Index involves looking at its value in relation to certain thresholds. A value below "1" is considered bullish, indicating that advancing stocks and volume dominate the market. Conversely, a value above "1" is considered bearish, suggesting that declining stocks and volume are more prevalent. Extremely low values (below 0.5) or high values (above 2) are often seen as potential reversal signals.

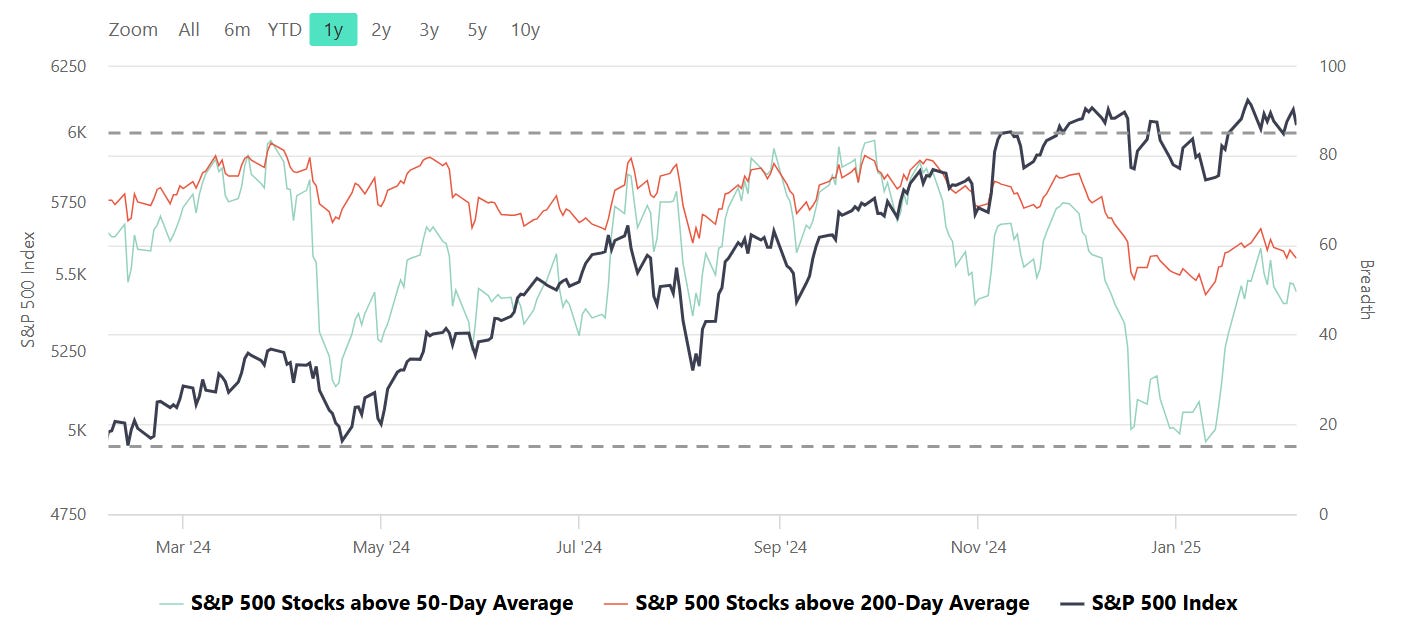
S&P Breadth
Breadth, in the context of stock market analysis, refers to the measure of how many stocks in a given index (such as the S&P 500) are participating in a trend, such as advancing or declining relative to a certain moving average (e.g., 50-day or 200-day).
Market Strength Assessment:
Breadth provides insight into whether a market rally or decline is broad-based or driven by only a few large-cap stocks. A rally supported by a high percentage of stocks above their 50-day or 200-day averages is generally considered healthier and more sustainable.
Early Warning Signals:
Divergences between breadth indicators and the index price can signal potential reversals. For example:
If the index is rising, but the number of stocks above their moving averages is declining, it may indicate weakening underlying strength and potential for a pullback.
Conversely, if breadth improves while the index remains flat or declines, it may suggest accumulating strength for a future rally.
Trend Confirmation:
Breadth indicators can confirm trends. For instance, a strong majority of stocks above their moving averages signals robust market momentum, providing confidence in the prevailing trend.
Identifying Overbought or Oversold Conditions:
Extremely high or low breadth readings can signal overbought or oversold conditions, which might lead to mean reversion. For example:
If nearly all stocks are above their 50-day or 200-day averages, it may suggest overbought conditions.
Conversely, extremely low levels indicate oversold conditions and potential for a bounce.
Breadth and Timing Investments:
Entry Points:
When breadth improves (e.g., more stocks move above their 50-day or 200-day moving averages) after a market pullback, it can indicate a good time to start building positions as the broader market is regaining strength.
Exit Points:
Breadth deterioration during a rally may suggest it’s time to reduce exposure, especially if only a small number of stocks are driving index gains. This is often a warning sign of an impending correction.
Volatility and Risk Management:
Weak breadth in volatile markets may prompt caution or defensive positioning. Conversely, improving breadth can justify taking on more risk during uptrends.
CME Fedwatch
What is the likelihood that the Fed will change the Federal target rate at upcoming FOMC meetings, according to interest rate traders? Use CME FedWatch to track the probabilities of changes to the Fed rate, as implied by 30-Day Fed Funds futures prices.

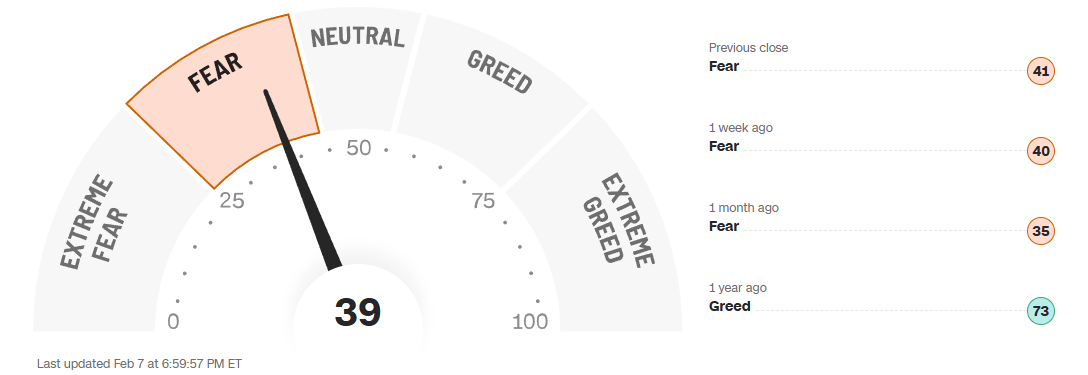
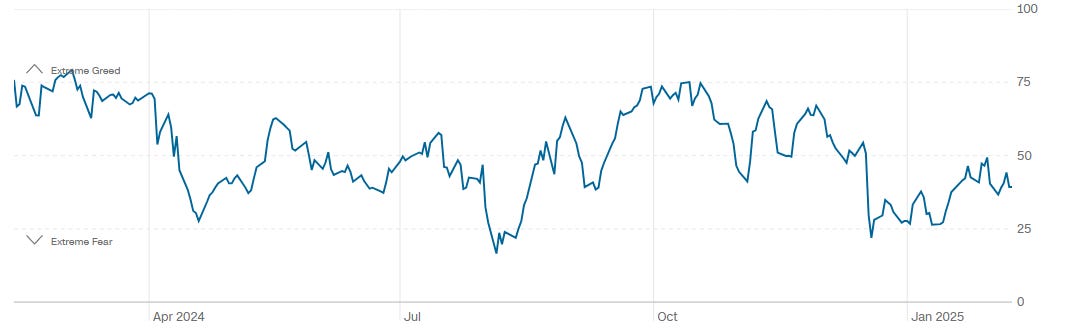
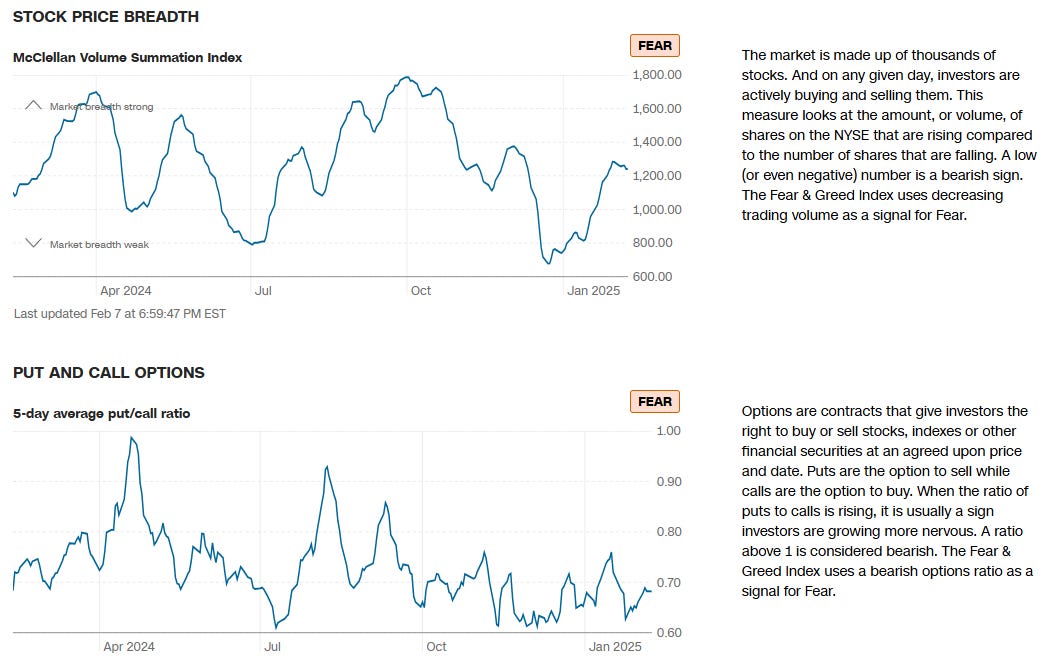
CNN Fear & Greed Constituent Data Points & Composite Index

Institutional S/R Levels for Major Indices
When you’re a large institutional player, your primary goal is to find liquidity - places to do a ton of business with the least amount of slippage possible. VolumeLeaders.com automatically identifies and visually plots the exact spots where institutions are doing business and where they are likely to return for more. It’s one of the primary reasons “support” and “resistance” concepts work and truly one of the reasons “price has memory”.
Levels from the VolumeLeaders.com platform can help you formulate trades theses about:
Where to add or take profit
Where to de-risk or hedge
What strikes to target for options
Where to expect support or resistance
And this is just a small sample; there are countless ways to leverage this information into trades that express your views on the market. The platform covers thousands of tickers on multiple timeframes to accommodate all types of traders. Observe for yourself how accurate the levels are by marking-up your charts with the information in the “Trade Levels” boxes and play-along in real-time this week.
SPY -0.06%↓
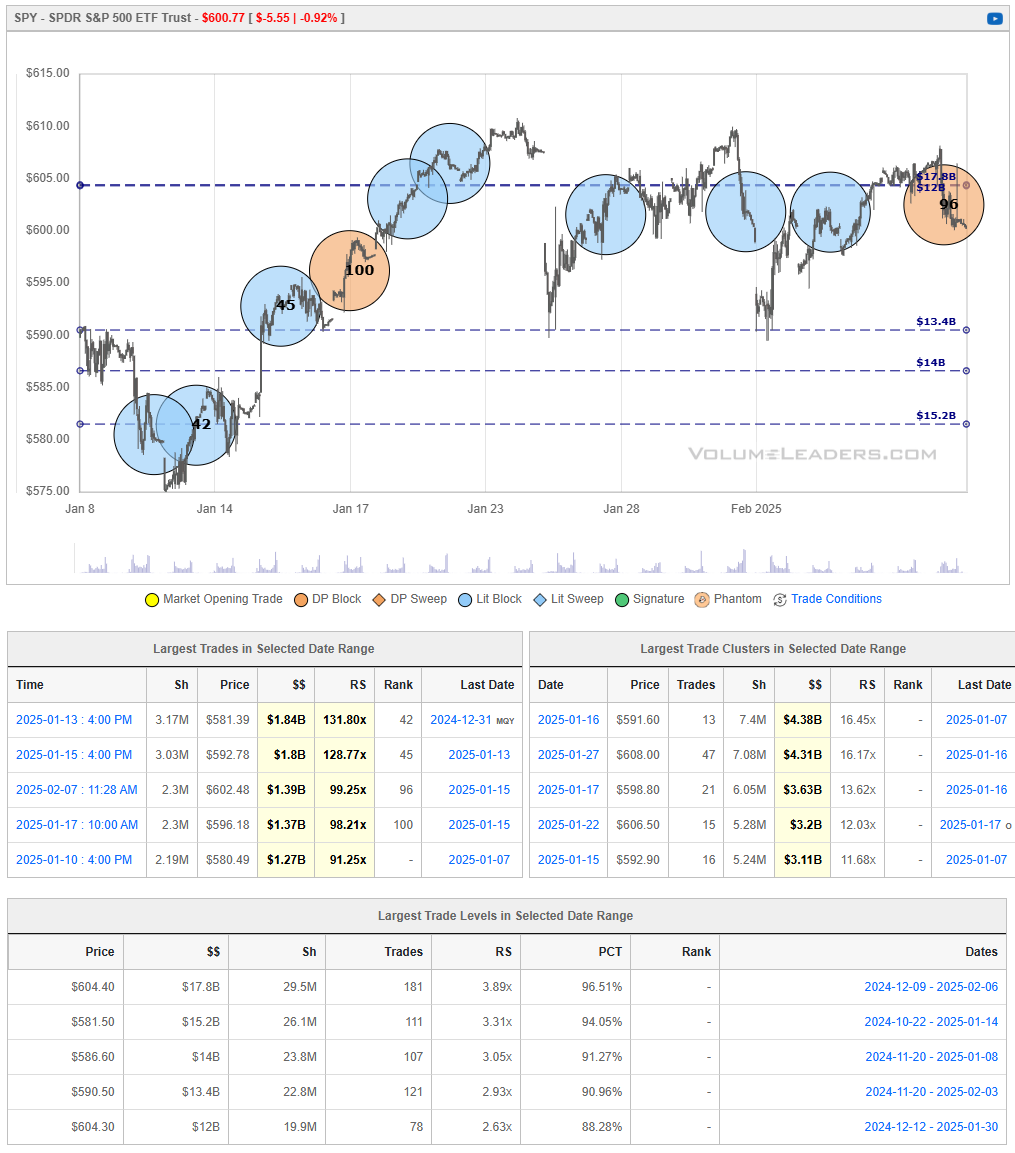
SPY’s rally off the early‐January lows near $580 topped out around $610, where heavy institutional supply has repeatedly turned the ETF back. Over the past couple of weeks, price has been oscillating in a relatively narrow range between roughly $595 and $610, suggesting a market in consolidation mode.
If buyers can muster enough momentum to push SPY firmly above $610, it would confirm absorption of overhead supply and open the door for a run at higher prices in search of new sellers. Conversely, a decisive break back below $595 would indicate sellers remain in control, raising the possibility of a deeper pullback toward prior support zones in the low‐to‐mid $580s. As long as SPY remains pinned between these two bands, choppy rangebound action may persist.
QQQ -0.03%↓
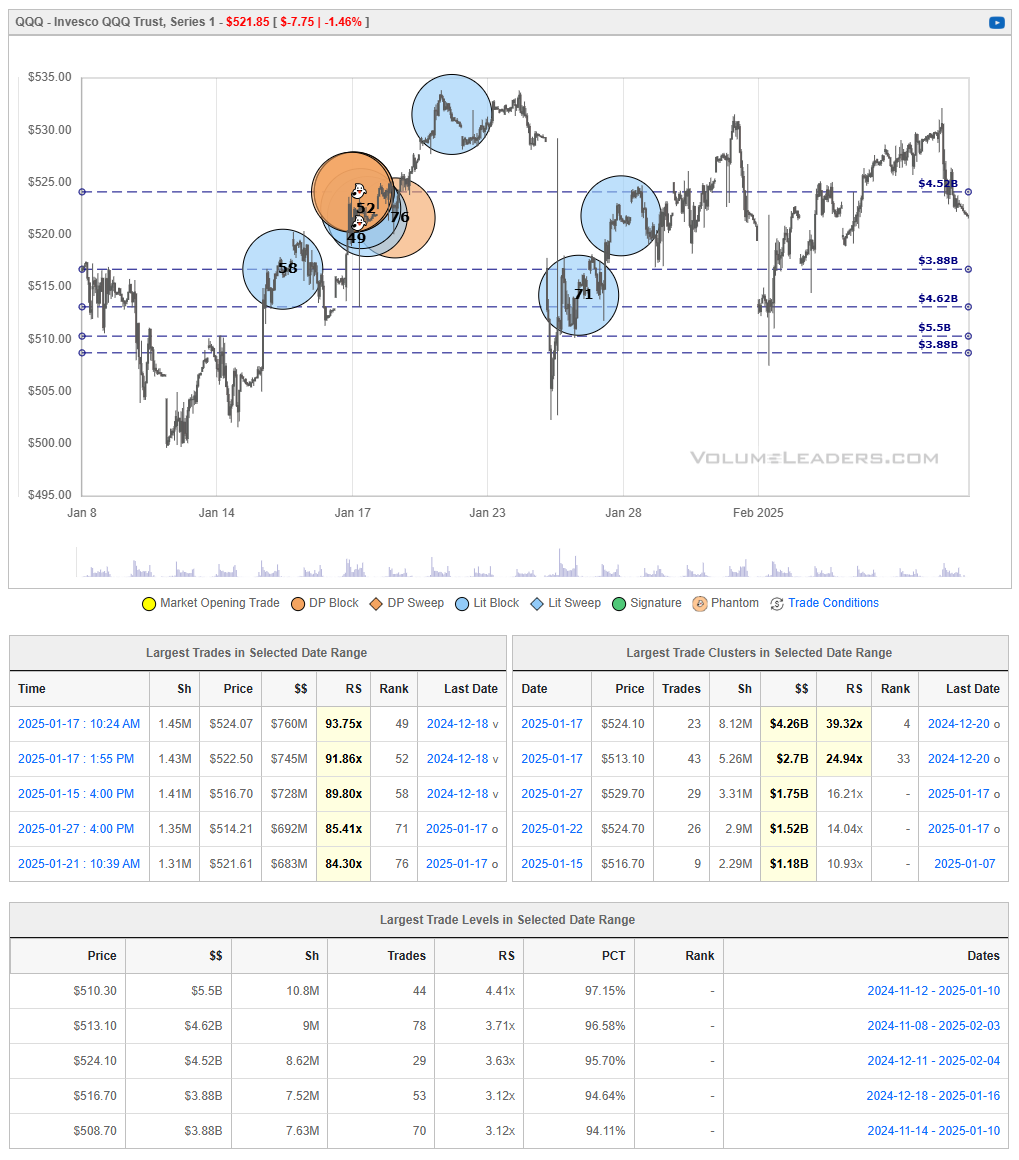
QQQ’s January rally peaked near $535 before rolling over into a choppy consolidation between roughly $515 and $530. Recent action shows price fading below $525, suggesting sellers are regaining some control. If QQQ fails to hold above $515–$520, a deeper pullback toward stronger support at $510 becomes likely. Conversely, a renewed push above $525–$530 would signal that buyers are absorbing supply, potentially allowing the ETF to re‐challenge the January highs.
IWM 0.00%↑
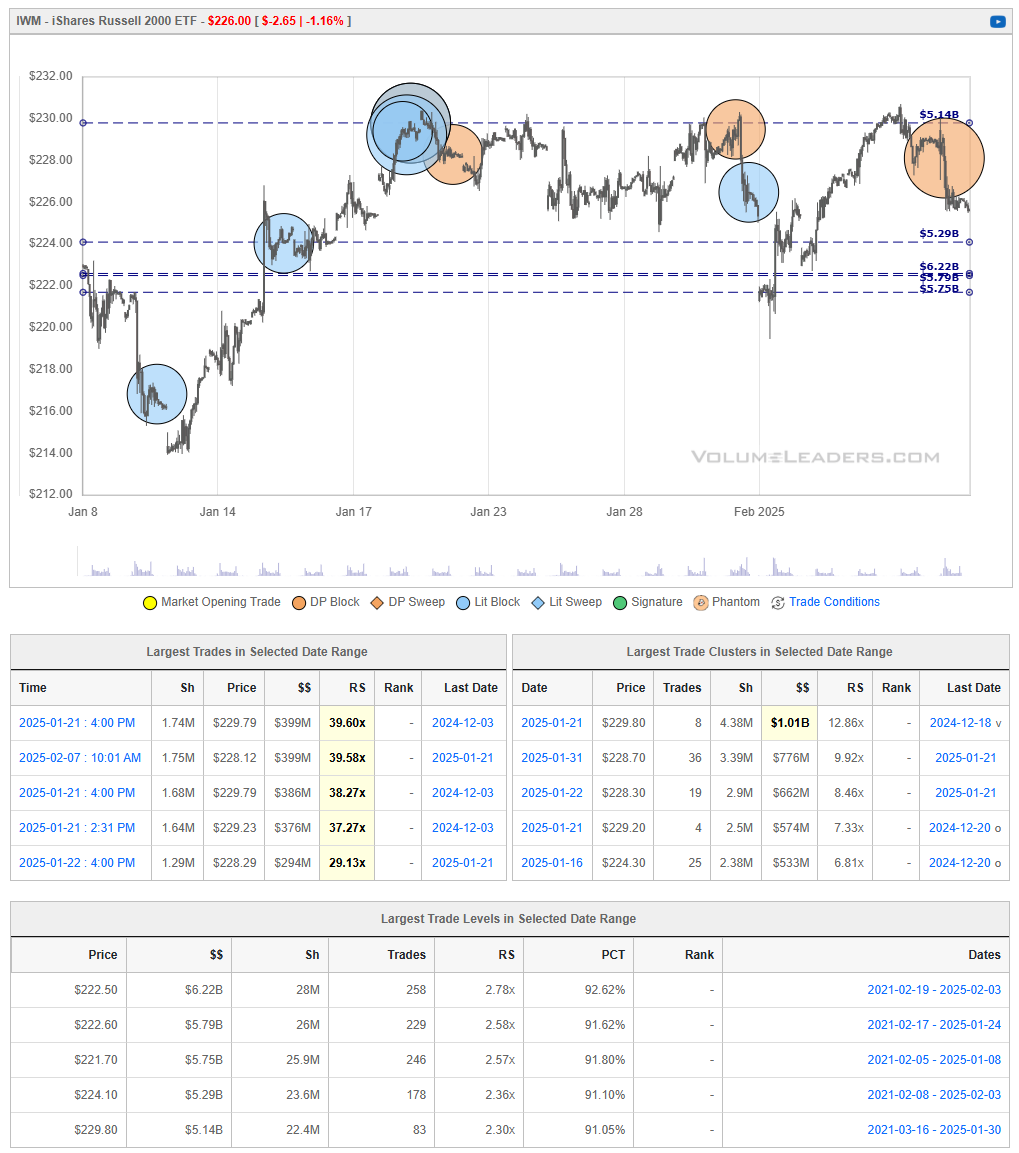
IWM’s January upswing stalled around $230–$232, where selling pressure emerged and capped further gains. The ETF has since retreated toward $224–$226, an area where institutional trades have previously stepped in to support price. If buyers can regain control and push IWM back above $228–$230, it would indicate renewed strength and possibly reestablish the uptrend. Failing that, a break under $224 raises the risk of a deeper pullback into the lower $220s.
DIA 0.00%↑
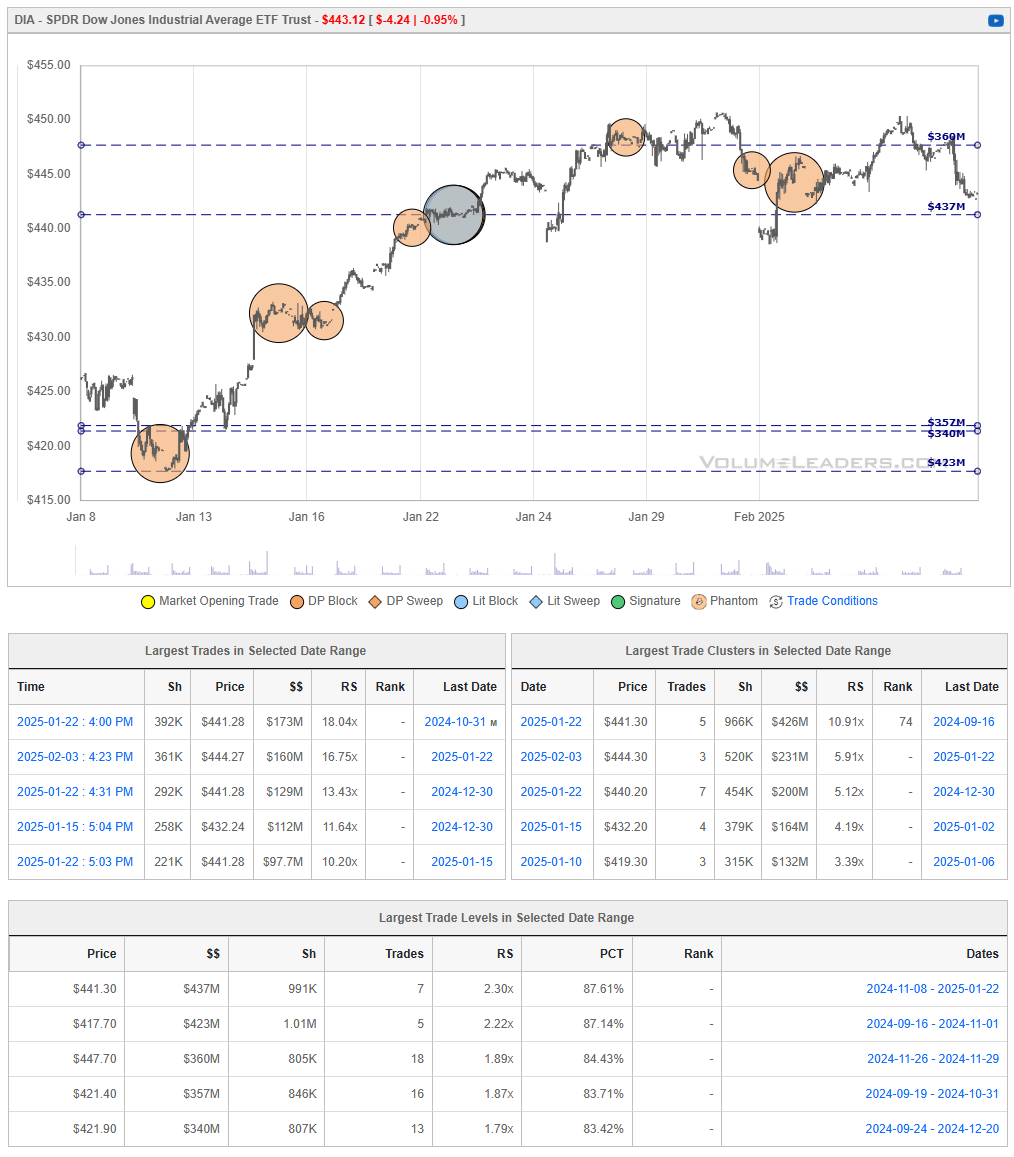
DIA’s strong January run from the low‐$420s topped out in the mid‐$450s, where selling pressure emerged. The ETF is now pulling back toward the $440–$445 band—a zone that previously provided support and saw notable institutional participation (e.g., around $441). If buyers defend this area and push price back above $450, DIA could re‐test its recent highs near $455. However, a break below $440 would indicate that sellers remain in control, possibly opening the door for a deeper decline toward support in the mid‐to‐lower $430s.
Institutional Order Flow
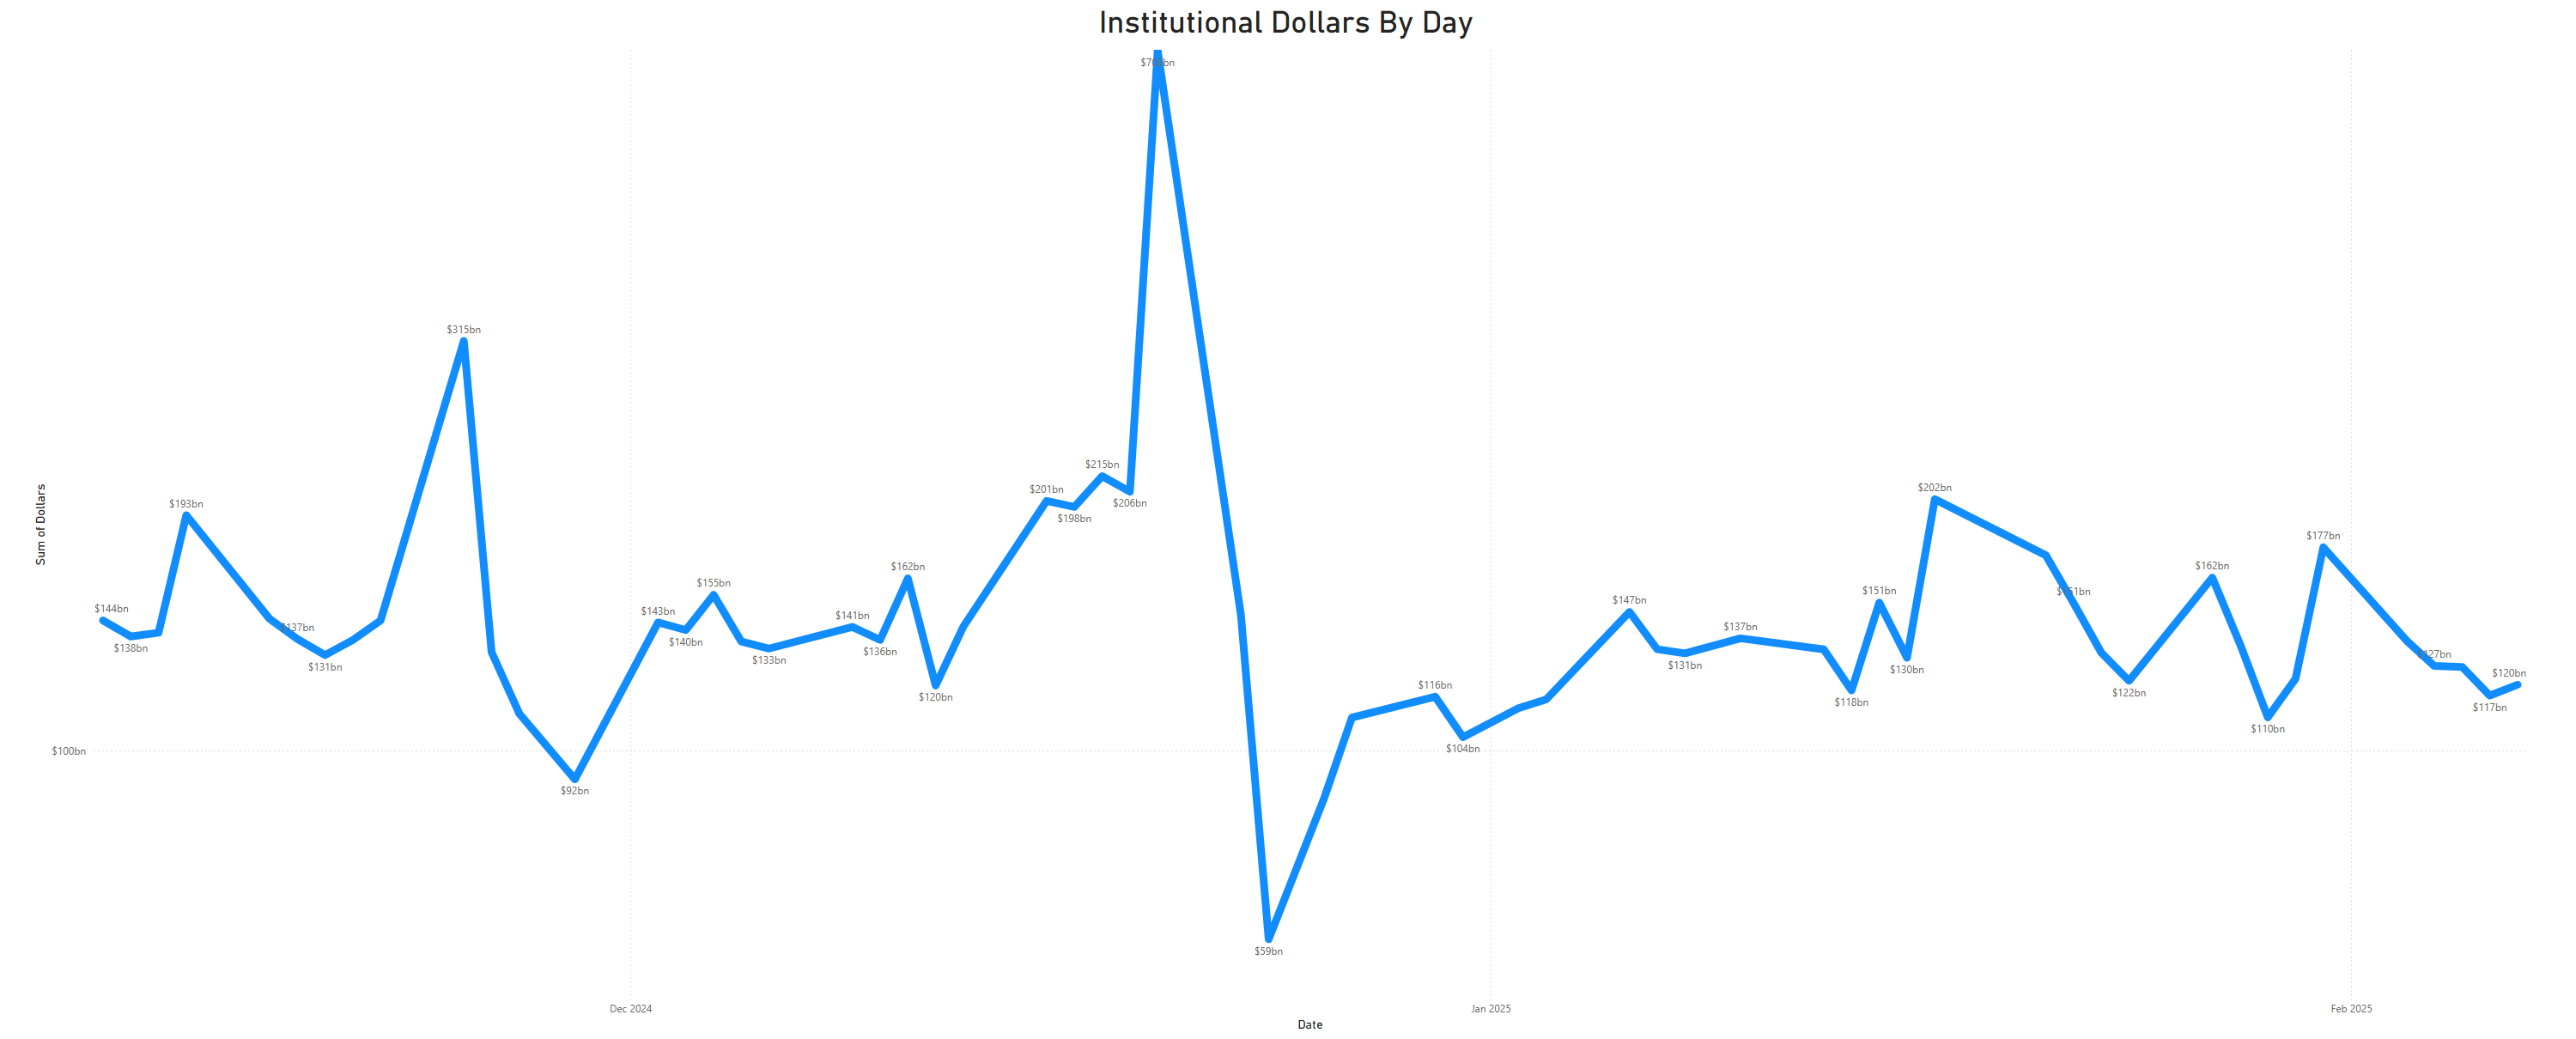
Rolling 90-Day Dollars By Day
This chart shows institutional activity by dollars by day on a rolling 1-year basis. From a theoretical standpoint, examining a chart of daily institutional dollar activity over the course of a year can offer several insights and possible inferences, though all should be approached with caution since the data alone may not prove causality or confirm underlying reasons. Some potential takeaways include:
Event-Driven Behavior:
Sharp, singular spikes on certain days might correlate with major market-moving events. These could include central bank policy announcements, significant geopolitical news, sudden macroeconomic data releases (like employment reports or GDP data), earnings seasons for large-cap companies, or unexpected shocks (e.g., mergers, acquisitions, regulatory changes).Liquidity Dynamics:
Institutions often concentrate large trades on days with higher expected liquidity. For instance, heightened activity might coincide with index reconstitutions, option expiration dates, or the days leading up to or following a major index rebalance, when large amounts of capital shift hands simultaneously.Risk Management and Hedging Activity:
Institutions may significantly adjust their exposures on days that are critical from a risk management perspective. Large spikes can occur if hedge funds, pension funds, or asset managers are rolling over futures contracts, initiating or closing out large hedges, or reacting to volatility triggers.Market Sentiment Indicators:
While the data is purely transactional, the sheer volume of institutional involvement on certain days might indirectly hint at changing sentiment or strategic shifts.
In essence, a chart like this can lead you to hypothesize that institutional trading volumes are not constant or random but rather influenced by a mix of predictable calendar effects, major market events, liquidity considerations, risk management decisions, and strategic allocation shifts.
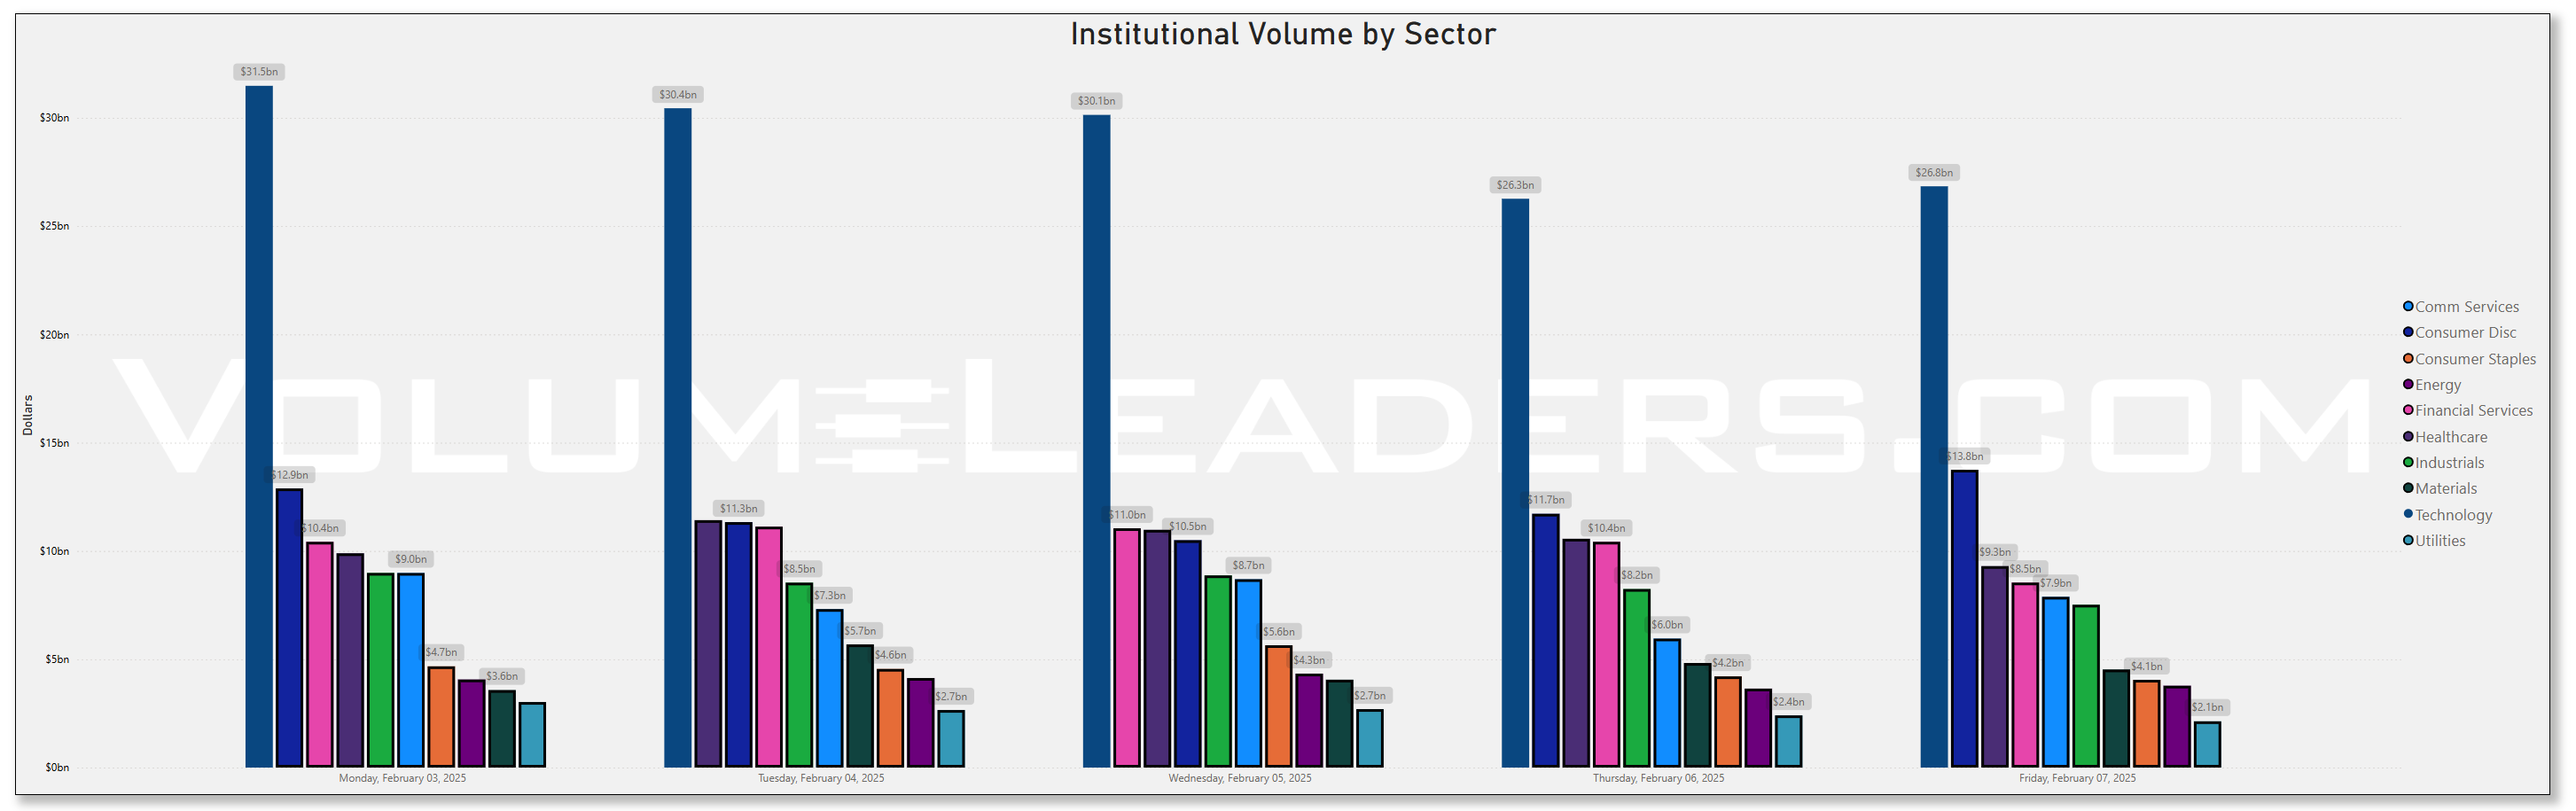
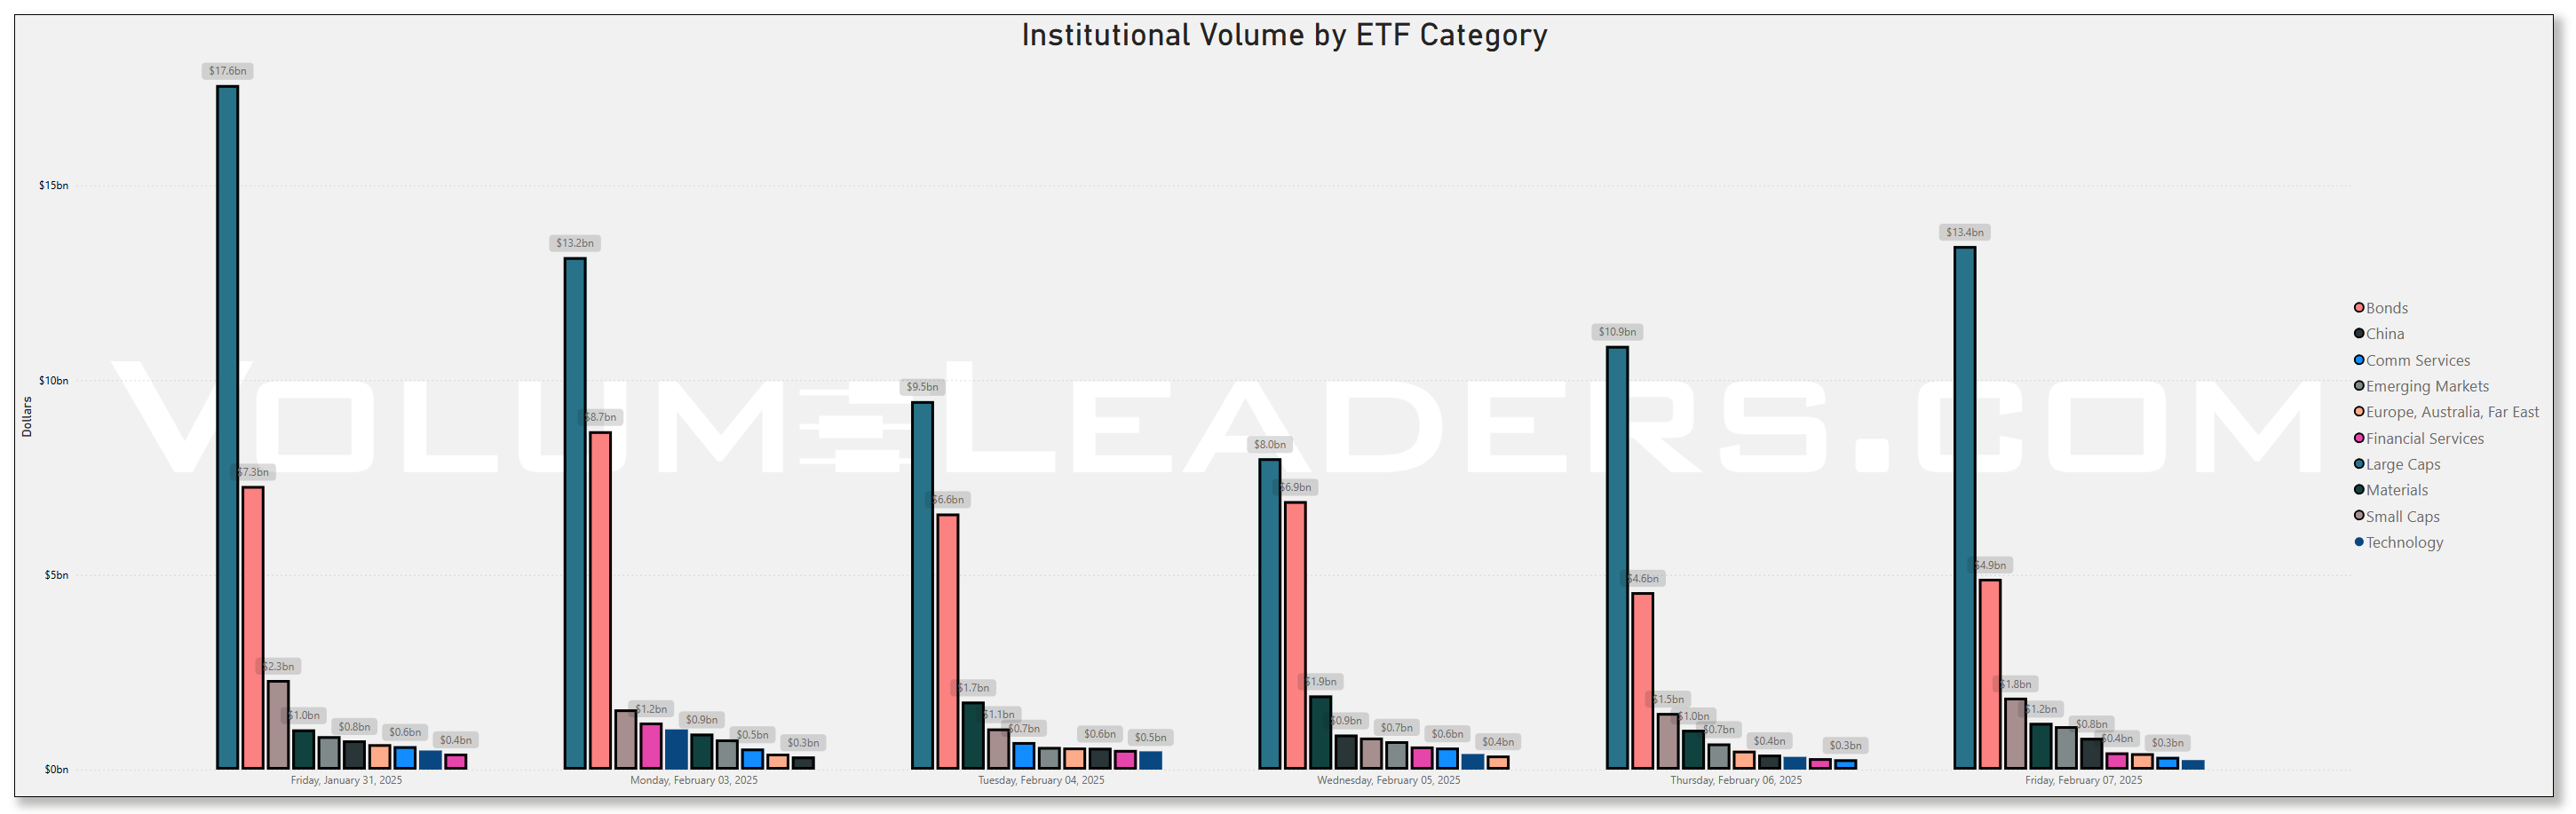
Top Institutional Order Flow By Sector By Week For The Past 90-Days
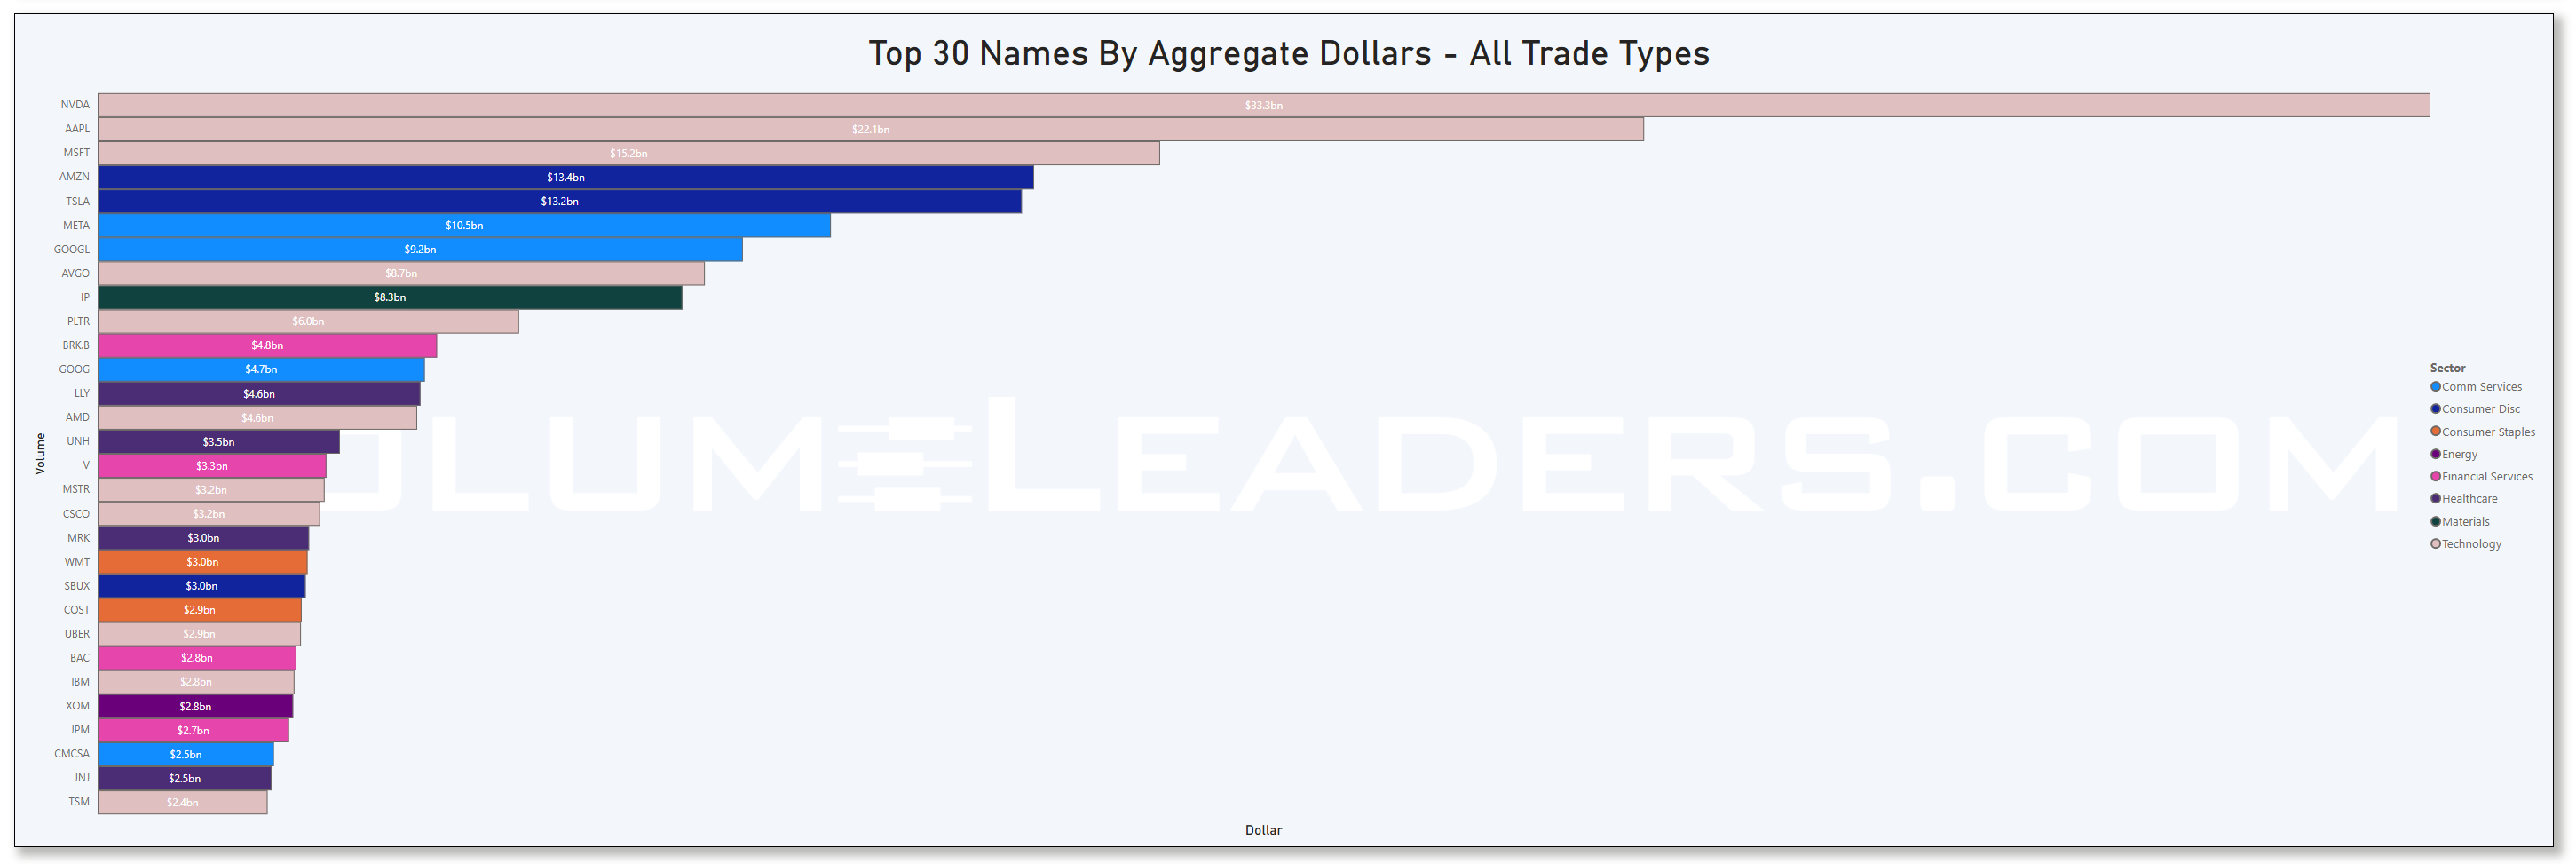
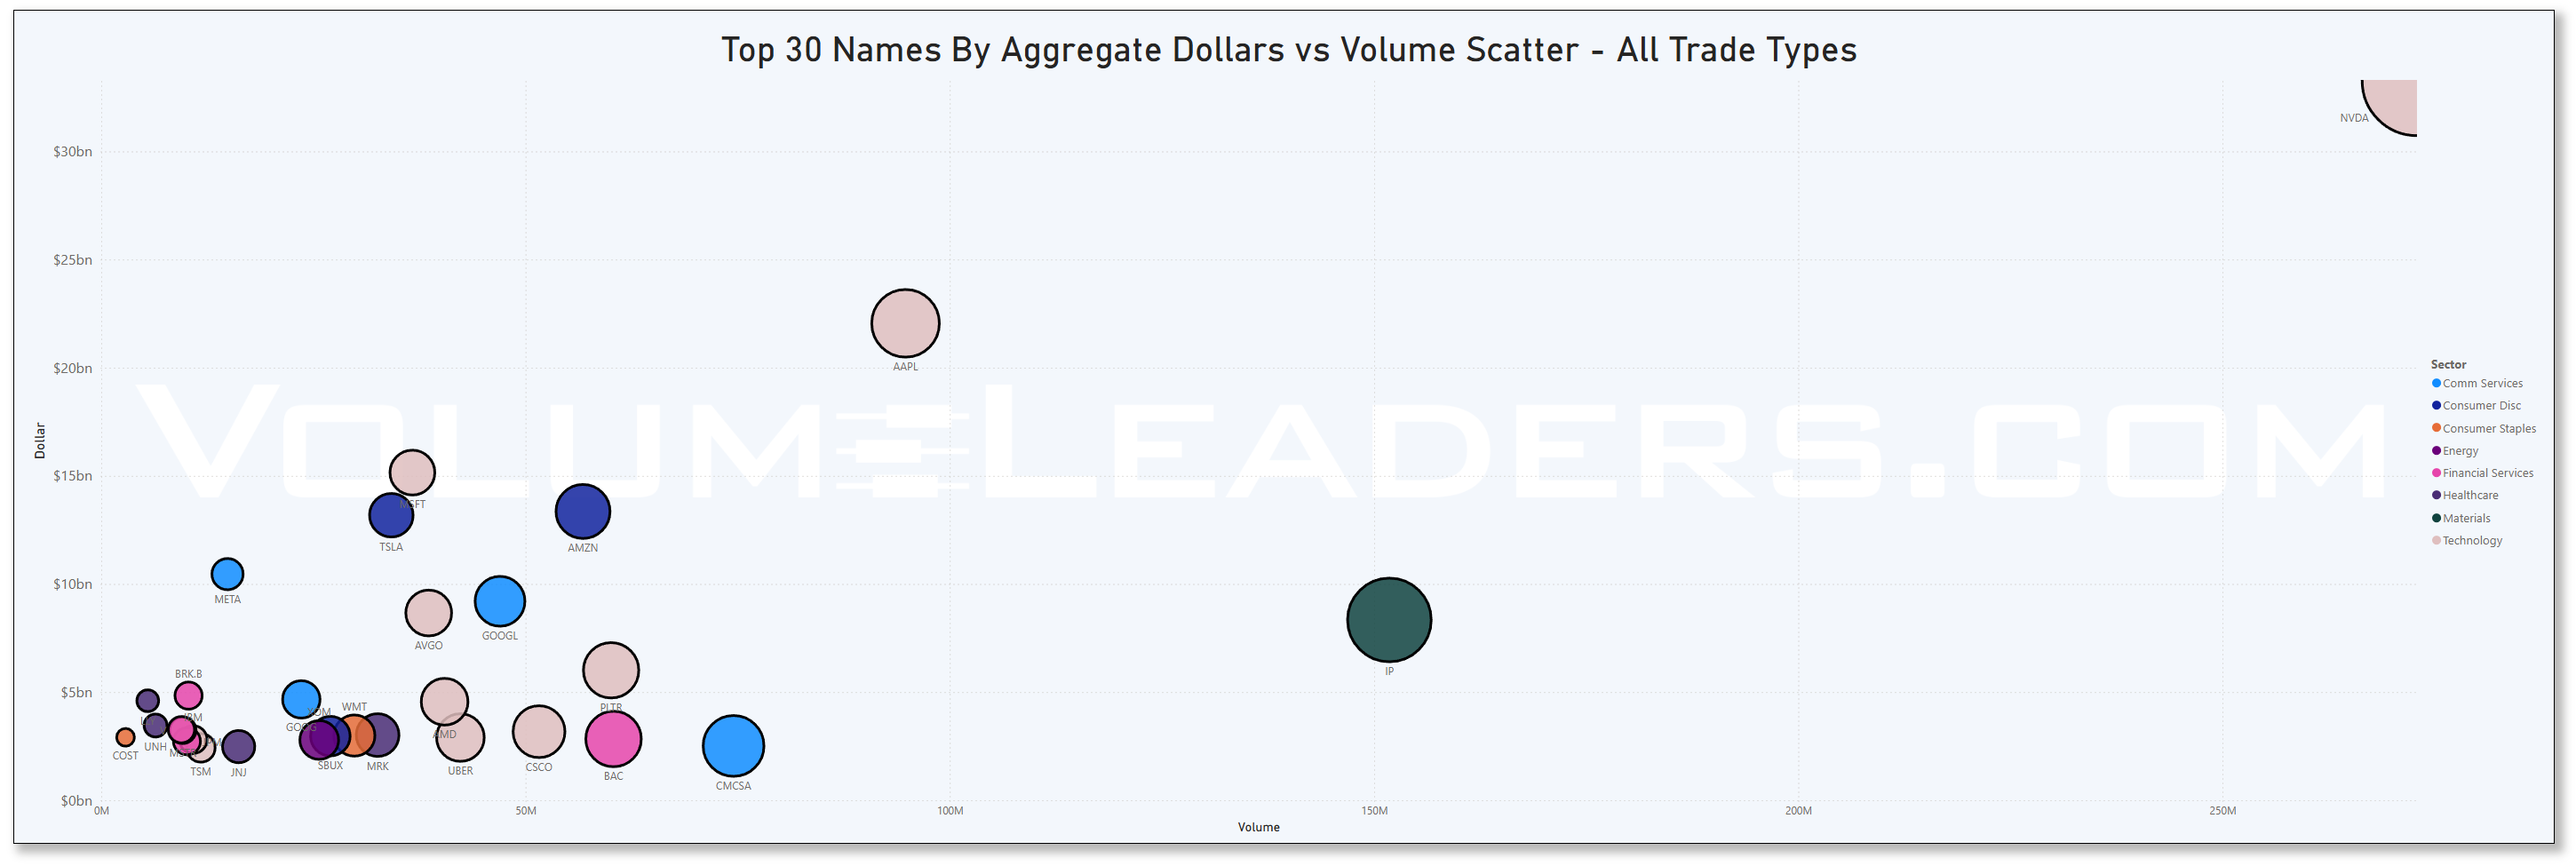
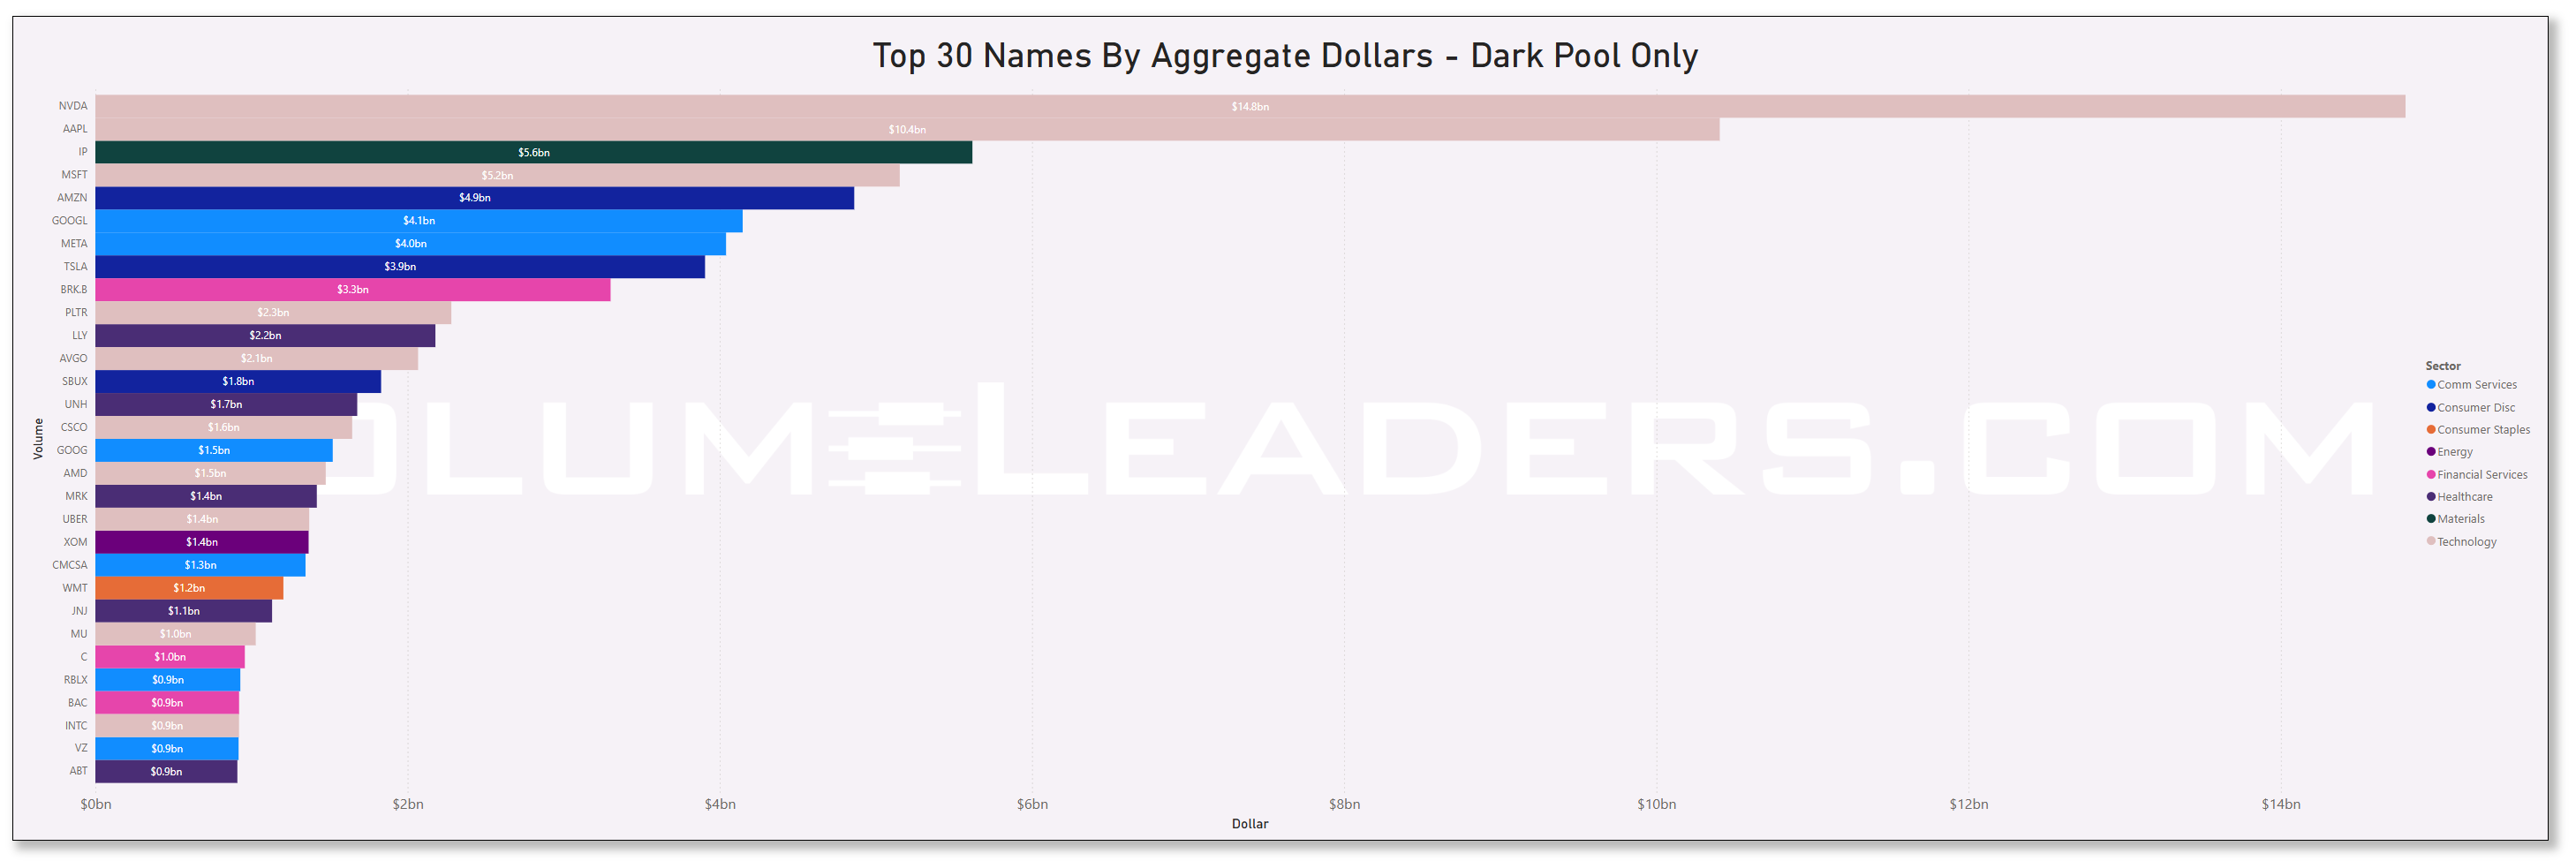
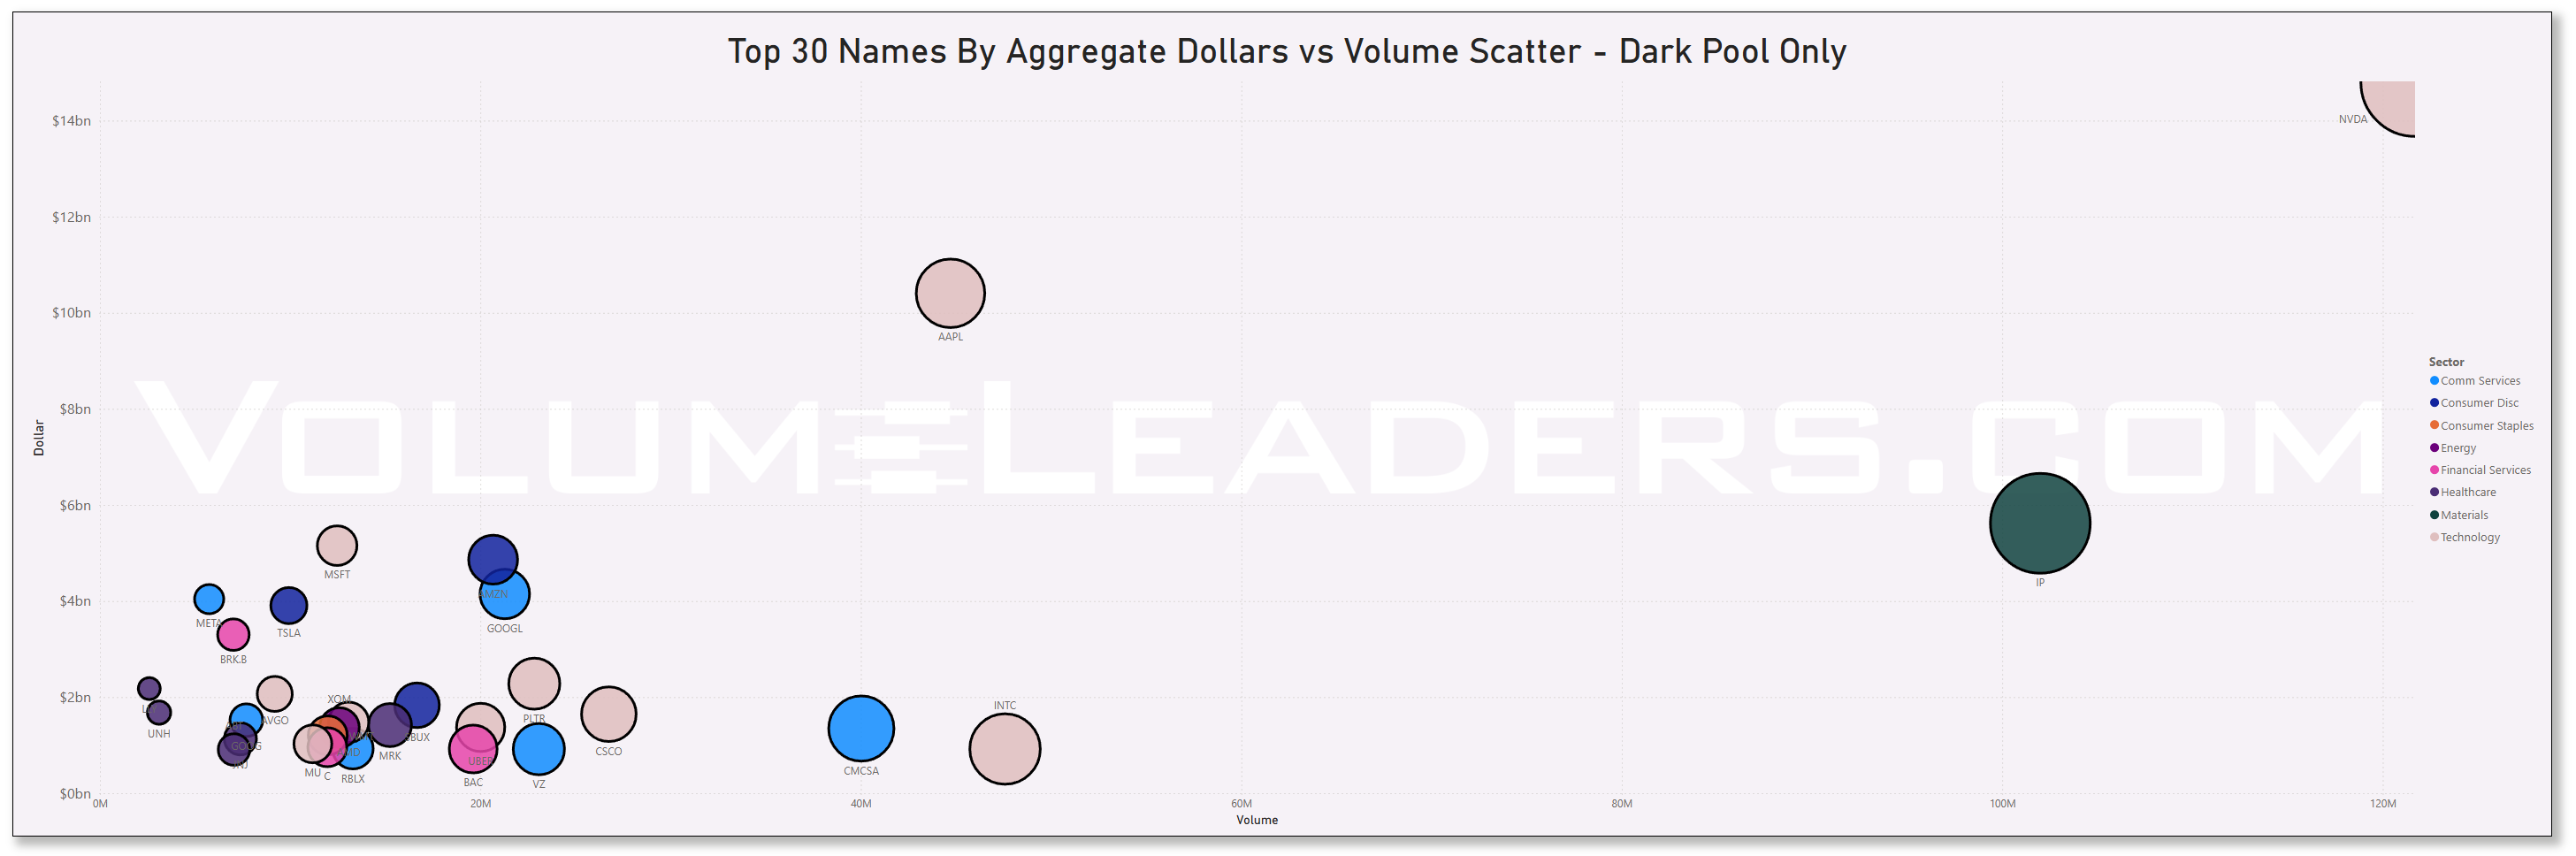
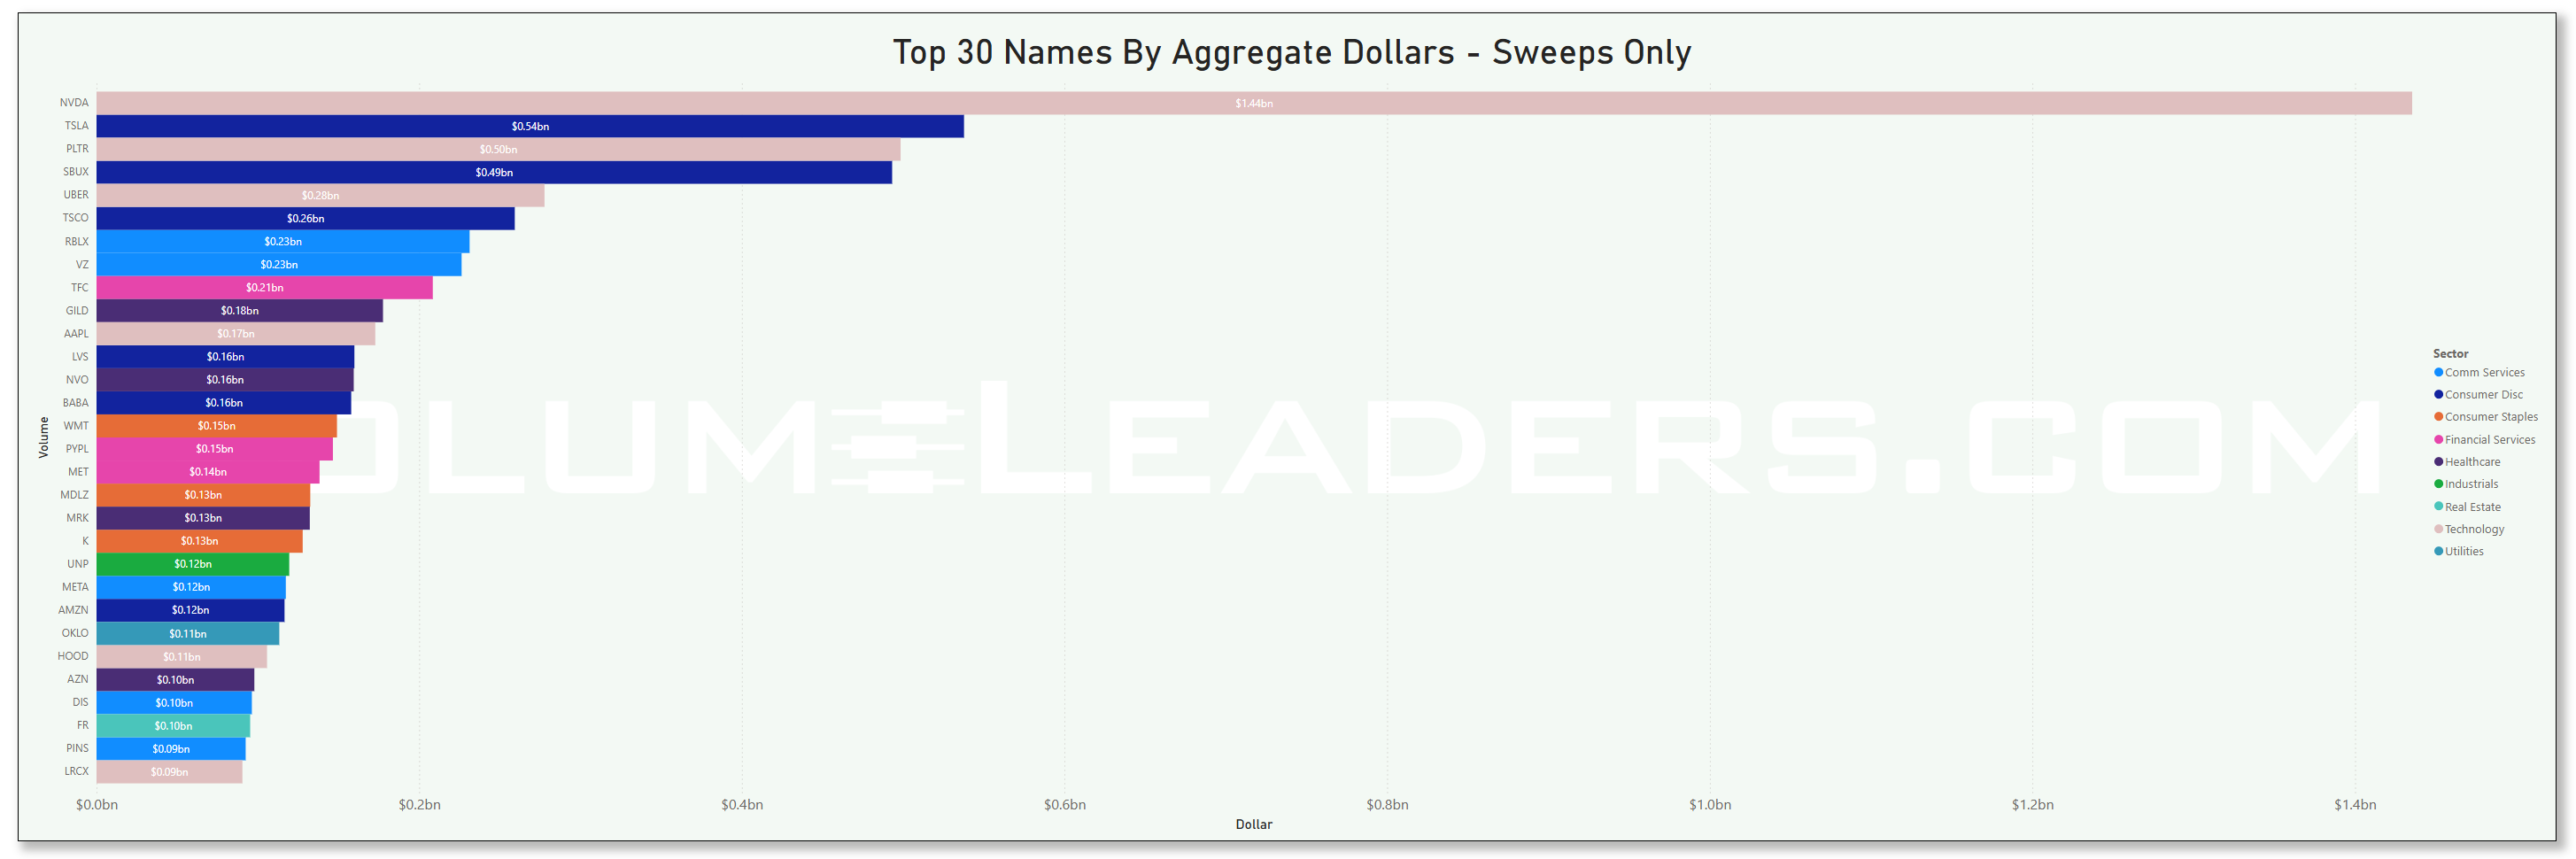
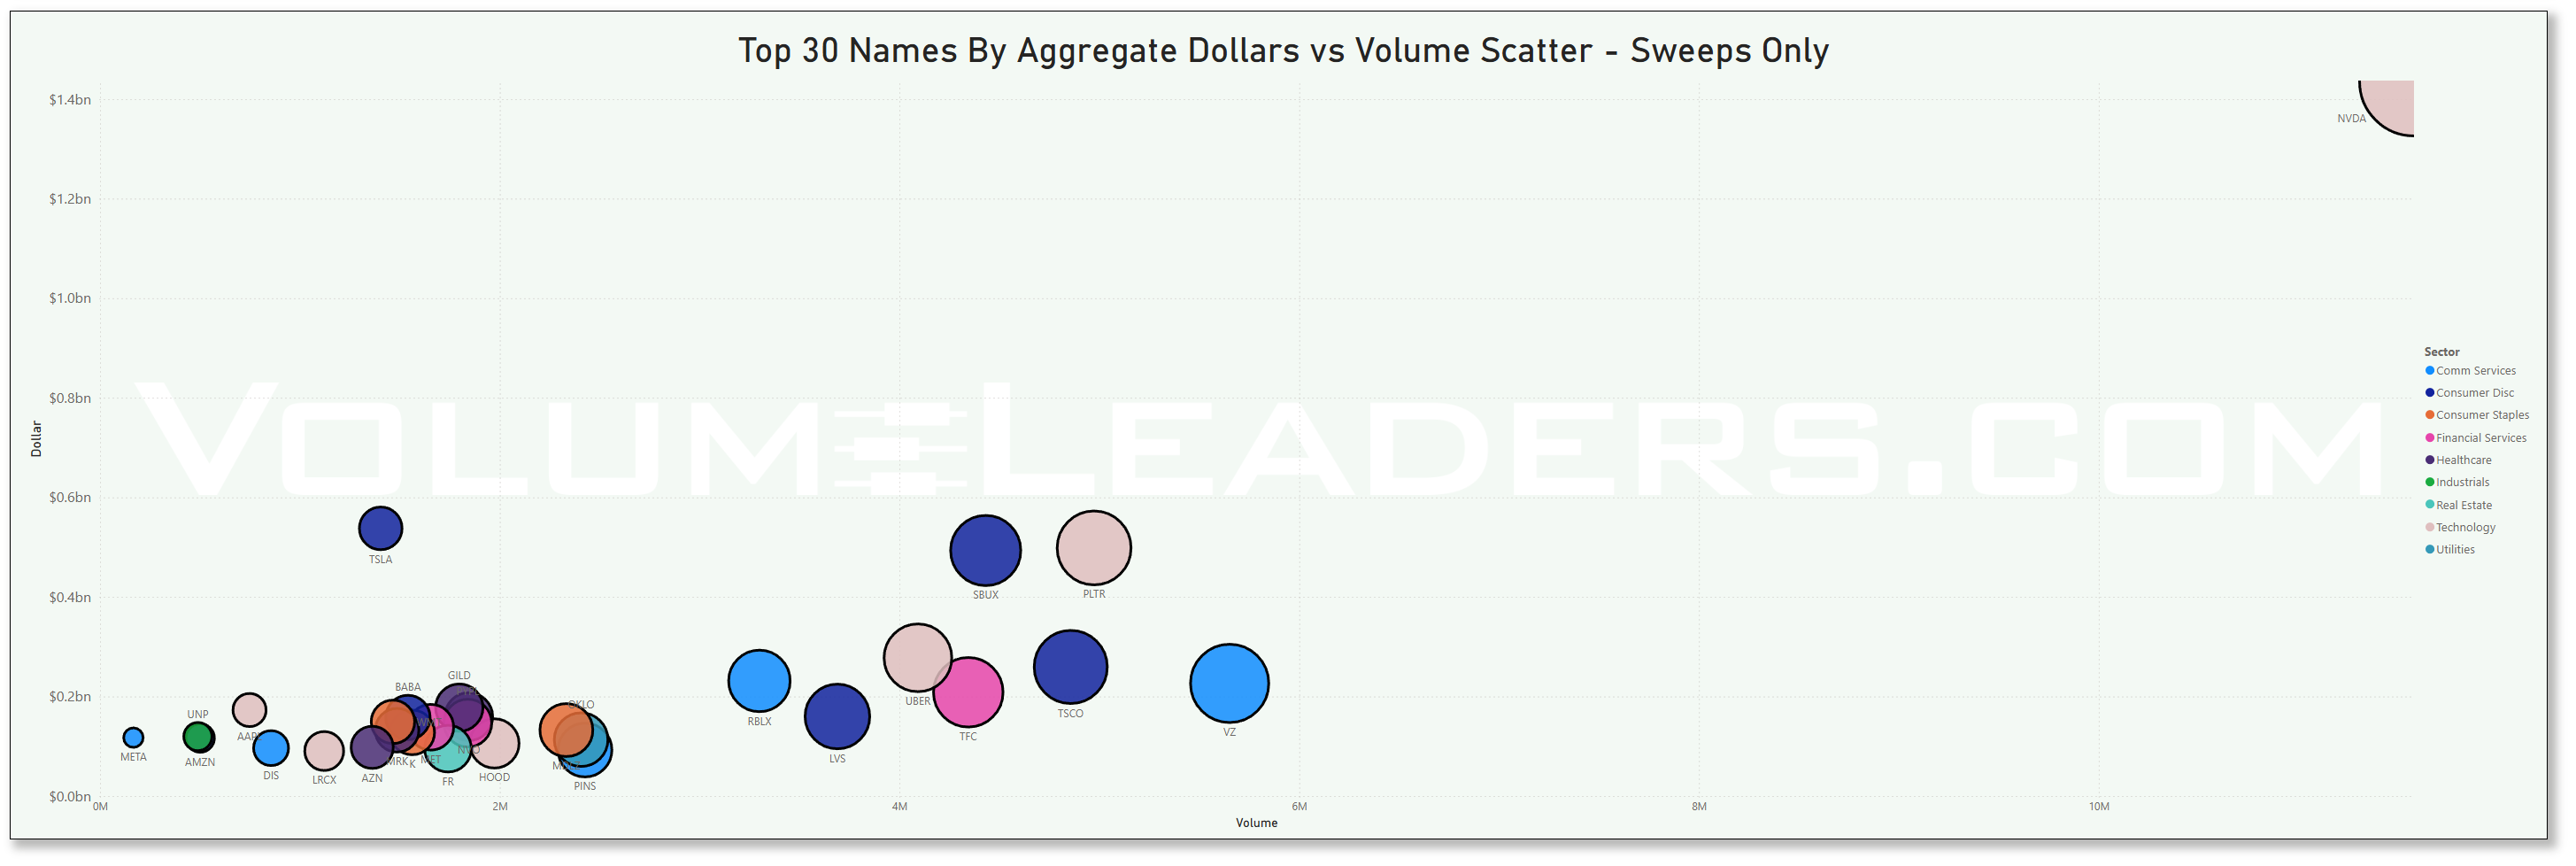
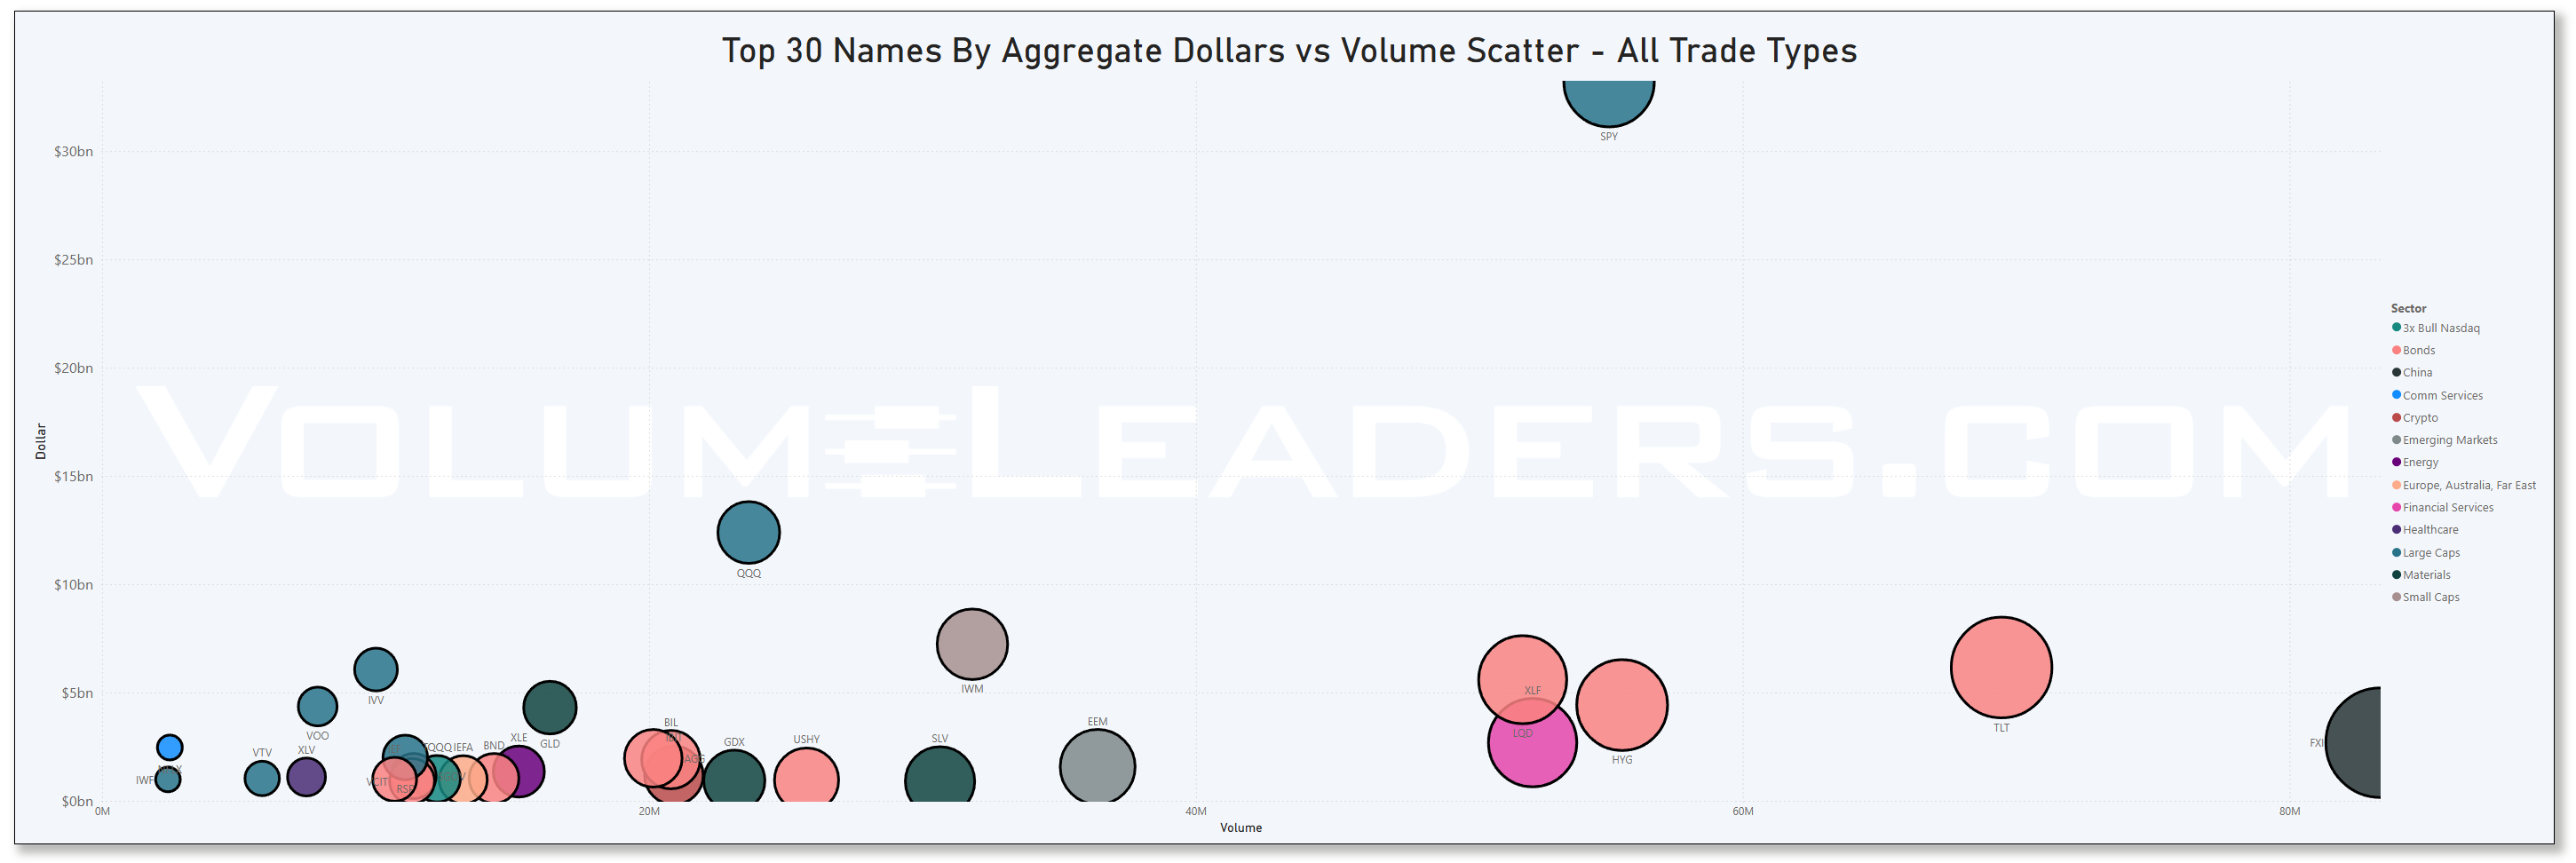
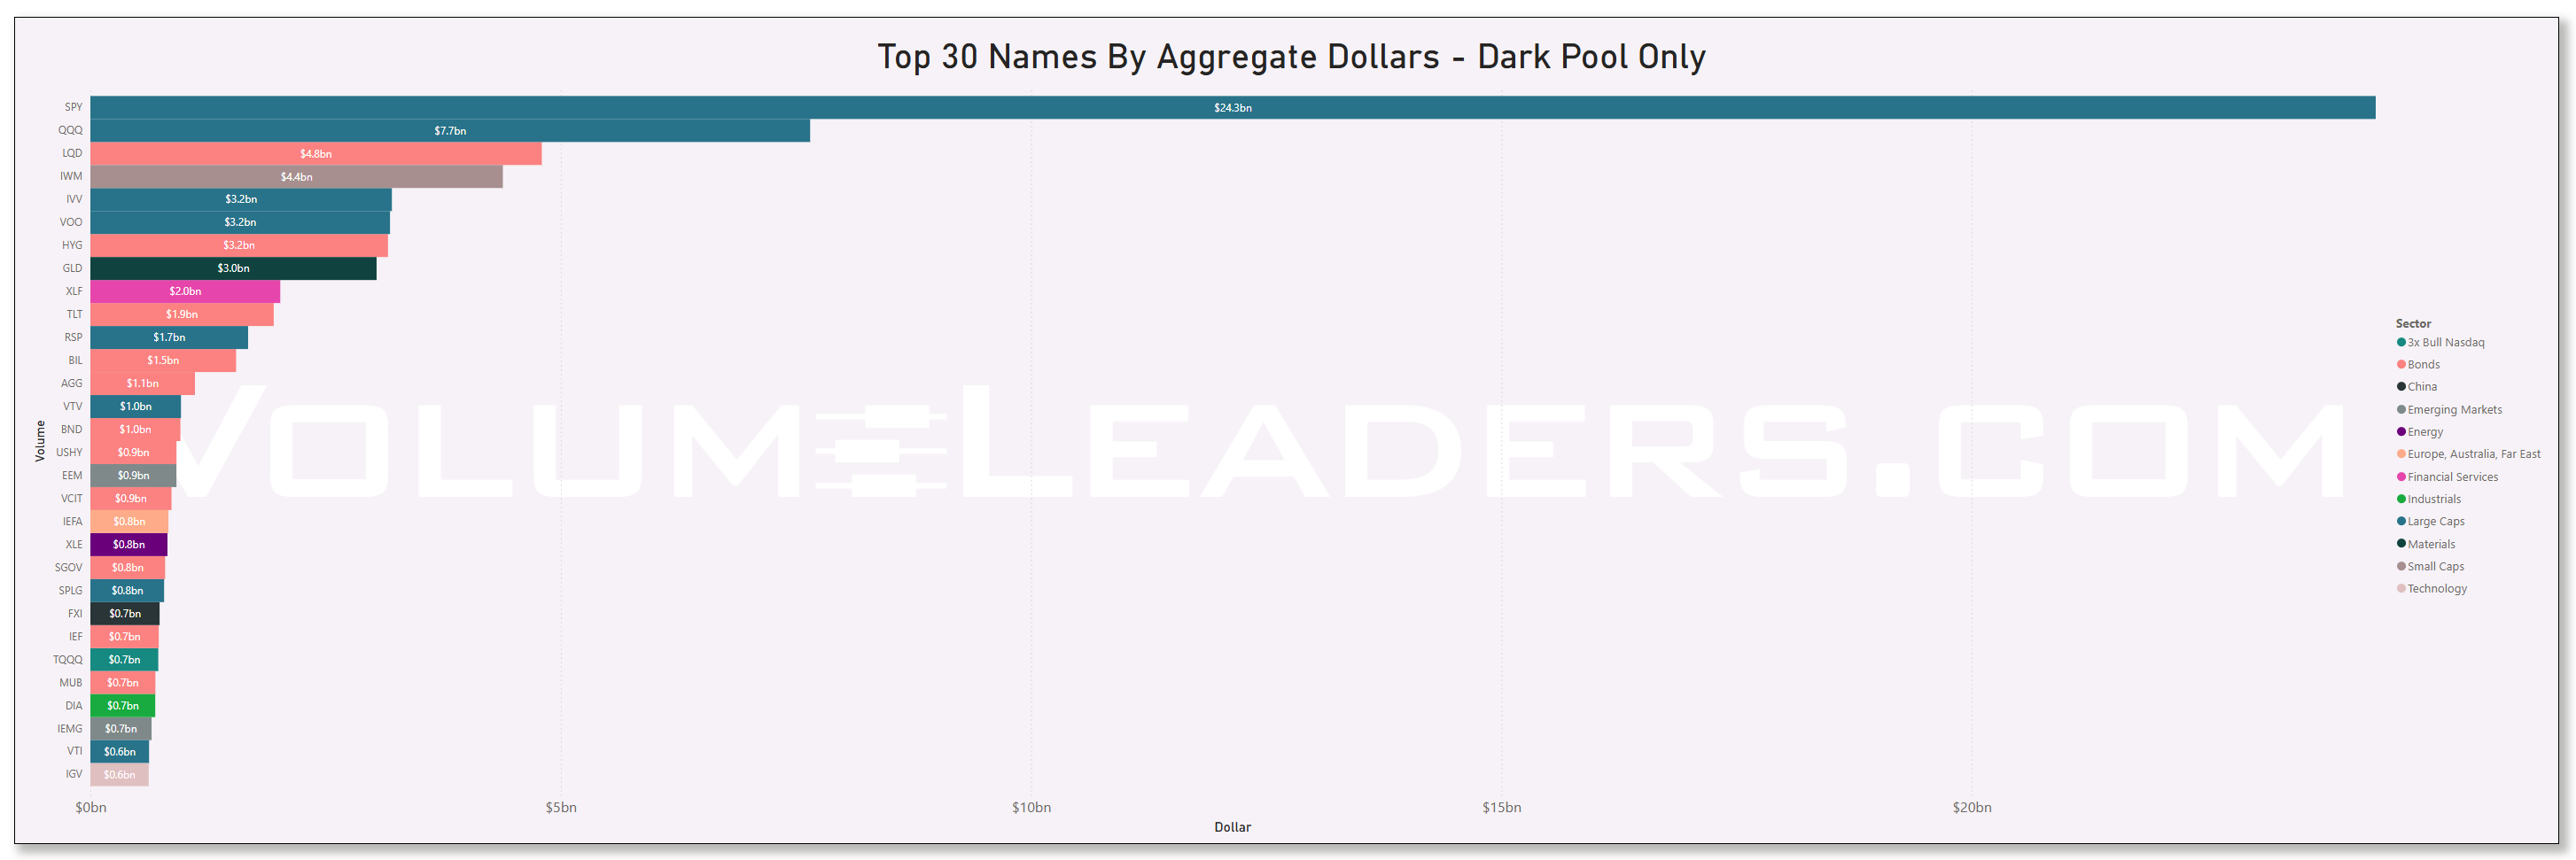
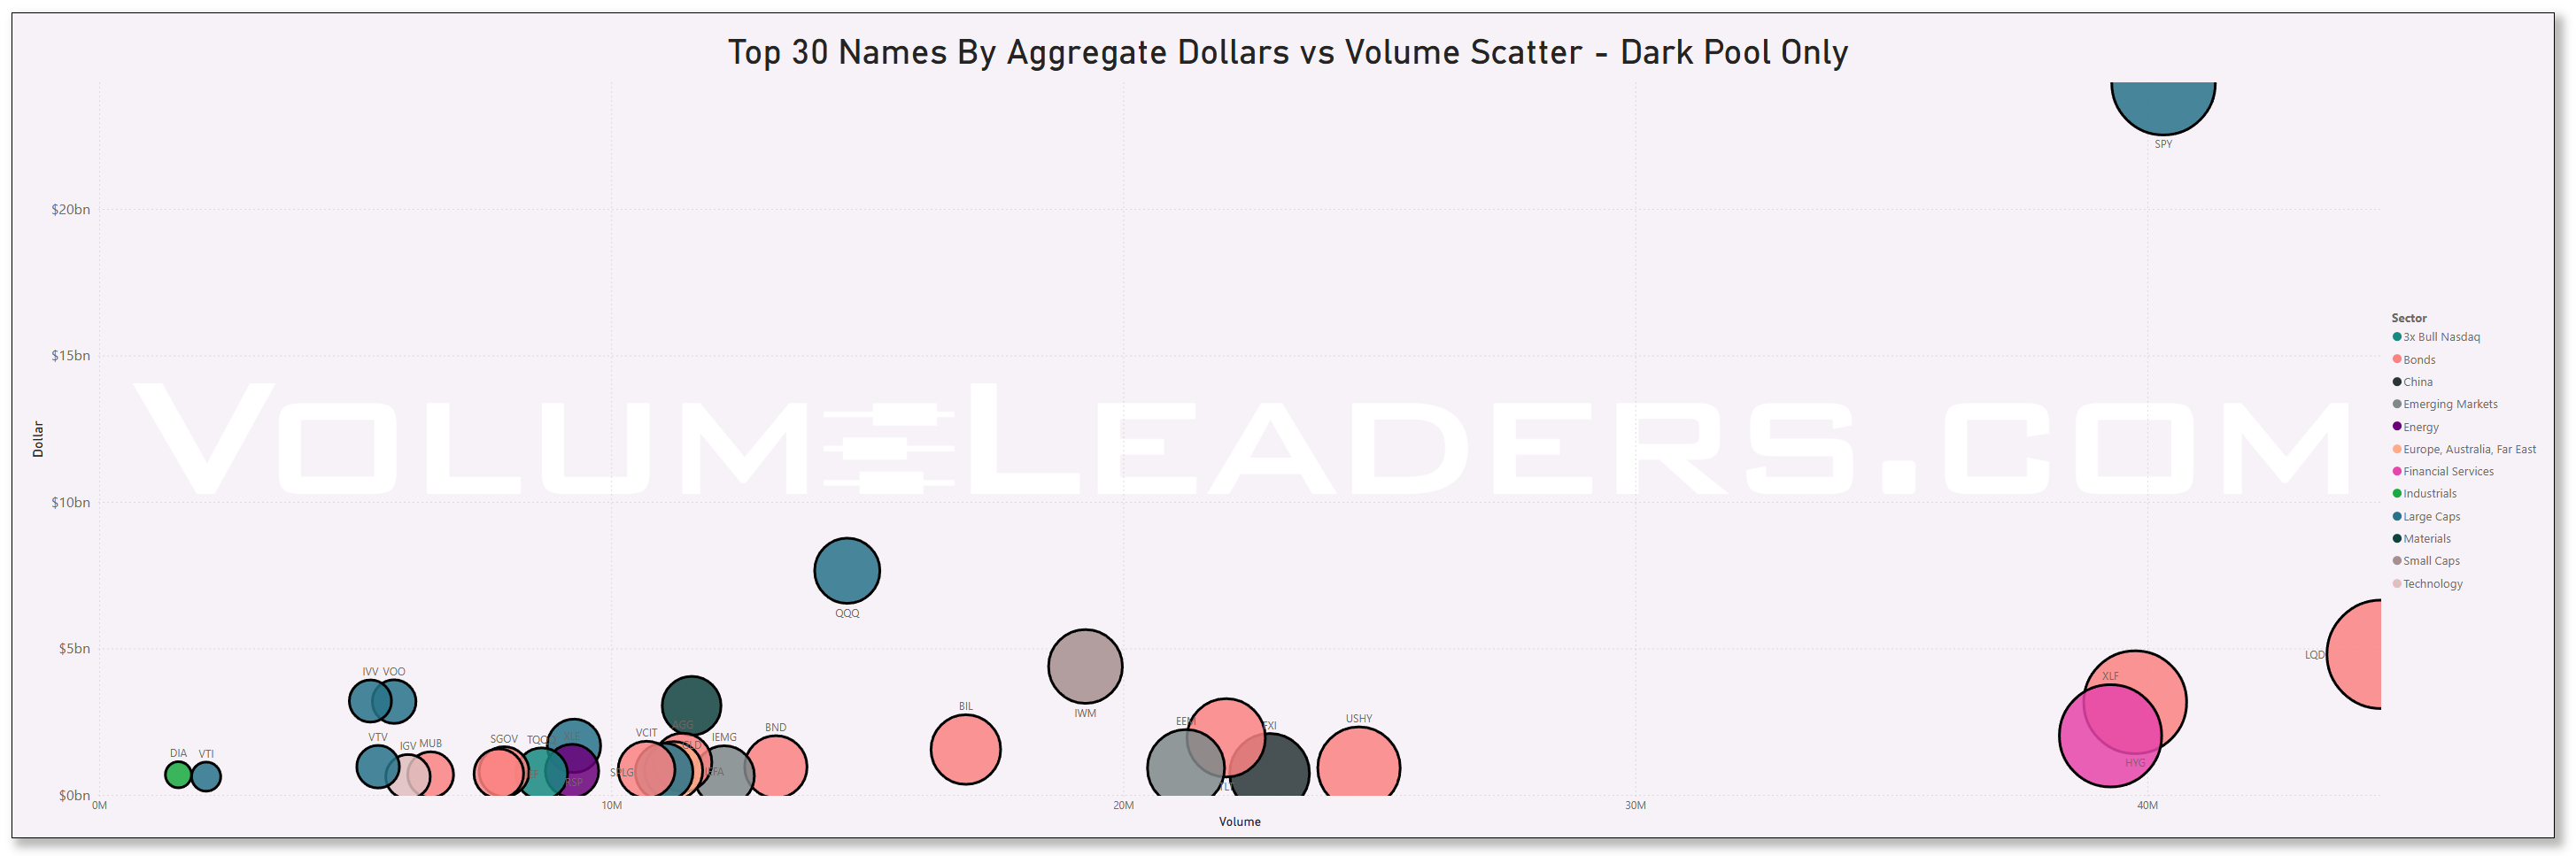
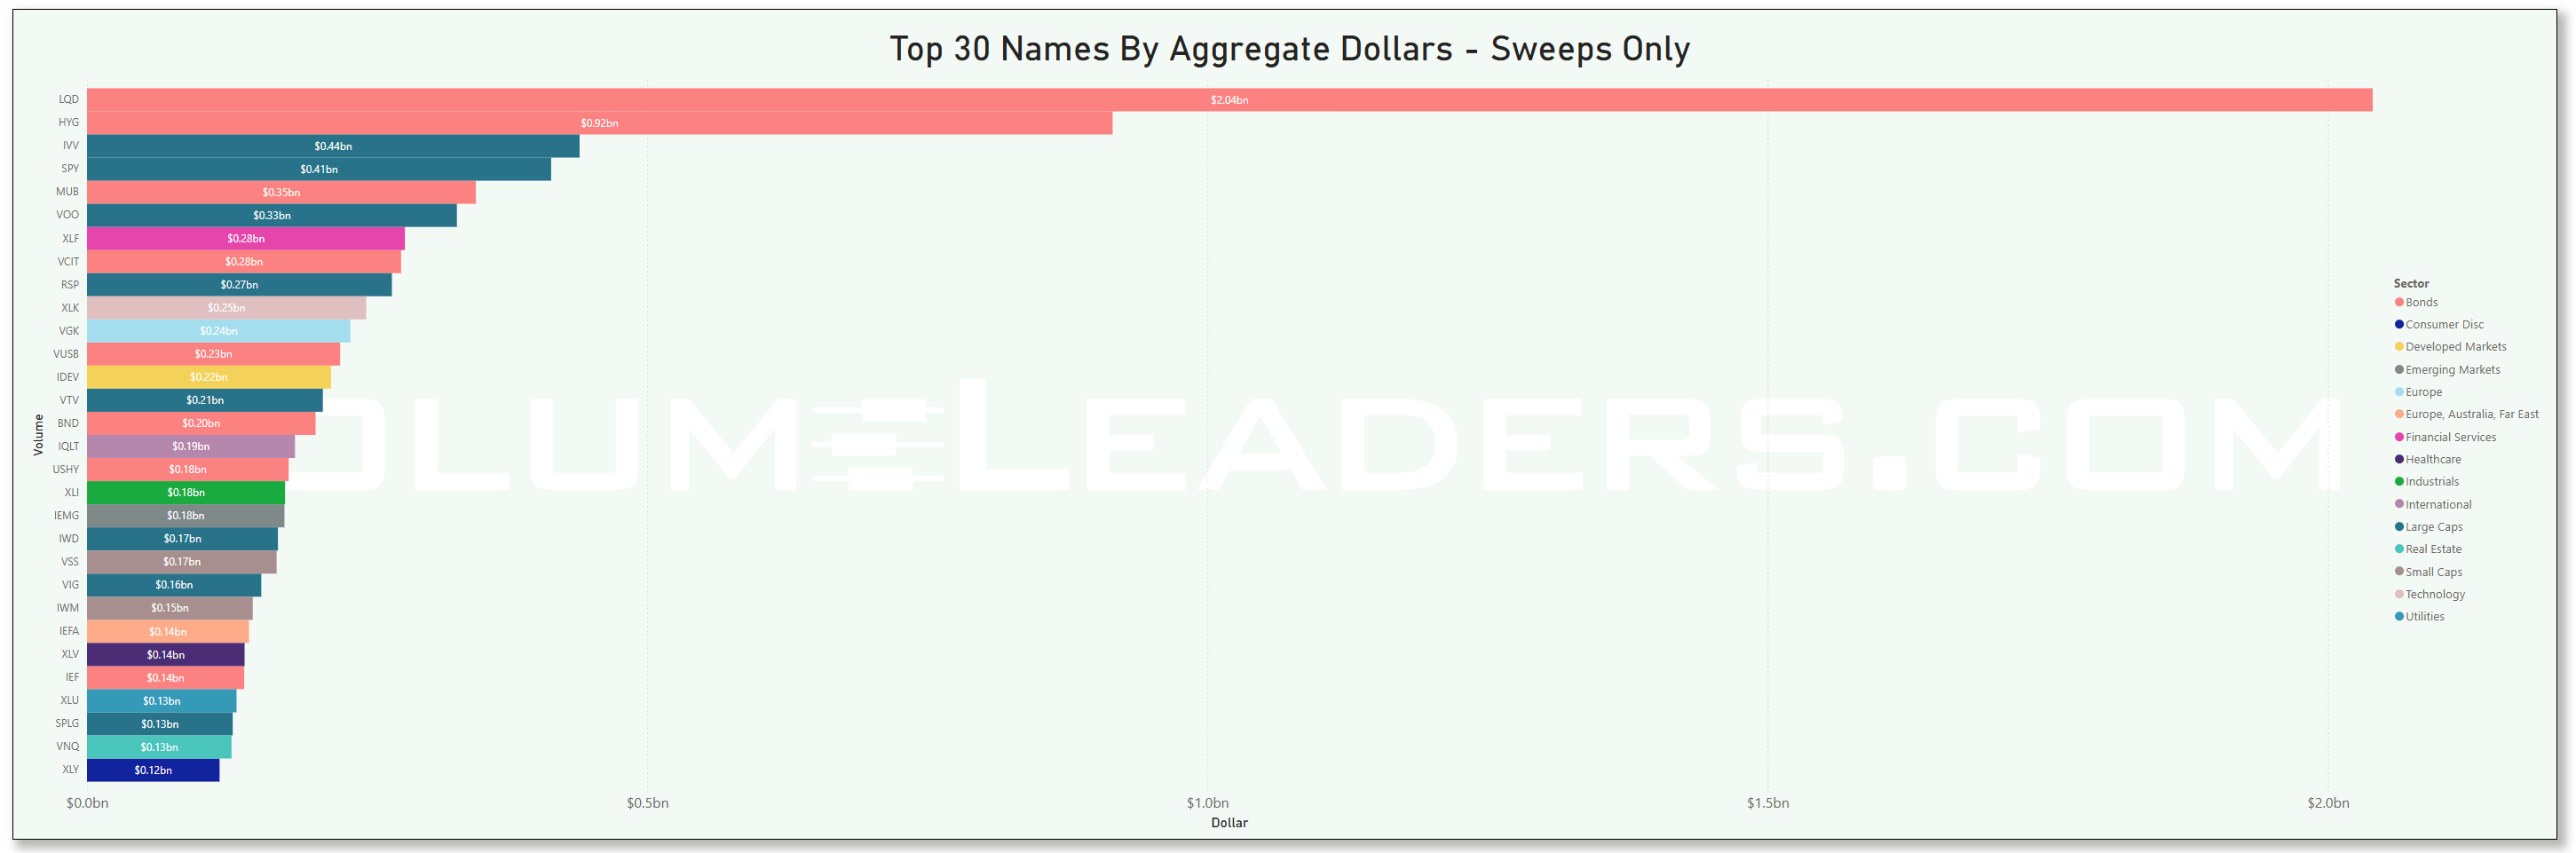
Top Institutional Order Flow In Individual Names By Trade-Type For Equities
These are incredibly important charts to watch as they contains lots of nuanced suggestions at a thematic level. Watch these charts closely week-to-week to stay informed about where institutional money is flowing, adjust your strategies based on momentum, align your portfolio with macroeconomic and market trends, and manage risks more effectively by avoiding sectors losing institutional favor.
Sector Rotation Insights: The chart highlights which sectors are attracting institutional activity and which are losing favor. Institutions often lead market trends, so tracking shifts in their focus can indicate sector rotations.
Sentiment Analysis: The level of institutional activity reflects confidence in specific sectors. Rising activity in traditionally defensive sectors (e.g., healthcare, utilities) may indicate caution, while a surge in growth sectors (e.g., technology, consumer discretionary) could suggest optimism.
Emerging Trends: Sudden spikes in a previously overlooked sector, like industrials or consumer staples, might hint at emerging opportunities or structural shifts.
Macro Themes: Changes in sector activity often align with broader macroeconomic themes like inflation, interest rates, or geopolitical events. For instance:
Increased activity in energy might indicate concerns about oil supply or rising prices.
Growth in technology could align with innovations or favorable policies.
Risk Management: Declining institutional activity in a sector might signal weakening fundamentals or heightened risks.
Spotting Overcrowding: Excessive activity in a single sector over multiple weeks may suggest overcrowding, which could lead to heightened volatility if institutions begin to exit.

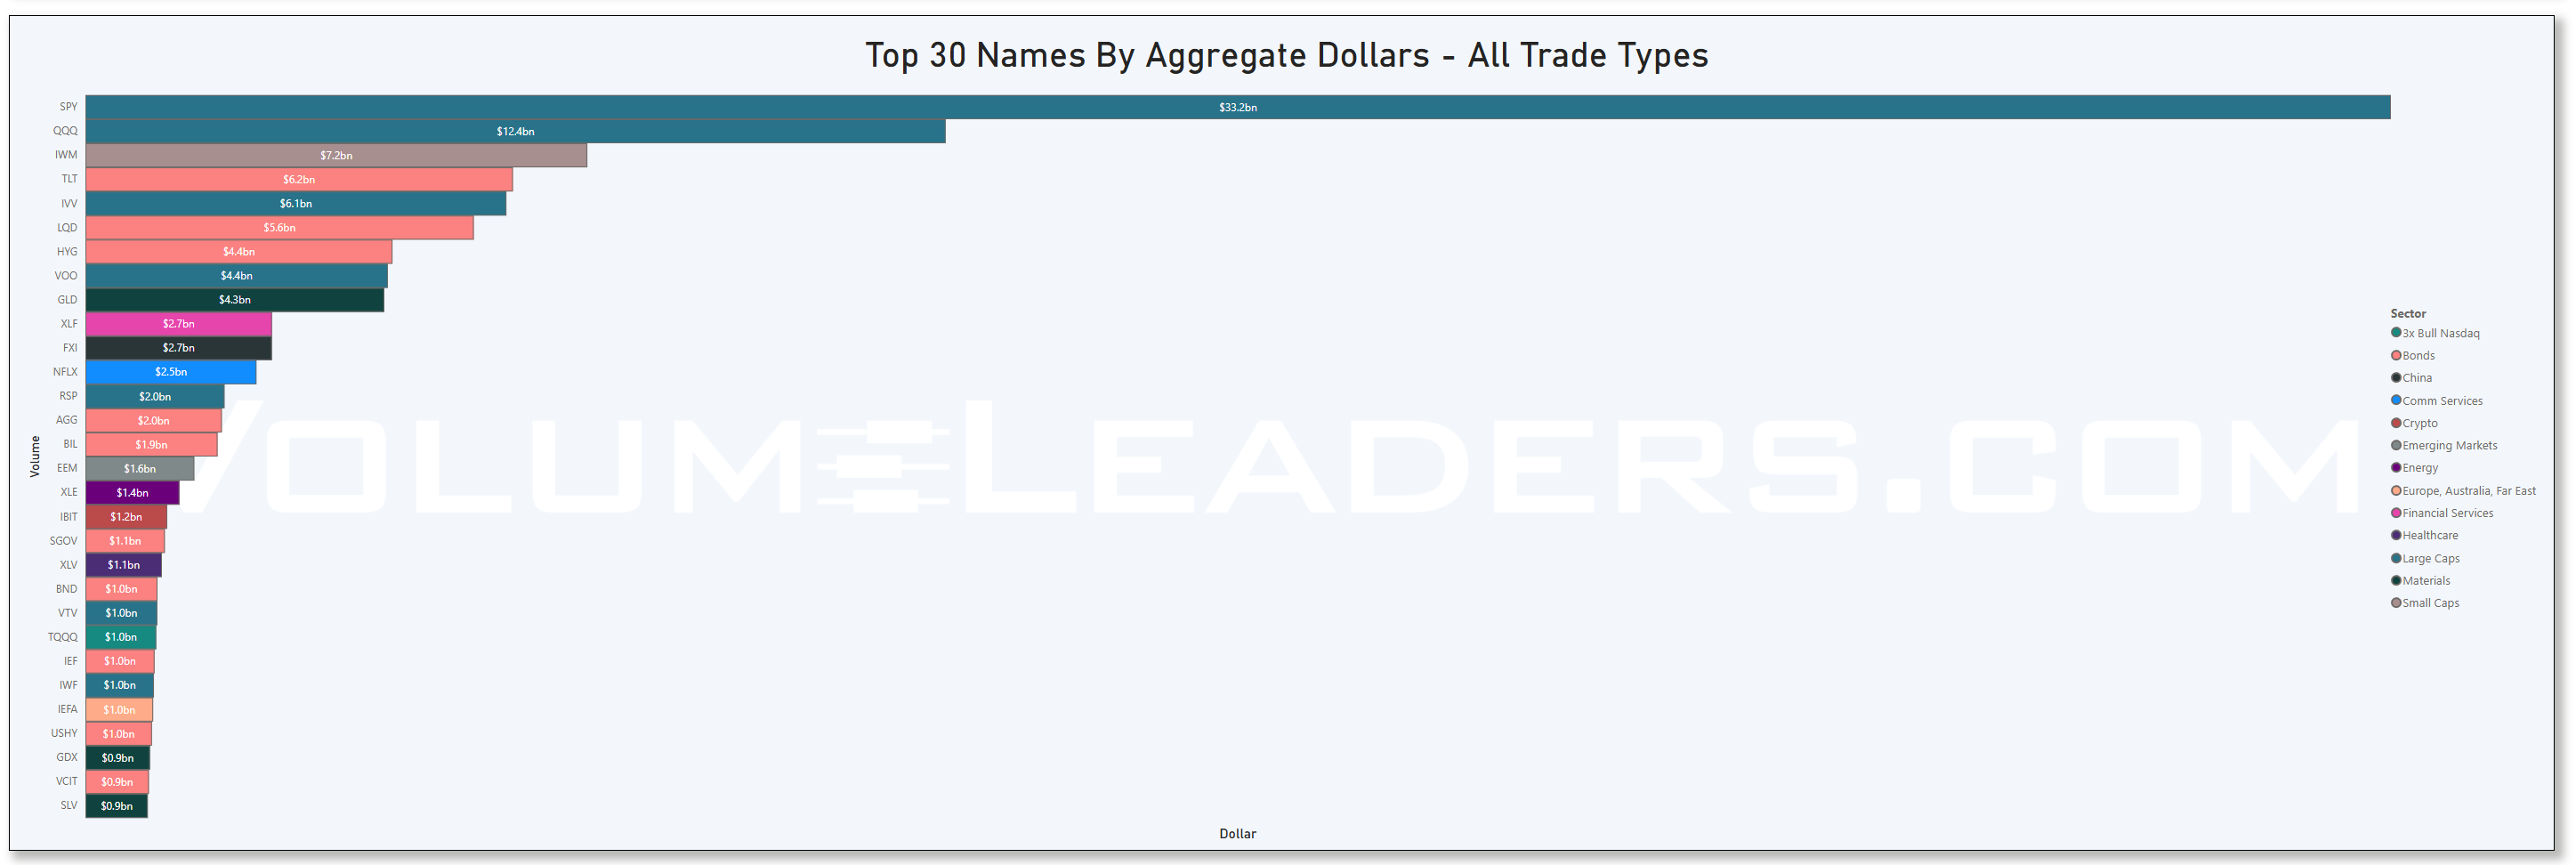
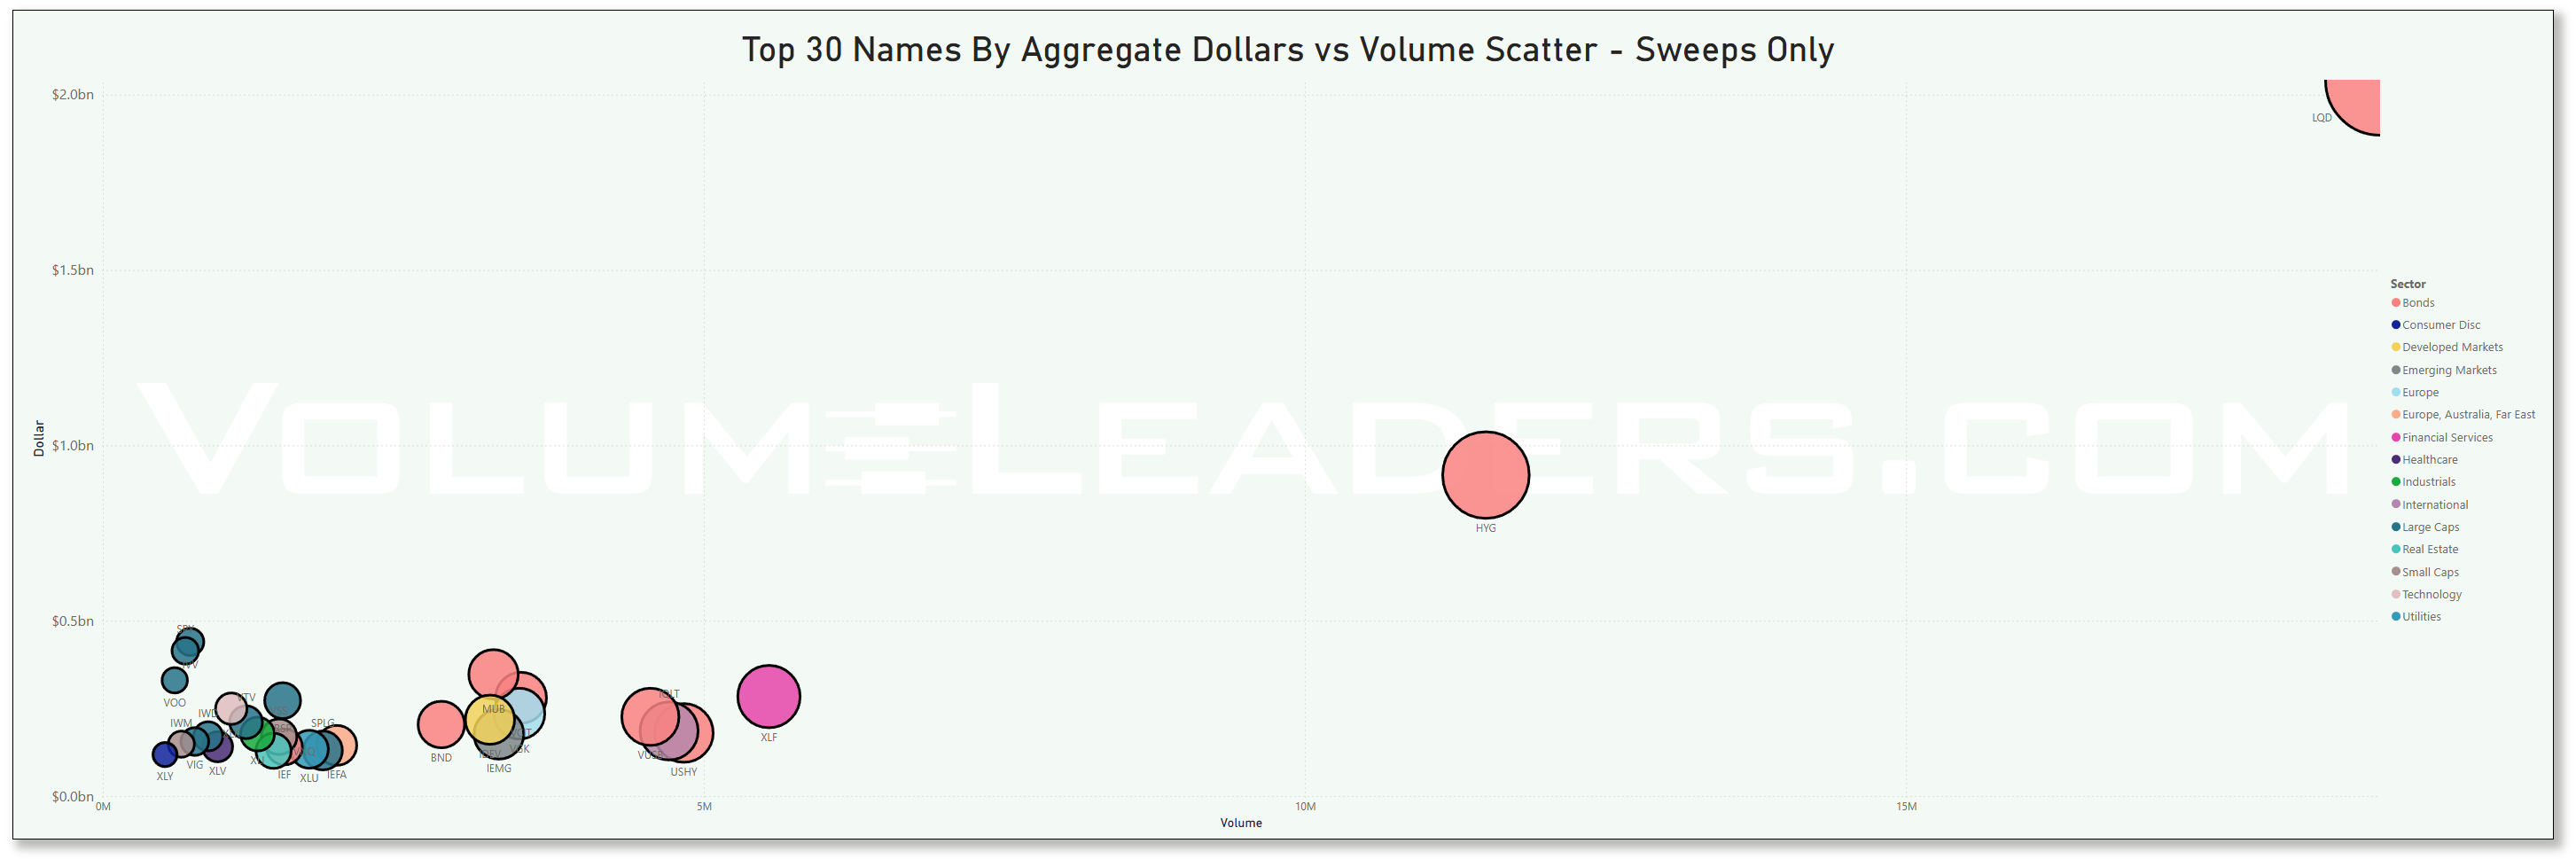
Many excellent trade ideas and sources of inspiration can be found in these prints below. While only the top 30 from each group are displayed, the complete results are accessible in VolumeLeaders.com for you to explore at your convenience any time. Remember to configure trade alerts within the platform to ensure institutional order flows that capture your interest or are significant to you aren’t missed. The blue charts encompass all types of trades, including blocks on lit exchanges; the purple charts exclusively depict dark pool trades; and the green charts represent sweeps only.
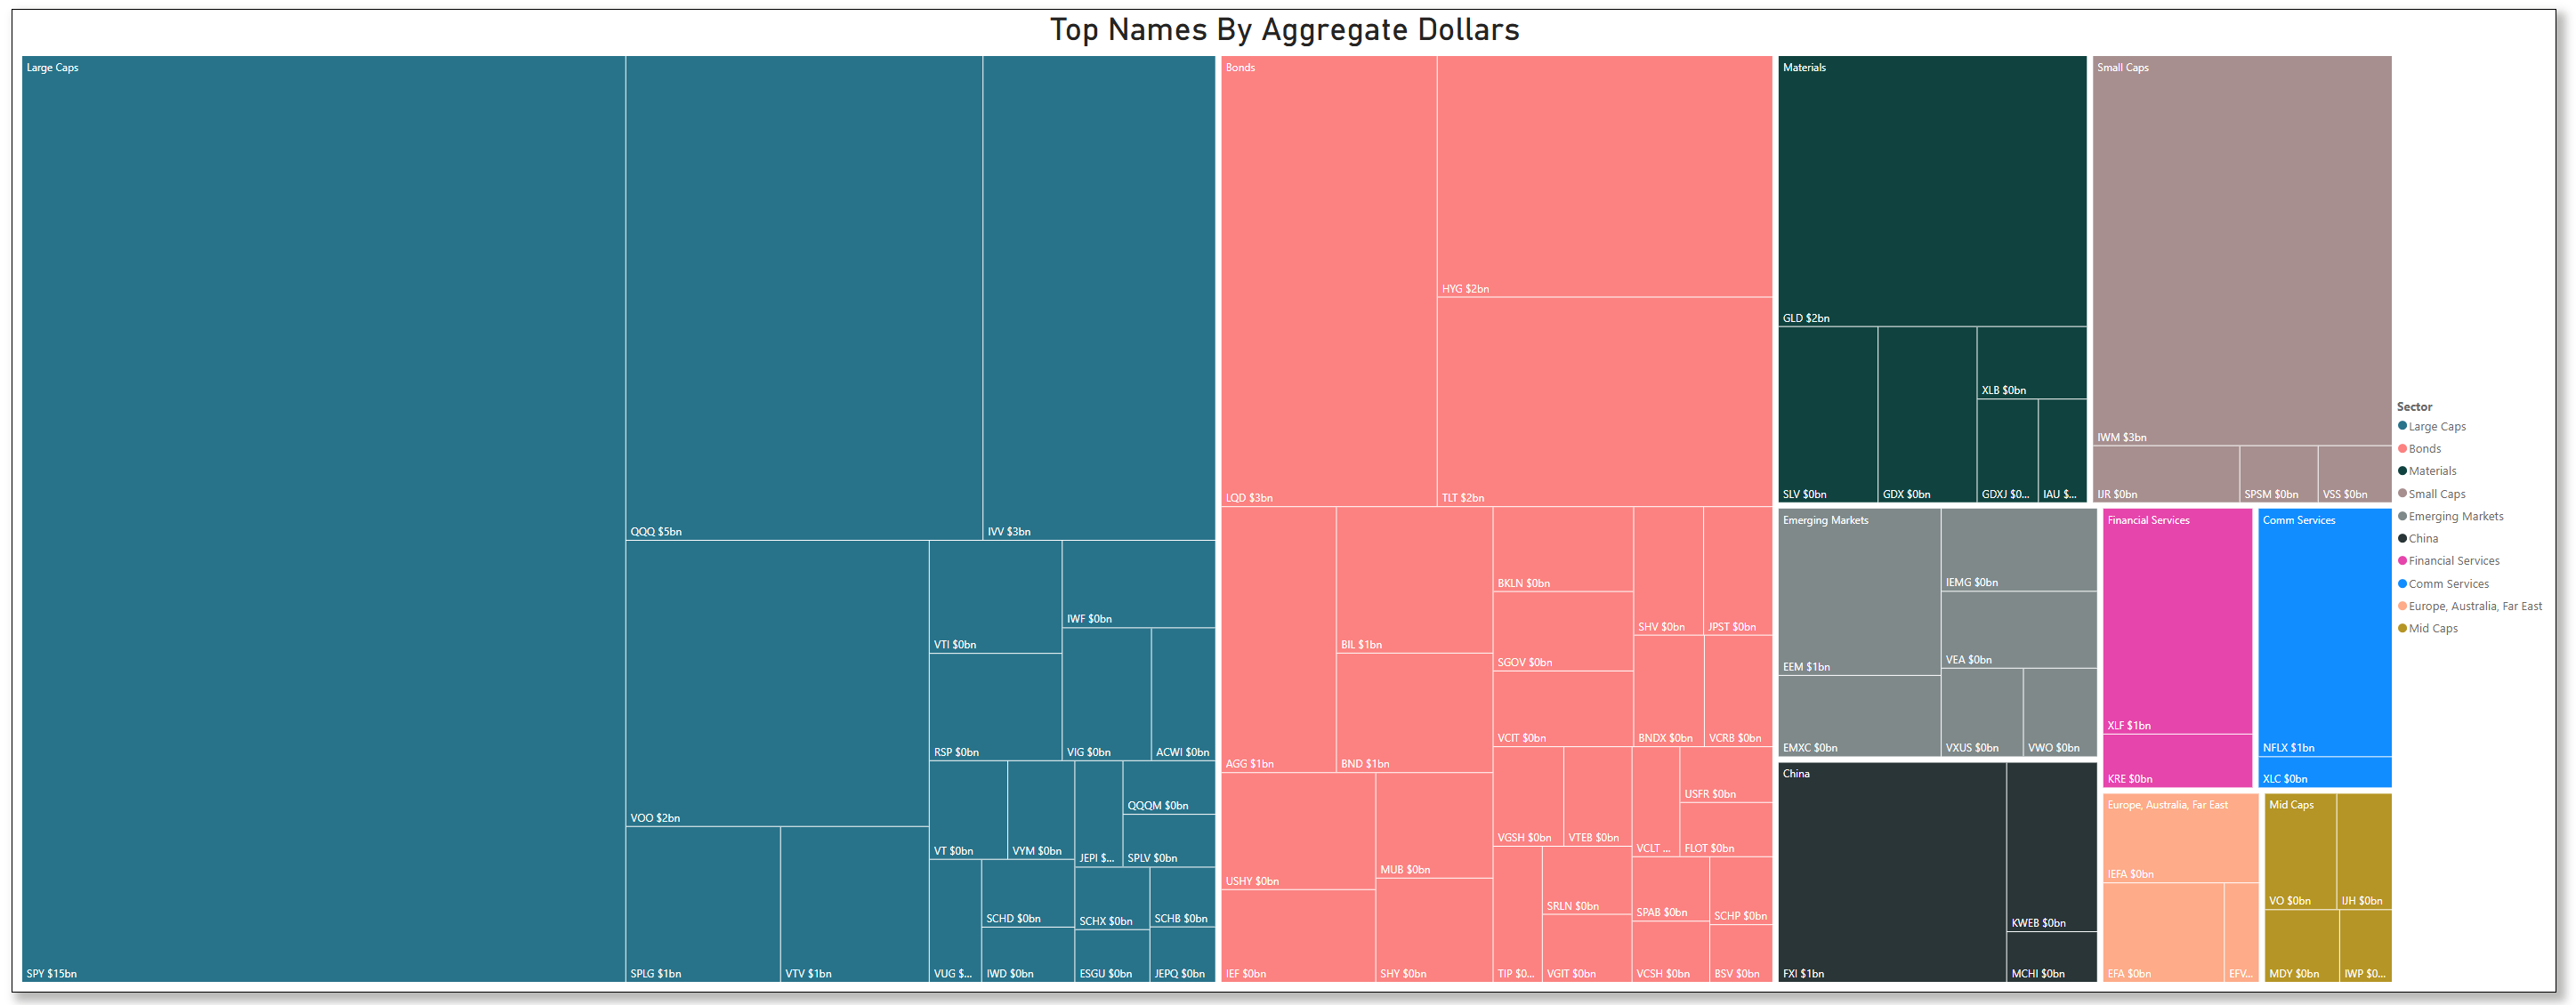
Top Institutional Order Flow In Individual Names By Trade-Type For ETFs
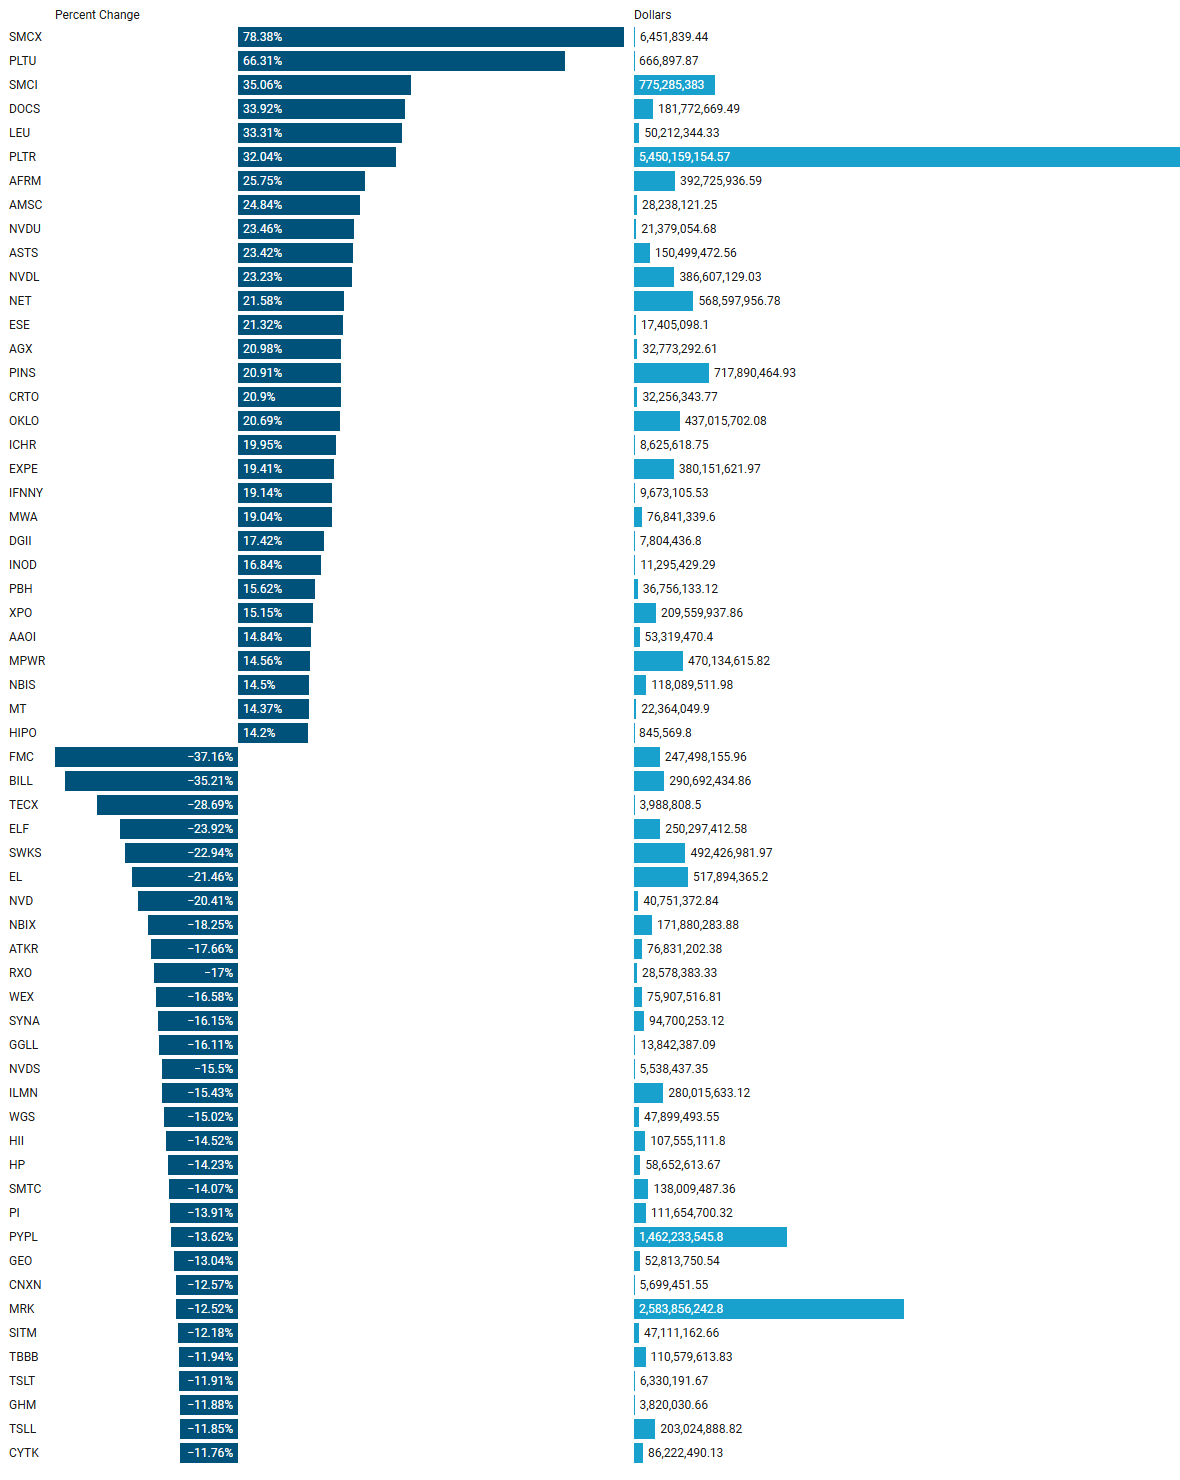
Last Week’s Institutionally-Backed Gainers & Losers
If you’re going to bet on a name, consider one that is officially endorsed by an institution! These are the top percent gainers (green) and percent losers (red) from this week’s open-to-close that had a trade price greater than $20 and institutional involvement. Continue watching tickers from this and prior stacks as these names frequently turn into multi-leg trades with a lot of movement!
Last Week’s Billion-Dollar Prints
Tickers that printed a trade worth at least $1B last week get a special shout-out… Welcome to the club. These are massive commitments by institutions that should not be ignored.
[ Rare no-results week for Billion-Dollar Prints]
Investments In Focus: Bull vs Bear Arguments
Institutions leave footprints that VolumeLeaders.com can illustrate for you while providing context to assess things like institutional conviction and urgency. Theses and data given below are not financial advice, just personal observations that may be wrong; consult a certified financial advisor before making any investment decisions.
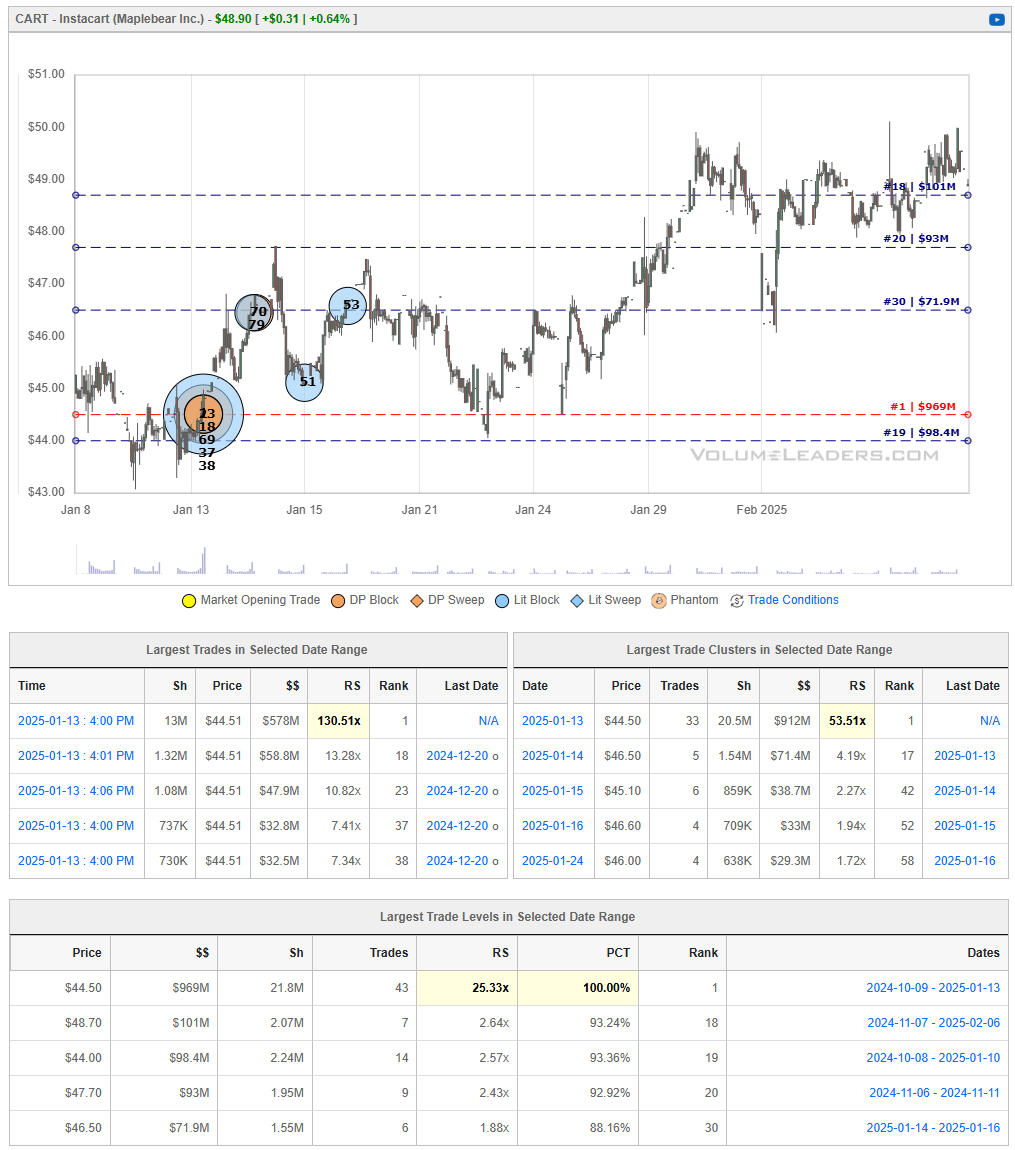
CART 0.00%↑
Maplebear Inc., doing business as Instacart (NASDAQ: CART), is a leading grocery technology company in the United States and Canada. The company operates a platform connecting end users with personal shoppers who pick up and deliver groceries from local stores. Instacart partners with over 1,400 national, regional, and local retail banners, facilitating online shopping, delivery, and pickup services from more than 80,000 stores across North America.
Bullish Perspective:
Market Leadership: Instacart has established itself as a dominant player in the online grocery delivery market, benefiting from the growing consumer preference for convenience and home delivery services.
Strategic Partnerships: The company's extensive network of retail partners enhances its market reach and provides a competitive advantage in offering a wide selection of products to consumers.
Revenue Growth: Instacart has demonstrated significant revenue growth, driven by increased demand for online grocery shopping and successful expansion of its services.
Bearish Perspective:
Profitability Concerns: Despite revenue growth, Instacart faces challenges in achieving consistent profitability due to high operational costs and competitive pricing pressures.
Competitive Market: The online grocery delivery sector is highly competitive, with numerous players vying for market share, which could impact Instacart's growth prospects and margins.
Regulatory Risks: Changes in labor laws and regulations, particularly concerning the classification of gig economy workers, could increase operational costs and affect the company's business model.
In summary, Instacart's strong market position and strategic partnerships position it well for future growth. However, investors should be mindful of profitability challenges, intense competition, and potential regulatory risks when evaluating the company's prospects.
MCD 0.00%↑
McDonald's Corporation (NYSE: MCD) is a global leader in the fast-food industry, known for its extensive menu and widespread presence.
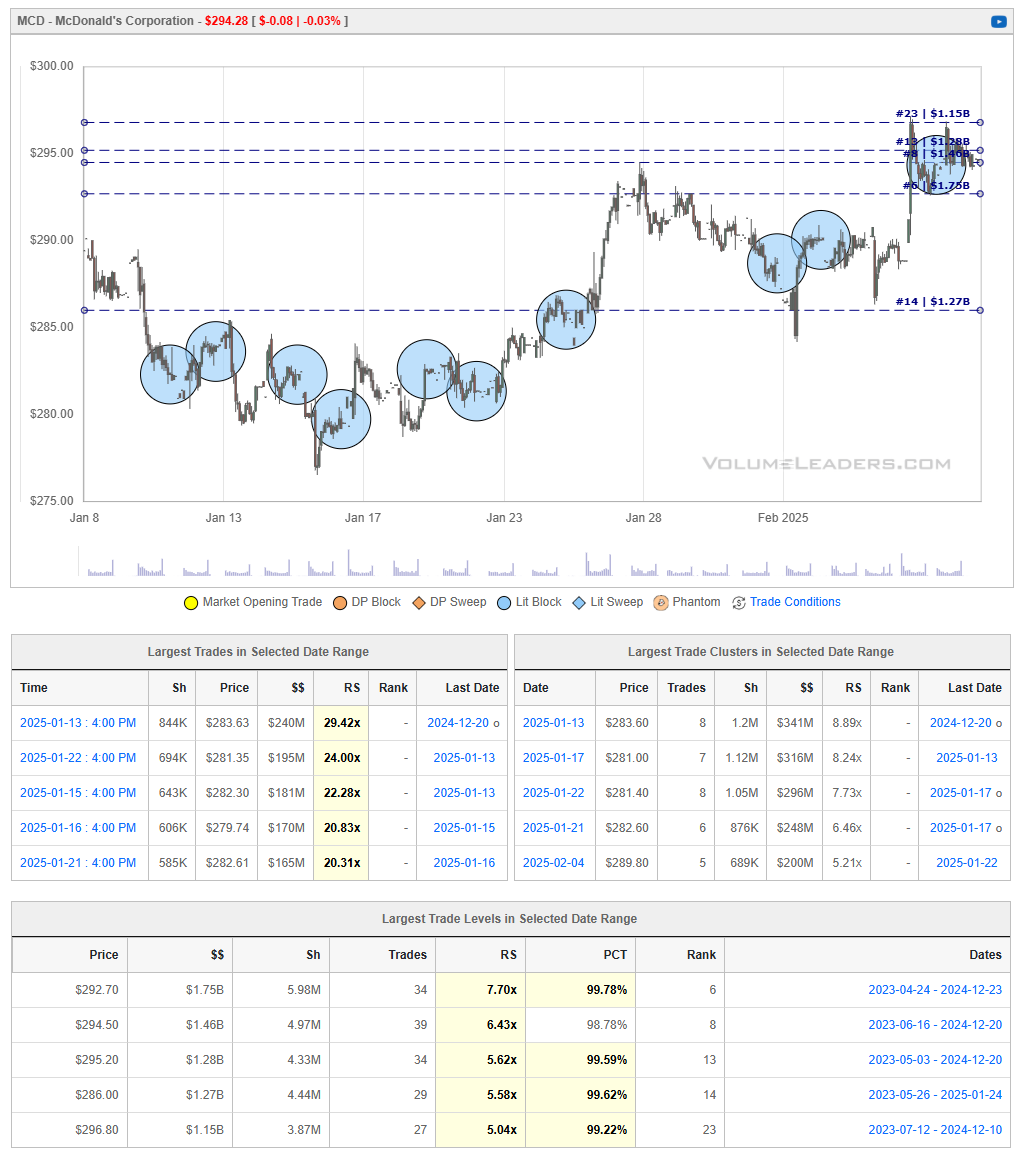
Bullish Perspective:
Analyst Optimism: Analysts maintain a favorable outlook on McDonald's stock, with a consensus "Buy" rating and an average 12-month price target of approximately $319.58, suggesting potential upside from the current price.
Strategic Value Offerings: The introduction of the $5 value meal has been successful in attracting customers, contributing to a rebound in sales.
Dividend Growth: McDonald's has a history of returning value to shareholders through dividends, recently increasing its quarterly dividend by 6% to $1.77 per share.
Bearish Perspective:
Recent Challenges: The company faced an E. coli outbreak linked to certain ingredients, which impacted sales and raised concerns about food safety.
Economic Sensitivity: Inflation and economic pressures have led to reduced consumer spending, affecting same-store sales as customers opt to dine out less frequently.
Competitive Market: The fast-food industry is highly competitive, and McDonald's must continually innovate to maintain its market share against emerging and established competitors.
In summary, McDonald's demonstrates resilience through strategic value initiatives and consistent dividend growth. However, investors should remain mindful of recent challenges and the broader economic environment when evaluating the stock.
ASTS -0.26%↓
AST SpaceMobile, Inc. (NASDAQ: ASTS) is a technology company focused on building the first space-based cellular broadband network, aiming to provide mobile connectivity directly to standard smartphones without the need for ground-based infrastructure.
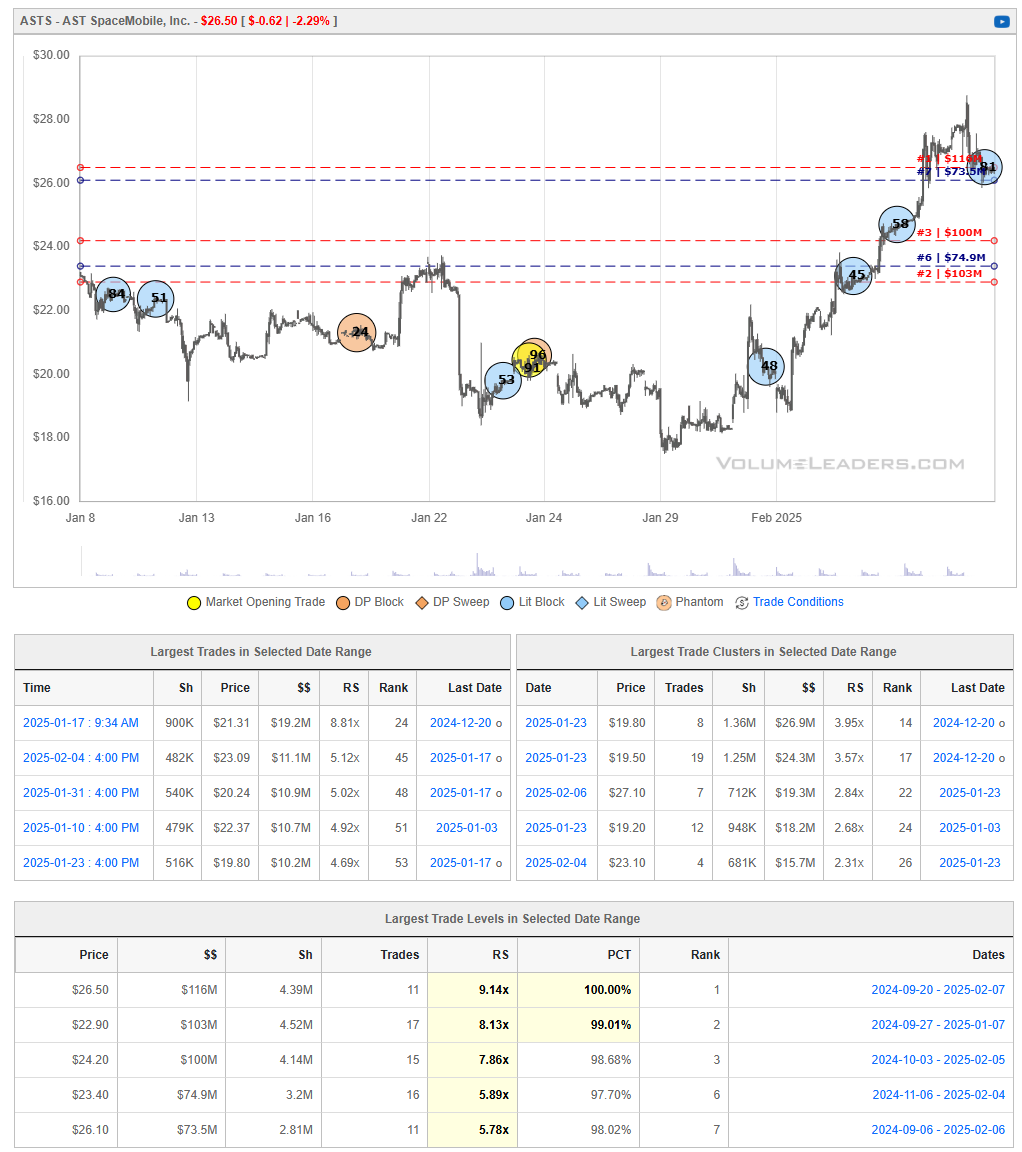
Bullish Perspective:
Innovative Technology: AST SpaceMobile is pioneering a satellite network designed to connect directly to unmodified mobile devices, potentially revolutionizing global connectivity by eliminating coverage gaps, especially in remote areas.
Strategic Partnerships: The company has secured significant agreements, including a long-term contract with Vodafone to provide space-based cellular broadband across Europe and Africa through 2034.
Analyst Optimism: Analysts have a consensus "Strong Buy" rating on ASTS, with a 12-month average price target of $33.73, suggesting potential upside from the current price.
Successful Satellite Deployments: In September 2024, AST SpaceMobile successfully launched its first five commercial satellites, marking a significant milestone in deploying its planned low Earth orbit constellation.
Financial Backing: The company has attracted investments from major entities, including AT&T, Verizon, and Google, indicating strong industry confidence in its business model and technological capabilities.
Bearish Perspective:
Financial Losses: In Q3 2024, AST SpaceMobile reported a net loss of $171.95 million, or $1.10 per share, significantly wider than the previous year's loss of $20.91 million, or $0.23 per share.
High Volatility: The stock has exhibited substantial volatility, with a 52-week range between $1.97 and $39.08, indicating potential risk for investors.
Technological Challenges: Developing a space-based cellular network involves overcoming significant technical hurdles, including ensuring reliable connectivity and managing the complexities of satellite operations.
Competitive Landscape: The company faces competition from established players like SpaceX's Starlink and initiatives by major tech companies, which could impact its market share and growth prospects.
Capital Expenditure Requirements: Building and deploying a satellite constellation is capital-intensive, and the company may require additional funding to achieve its objectives, potentially leading to dilution of existing shares or increased debt.
In summary, AST SpaceMobile presents a compelling vision for global connectivity through its innovative satellite technology and has garnered significant partnerships and analyst support. However, investors should carefully consider the company's financial performance, stock volatility, technological challenges, and competitive environment when evaluating its investment potential.
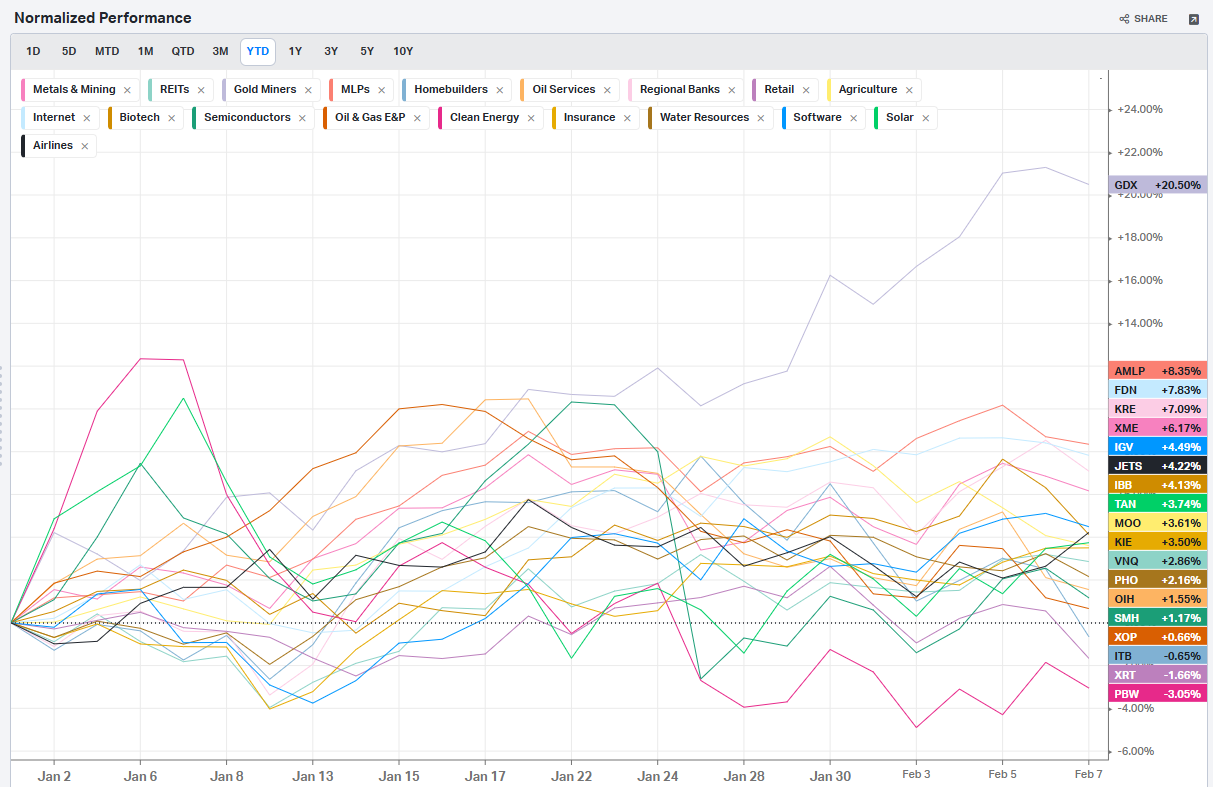
Summary Of Thematic Performance YTD
VolumeLeaders.com provides a lot of pre-built filters for thematics so that you can quickly dive into specific areas of the market. These performance overviews are provided here only for inspiration. Consider targeting leaders and/or laggards in the best and worst sectors, for example.
S&P By Sector

S&P By Industry
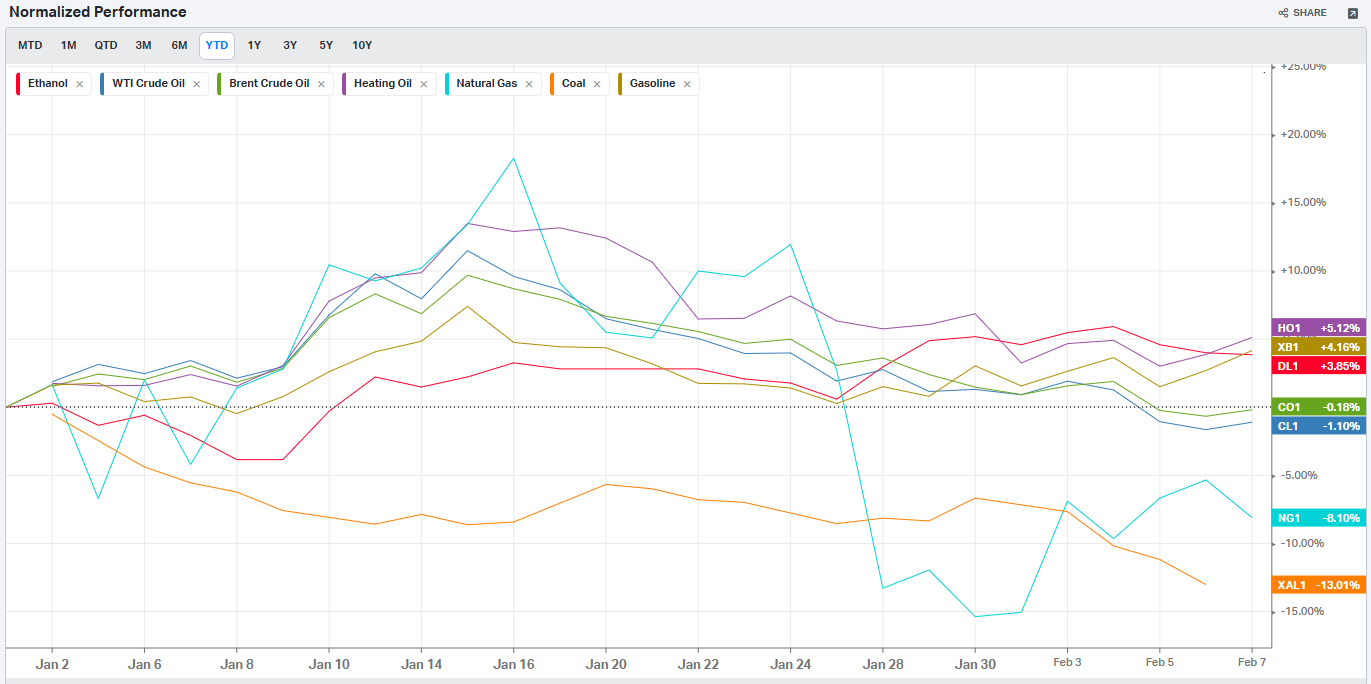
Commodities: Energy
Commodities: Metals
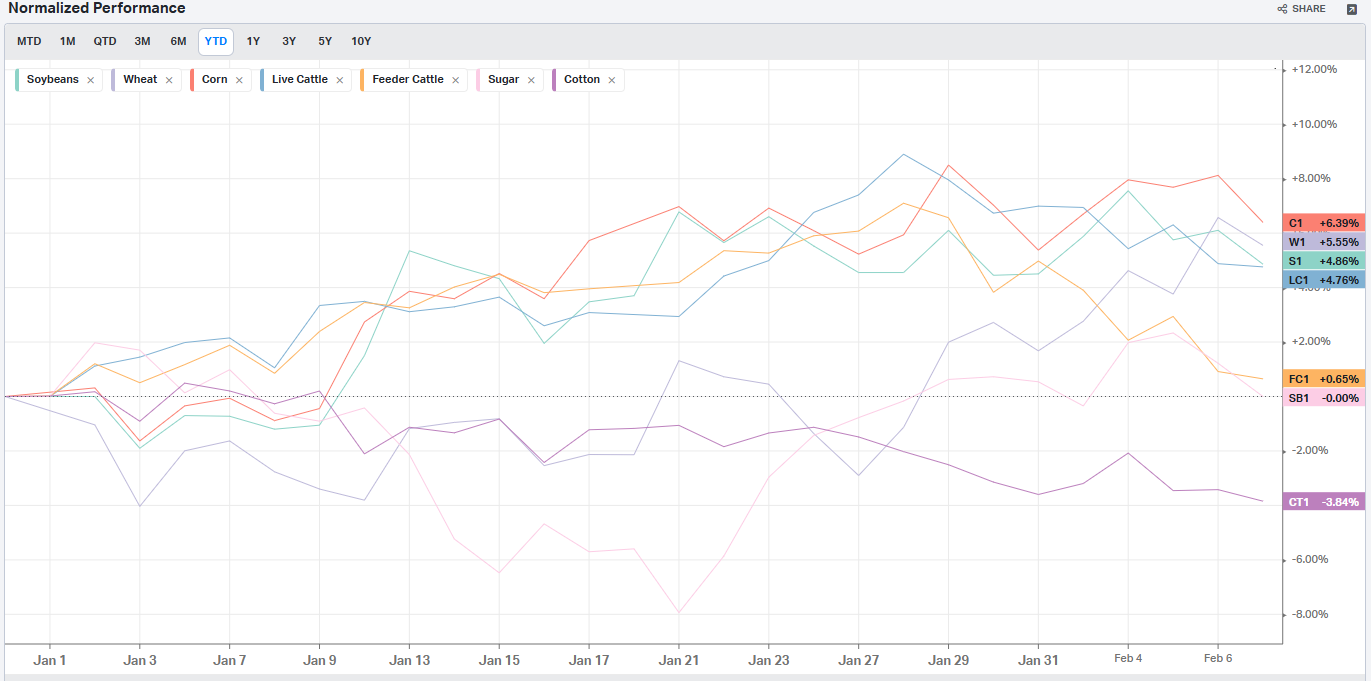
Commodities: Agriculture
Country ETFs
Currencies
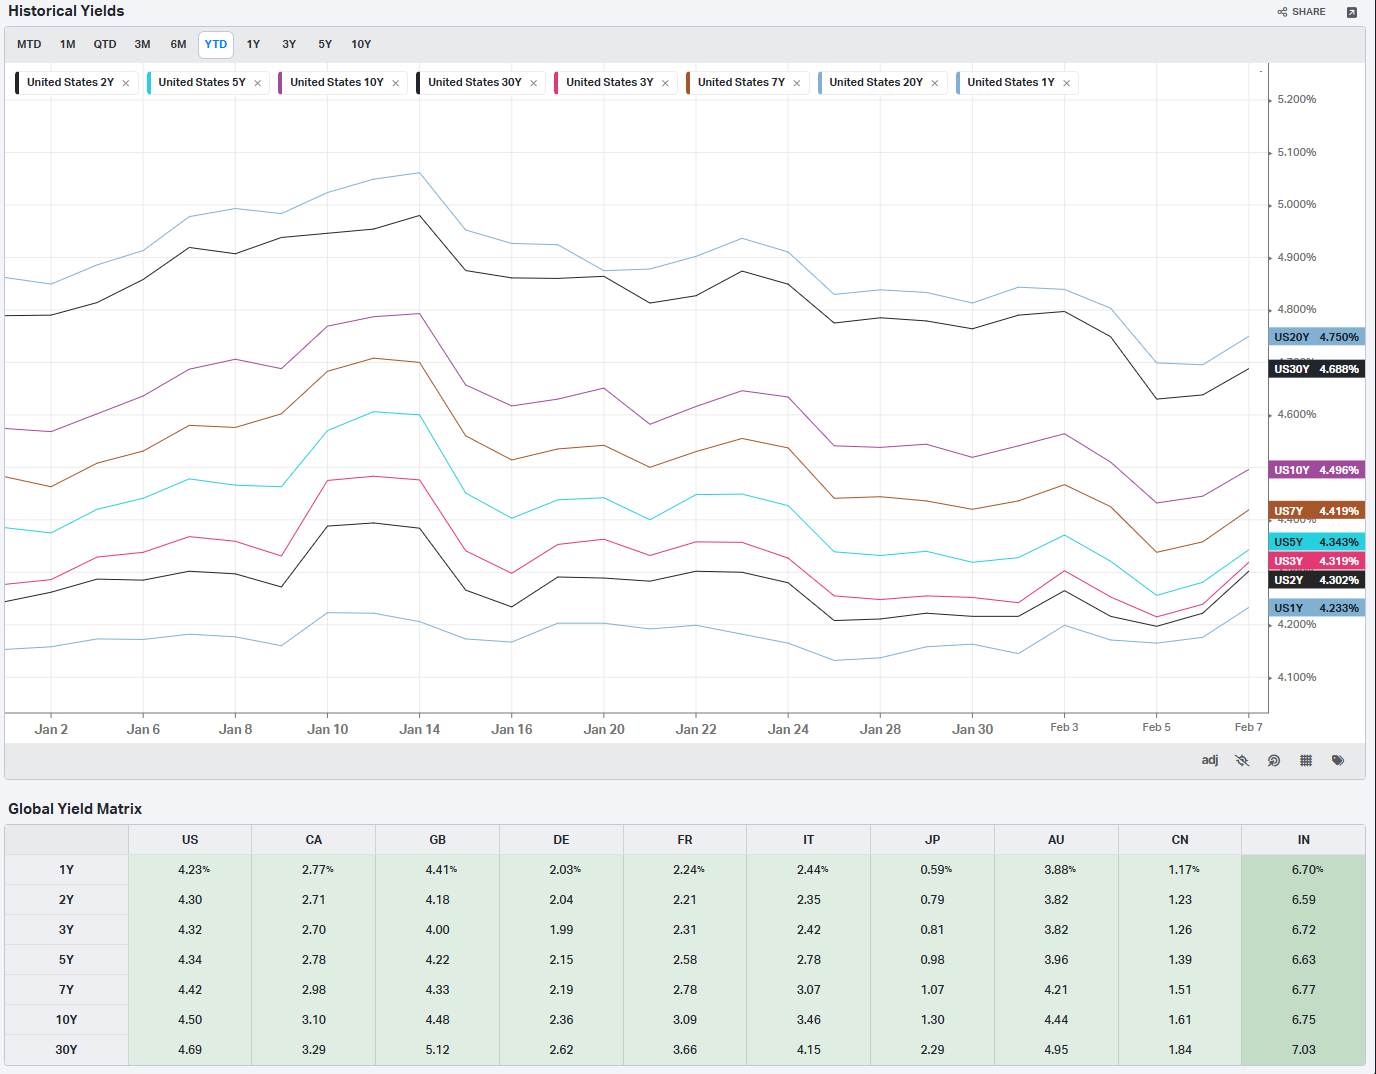
Global Yields
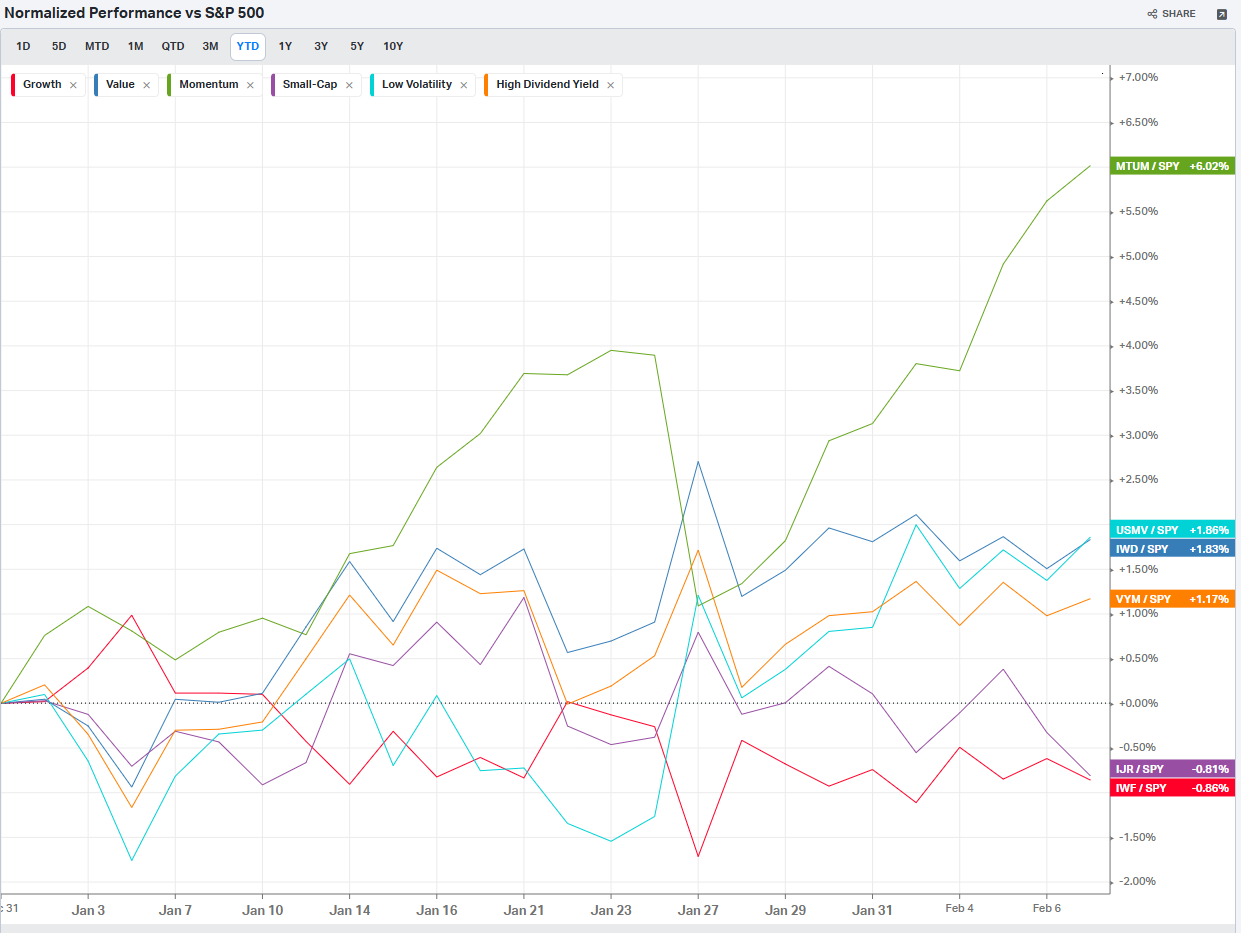
Factors: Style
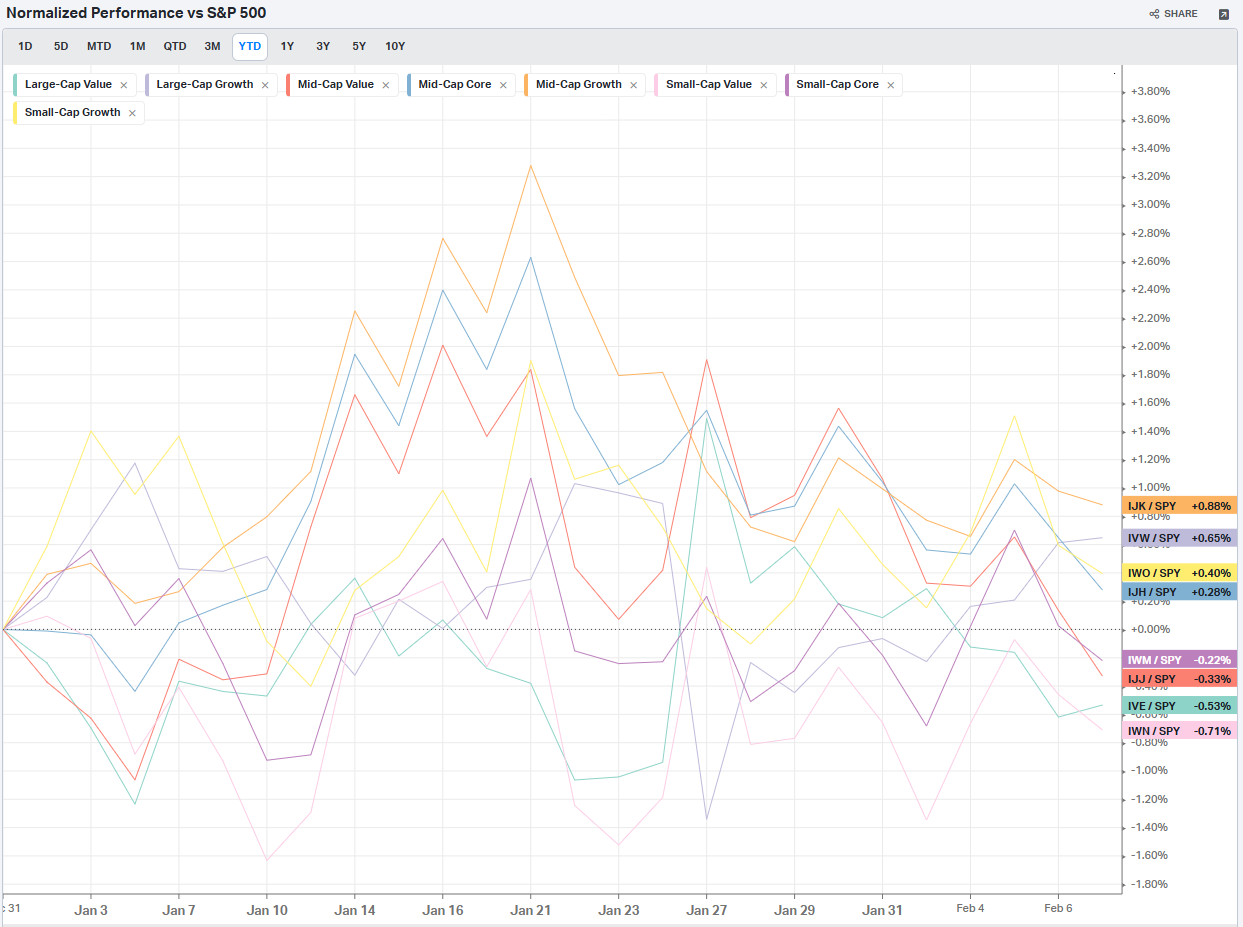
Factors: Size vs Value
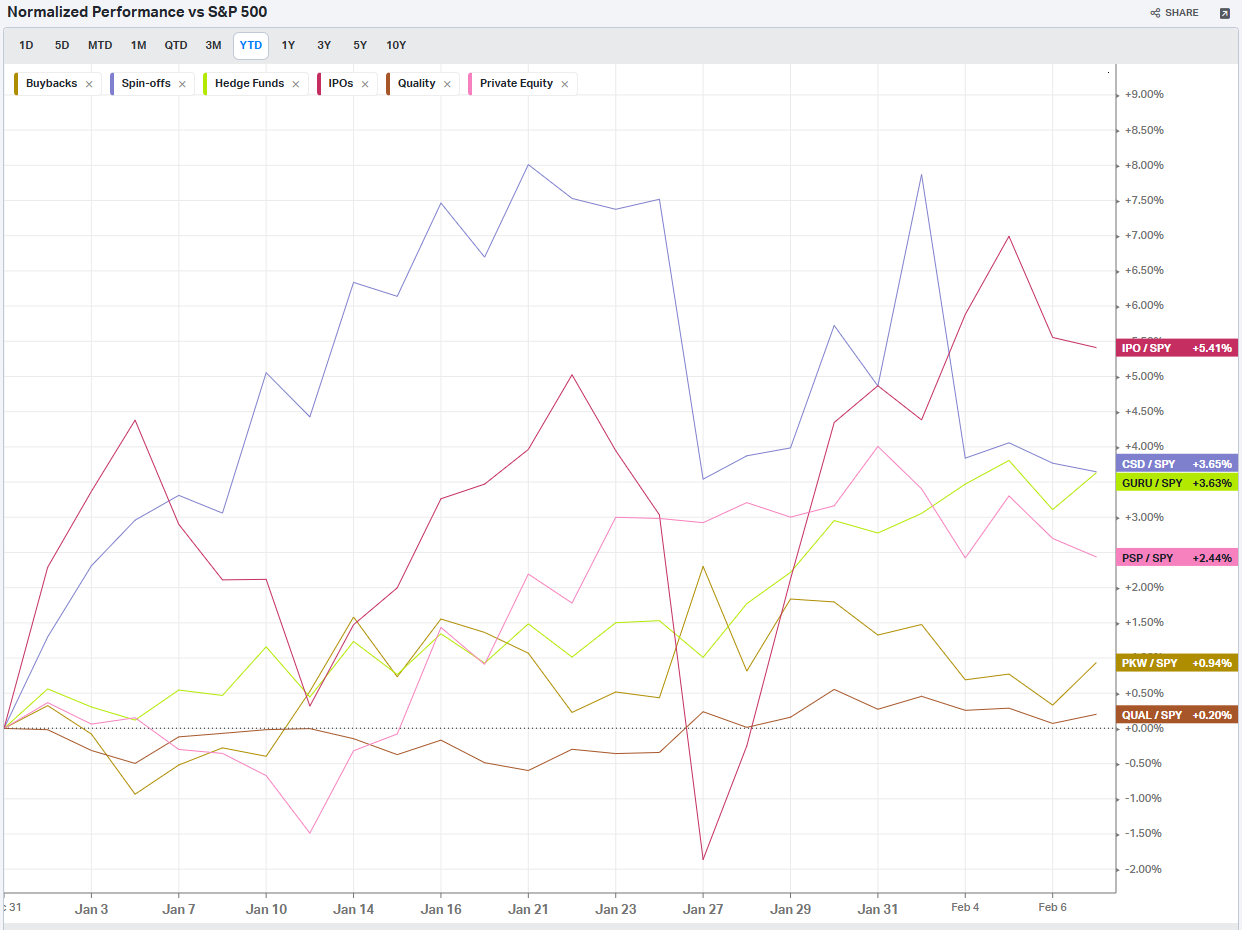
Factors: Qualitative
Social Media Favs
Analyzing social sentiment can provide valuable insights for investment strategies by offering a pulse on public perception, mood, and market sentiment that traditional financial indicators might not capture. Here’s how social sentiment analysis can enhance investment decisions:
Market Momentum: Positive or negative social sentiment can signal impending momentum shifts. When public opinion on a stock, sector, or asset class changes sharply, it can create buying or selling pressure, especially if that sentiment becomes widespread.
Early Detection of Trends: Social sentiment data can help investors spot trends before they show up in technical or fundamental data. For example, increased positive chatter around a particular company or sector might indicate growing interest or excitement, which could lead to price appreciation.
Gauge Retail Investor Impact: With the rise of retail investor platforms, collective sentiment on social media can lead to significant price movements (e.g., meme stocks). Understanding how retail investors view certain stocks can help in identifying high-volatility opportunities.
Event Reaction Monitoring: Social sentiment can provide real-time reactions to news events, product releases, or earnings reports. Investors can use this information to gauge market reaction quickly and adjust their strategies accordingly.
Complementing Quantitative Models: By adding a social sentiment layer to quantitative models, investors can enhance predictions. For example, a model that tracks historical price and volume data might perform even better when factoring in sentiment trends as a measure of market psychology.
Risk Management: Negative sentiment spikes can be a signal of potential downturns or increased volatility. By monitoring sentiment, investors might avoid or hedge against investments in companies experiencing a public relations crisis or facing negative perceptions.
Long-Term Sentiment Trends: Sustained sentiment trends, whether positive or negative, often mirror longer-term market cycles. Tracking sentiment trends over time can help identify shifts in investor psychology that could affect longer-term investments or sector rotations.
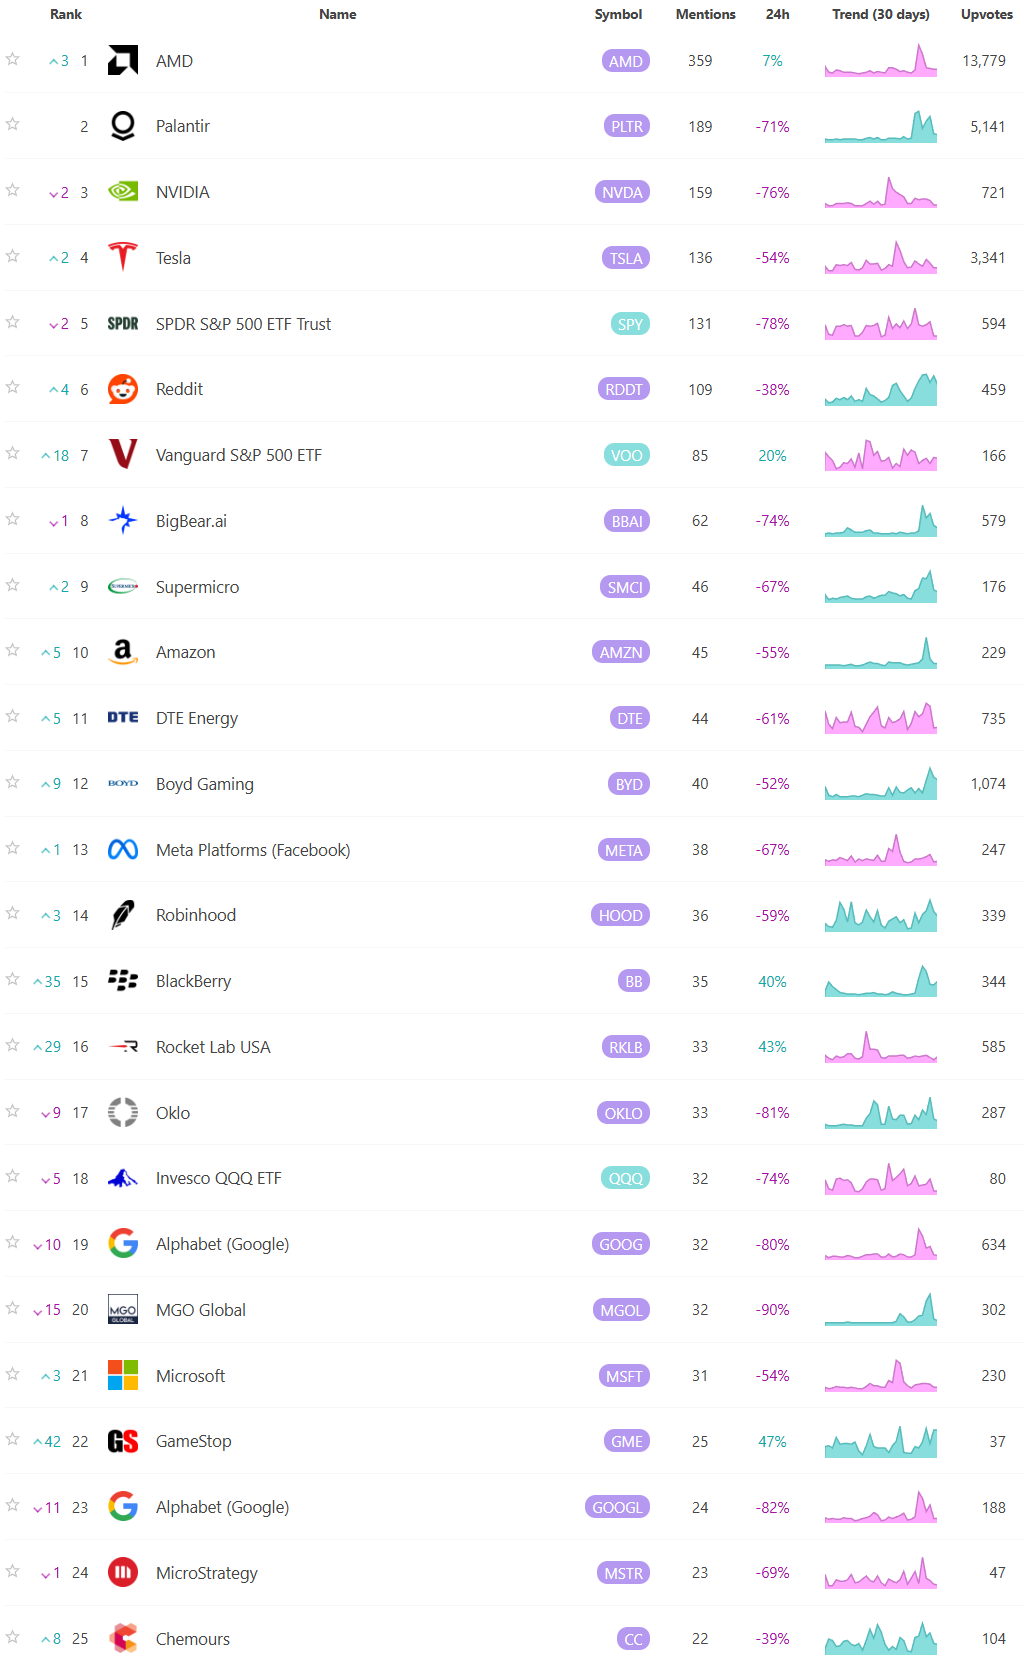
For these reasons, sentiment analysis, when combined with other tools, can provide a comprehensive view of both immediate market reactions and underlying investor attitudes, helping investors position themselves strategically across various time frames. Here are the most mentioned/discussed tickers on Reddit from some of the most active Subreddits for trading:
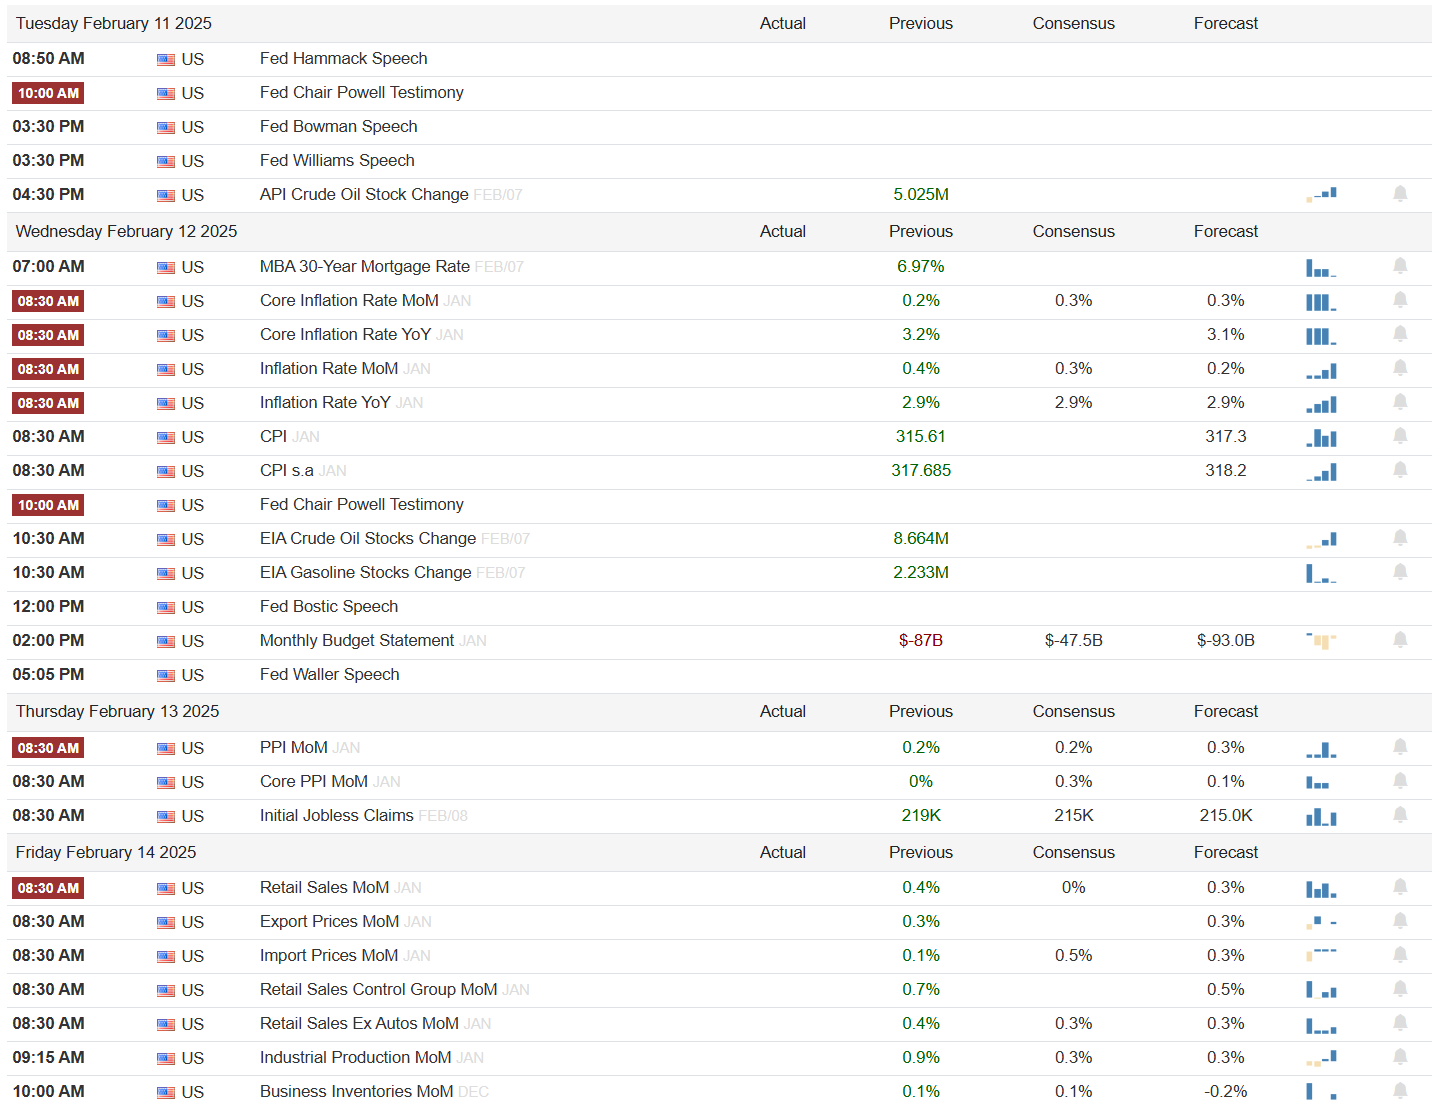
Events On Deck This Week
Here are key events happening this week that have the potential to cause outsized moves in the market or heightened short-term volatility.
Econ Events By Day of Week
Anticipated Earnings By Day of Week

Thank you for being part of our community and for taking the time to read this publication. Your engagement and insights mean a great deal to all of us, and we're genuinely grateful to share this space with such dedicated and thoughtful readers. Wishing you a productive and successful week ahead in the markets. May the coming days bring clarity and great opportunities. Happy trading!