Market Momentum: Your Weekly Financial Forecast & Market Prep
Issue 33 / What to expect Feb 17, 2025 thru Feb 21, 2025
In This Issue
Market-On-Close: All of last week’s market-moving news and macro context in under 5 minutes + futures-snapshots
Special Coverage: Are US Financial Markets Topping, or Are We Entering a New Economic Paradigm?
The Latest Investor Sentiment Readings
Institutional Support & Resistance Levels For Major Indices: Exactly where to look for support and resistance this week in SPY, QQQ, IWM & DIA
Institutional Activity By Sector: Institutional order flow by sector including the top institutionally-backed names in those sectors. We break it all down and provide the key insights and take-aways you need to navigate institutional positioning this week.
Top Institutional Order Flow In Individual Names: All of the largest sweeps and blocks on lit exchanges and hidden dark pools
Investments In Focus: Bull vs Bear arguments for SAND, NET, MAT
Top Institutionally-Backed Gainers & Losers: An explosive watchlist for day traders seeking high-volatility
Normalized Performance By Thematics YTD (Sector, Industry, Factor, Energy, Metals, Currencies, and more): which corners of the markets are beating benchmarks, which ones are overlooked and which ones are over-crowded
Key Econ Events and Earnings On-Deck For This Week

Market-On-Close
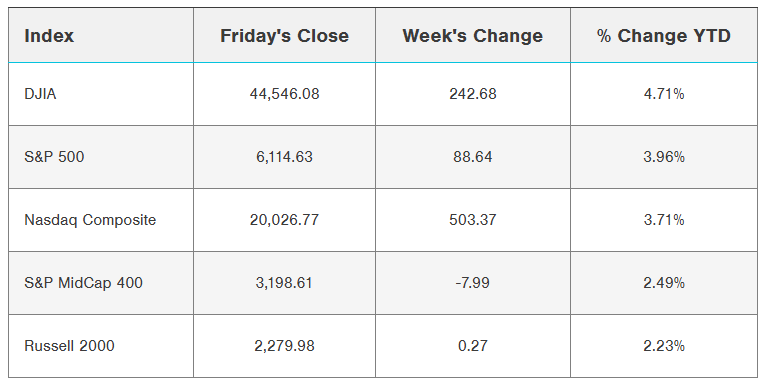
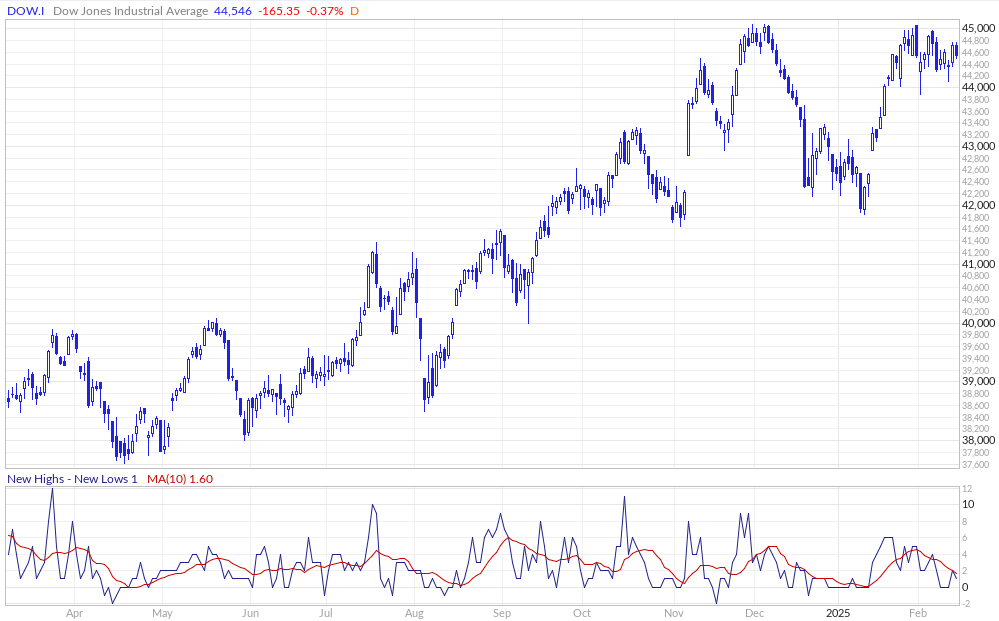
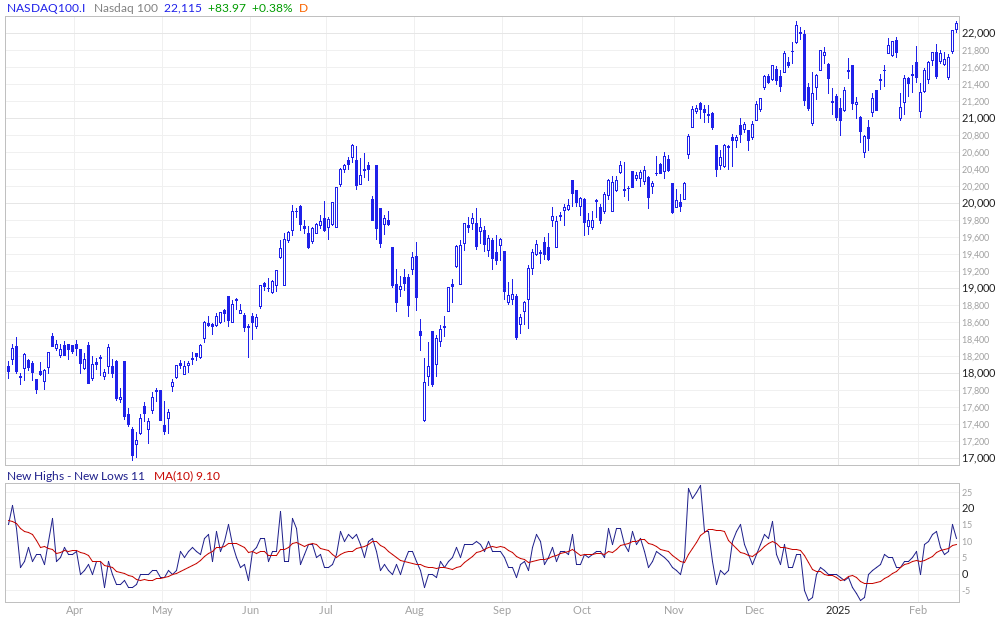
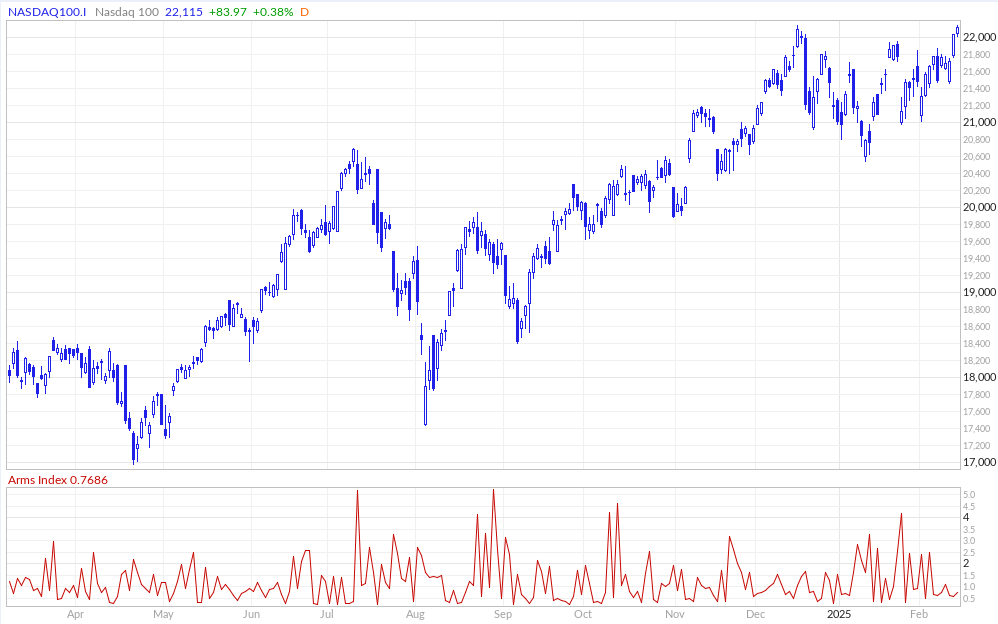
The U.S. financial markets navigated a complex landscape last week, characterized by shifting monetary policy expectations, surprising economic data, and evolving trade policy considerations. The headline indices painted a picture of measured stability masking significant underlying crosscurrents. While the S&P 500 Index showed minimal movement with a decline of just 0.01%, the Dow Jones Industrial Average registered a more notable drop of 0.37%. The Nasdaq 100 emerged as the relative winner, advancing 0.38% amid continued enthusiasm for technology and growth stocks.
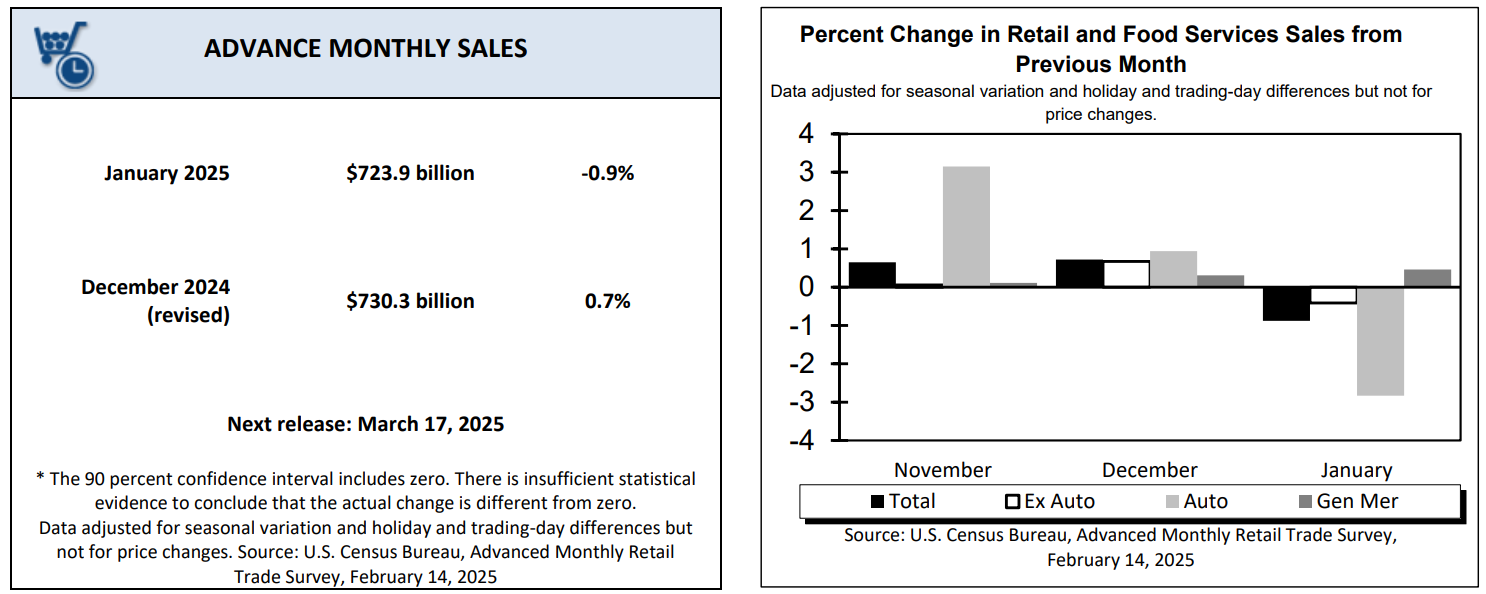
The week's narrative was largely shaped by January's retail sales report, which revealed unexpected weakness in consumer spending. The headline figure showed a decline of 0.9% month-over-month, significantly underperforming expectations of a 0.2% decrease. Even when excluding volatile components like automobile sales, the picture remained concerning, with ex-auto sales falling 0.4% against projections of a 0.3% increase. The control group, which feeds directly into GDP calculations, registered an especially disappointing 0.8% decline. However, these figures require careful interpretation given the extraordinary circumstances affecting January's retail environment, including wildfires in California and severe weather events across multiple regions. Additionally, December's figures saw an upward revision from 0.4% to 0.7%, suggesting the underlying trend in consumer spending may be stronger than the January headline suggests.
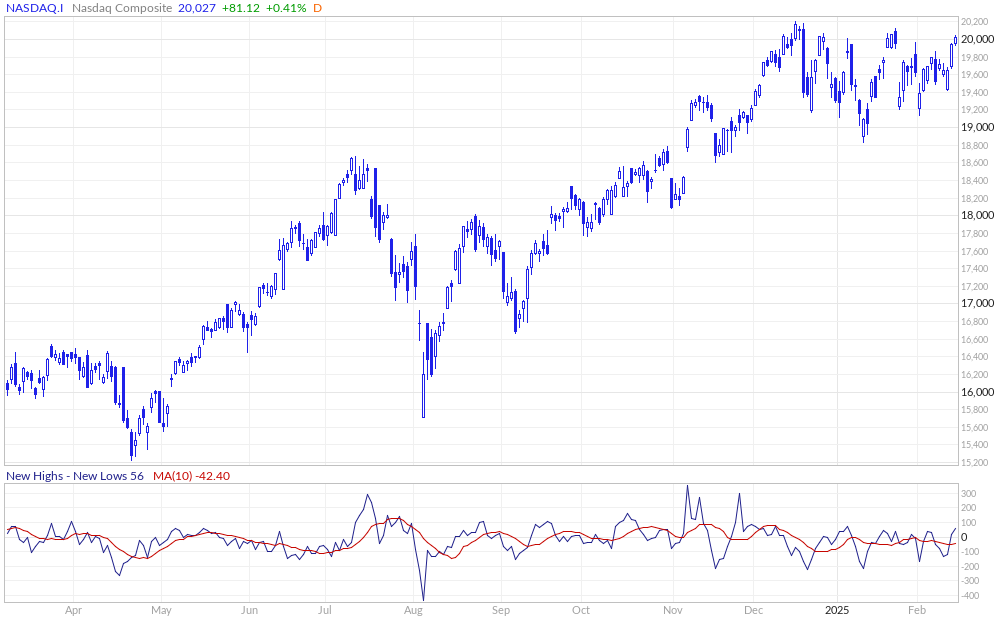
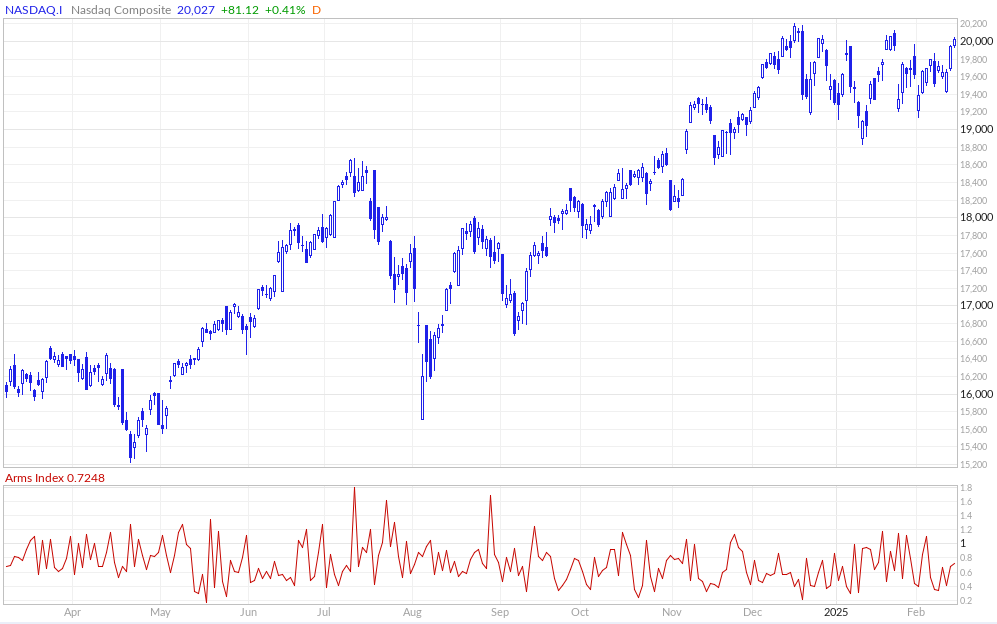
The week's trading dynamics brought both the Nasdaq Composite and S&P 500 within striking distance of their all-time highs, with both indices closing the week within 1% of record territory. This proximity to historic peaks is particularly noteworthy given the headwinds facing the market, including persistent inflation concerns and evolving trade policy uncertainties. The Nasdaq Composite demonstrated particular strength, advancing 2.58% for the week and highlighting the continued appetite for technology and growth stocks despite their recent challenges.
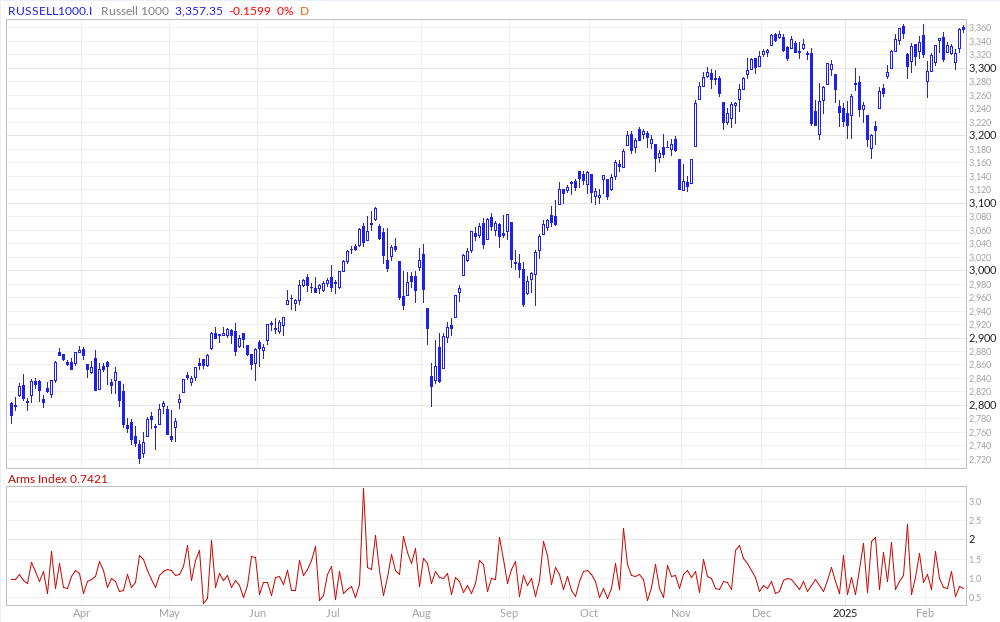
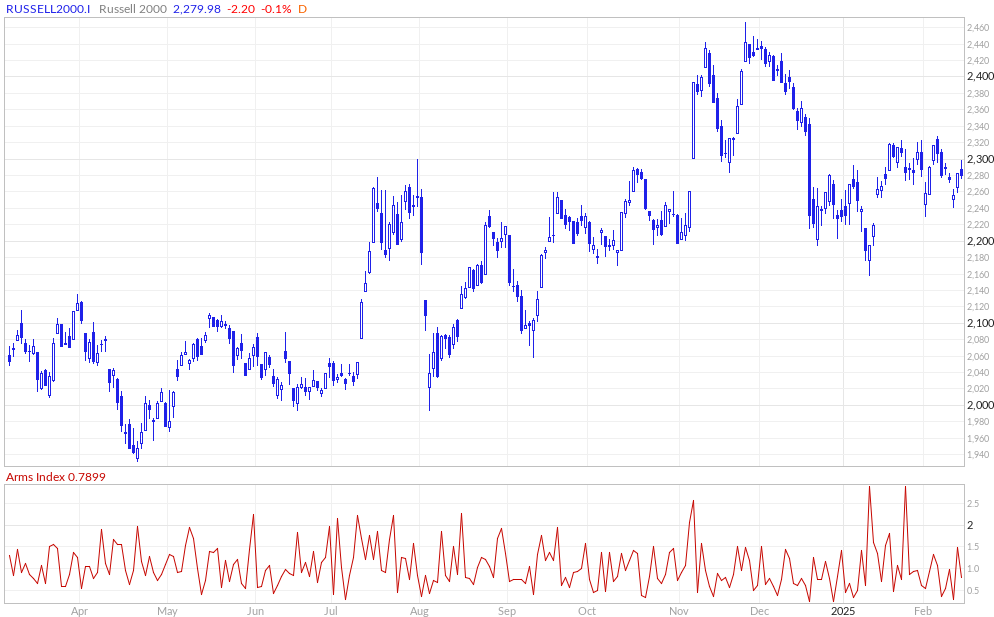
A significant shift in market leadership has begun to emerge, particularly evident in the performance divergence between growth and value stocks. Growth shares outperformed their value counterparts for the second week this year, as measured by Russell indexes. However, this rotation has not extended to all market segments, as small-cap stocks, tracked by the Russell 2000 Index, notably lagged their large-cap peers, falling behind the S&P 500 by 146 basis points over the week.
The fixed income markets provided another crucial element of the week's financial narrative. Treasury yields exhibited notable volatility, with the benchmark 10-year yield ultimately declining 5.1 basis points to 4.478%, building on the previous day's substantial drop of 9.4 basis points. This movement in yields reflected both the weak retail sales data and evolving expectations for Federal Reserve policy. The European bond market told a somewhat different story, with the German 10-year bund yield rising 1.3 basis points to 2.431% and the UK 10-year gilt advancing 0.9 basis points to 4.500%.
The corporate earnings landscape continued to evolve as the fourth quarter reporting season entered its final stages. With more than 330 S&P 500 companies having reported, the overall picture remains largely positive, though with some notable nuances. The beat rate stands at 77.6%, tracking just slightly below the three-year average of 78.4%. More impressively, aggregate earnings growth has reached 17% year-over-year, substantially exceeding pre-season expectations of 12% growth. This outperformance suggests that despite various macroeconomic headwinds, corporate America has maintained its ability to deliver strong bottom-line results.
The story becomes more complex when examining the performance of the market's largest technology companies, collectively known as the Magnificent Seven. This influential group, comprising Apple, Microsoft, Amazon, Alphabet, Meta, NVIDIA, and Tesla, reported mixed results that point to a potential shift in market dynamics. While the group managed to deliver aggregate earnings growth of 25% for the quarter, their sales growth hit its slowest pace since 2022. This deceleration, combined with valuations running at a 35% premium to the broader index, has led to some questioning of the group's ability to maintain its market leadership position.

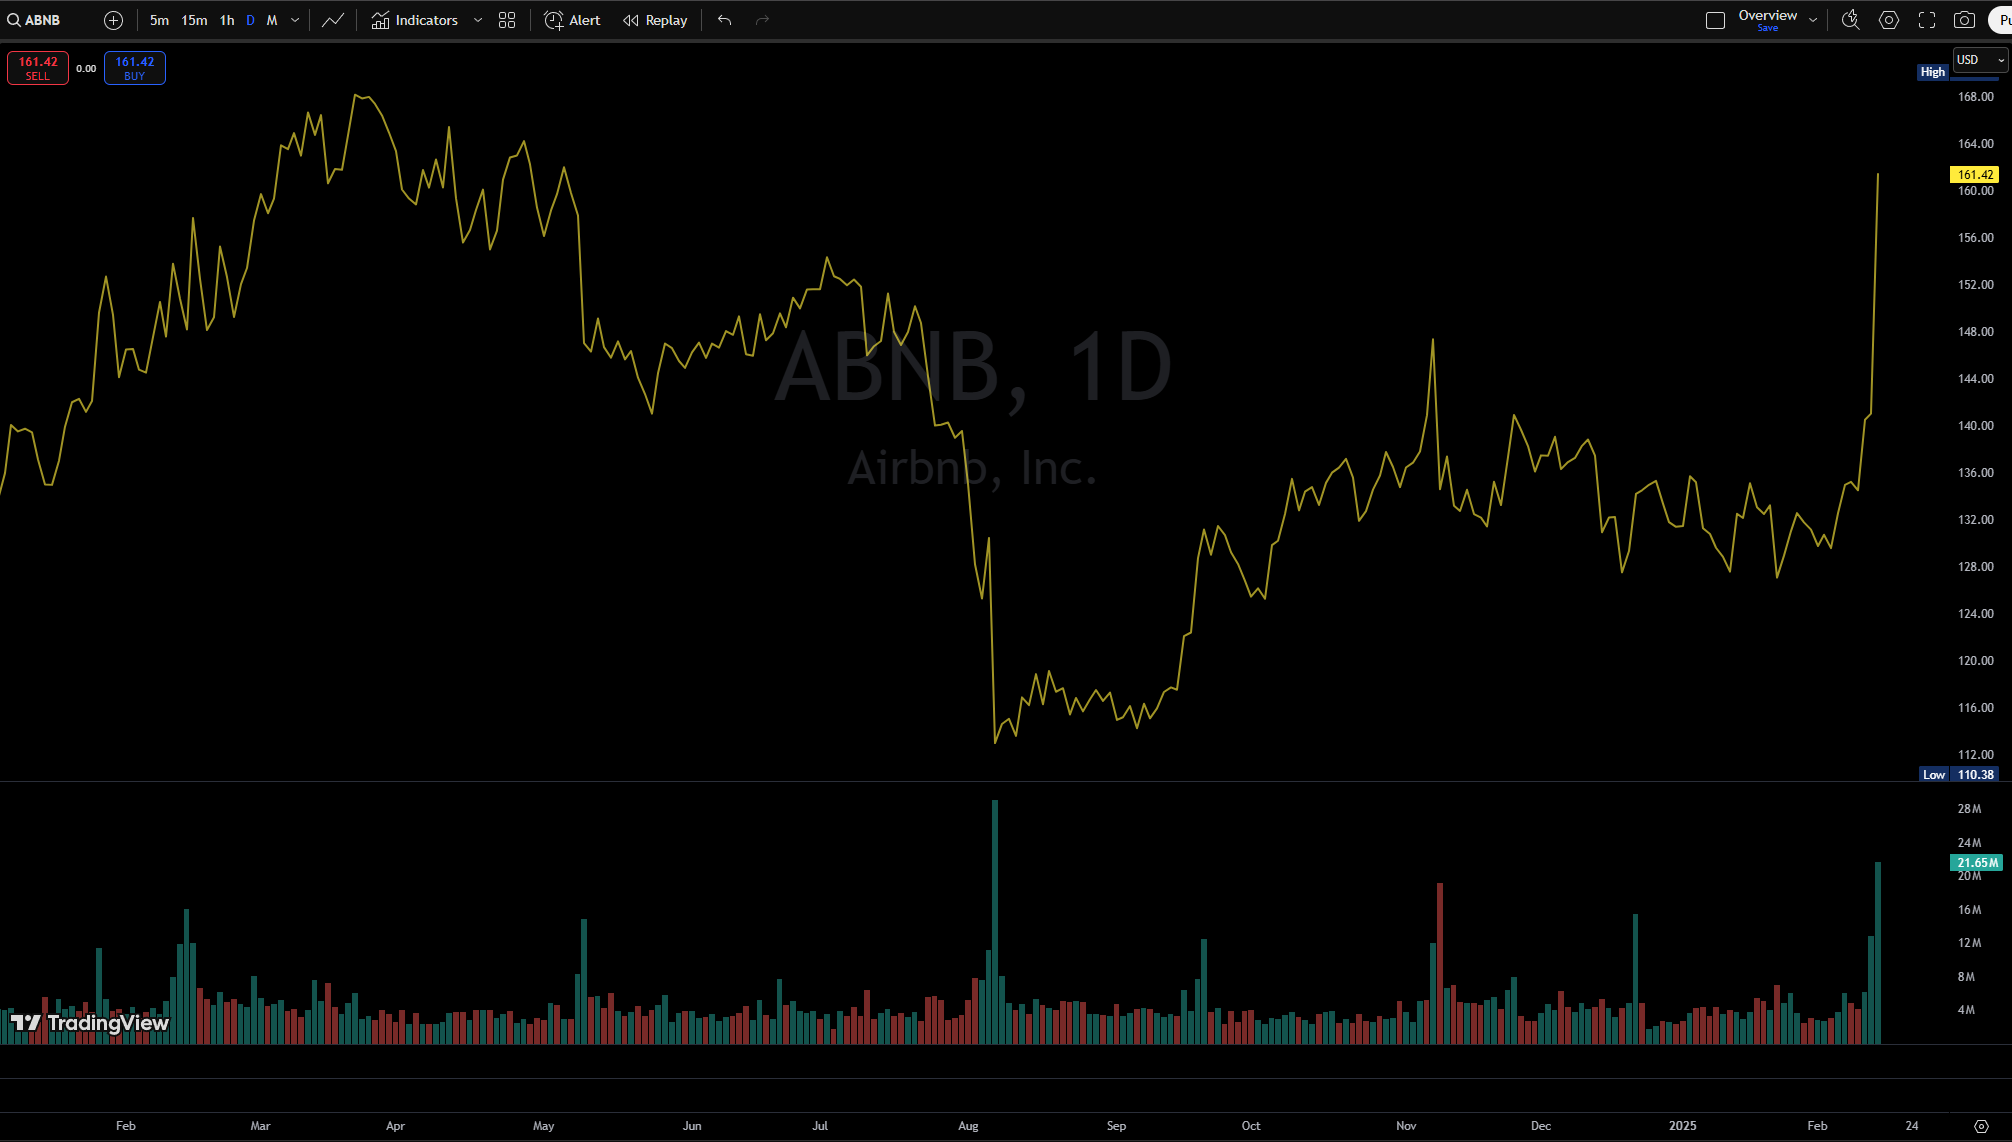
Individual corporate performances painted a vivid picture of the market's selective nature. Airbnb emerged as a standout performer, surging more than 14% after delivering better-than-expected fourth quarter results and offering optimistic forward guidance. Similarly, Roku saw its shares advance more than 15% on the strength of positive earnings and sales figures, while Wynn Resorts gained over 10% after reporting strong results buoyed by improved performance in both Macau and Las Vegas.
The semiconductor sector demonstrated particular resilience, with Micron Technology leading the way on a greater than 4% advance. Other chip manufacturers followed suit, with Marvell Technology, NVIDIA, Microchip Technology, NXP Semiconductors, and Analog Devices all posting gains exceeding 2%. This broad-based strength in semiconductors suggests continued optimism about the sector's growth prospects, particularly in artificial intelligence applications.
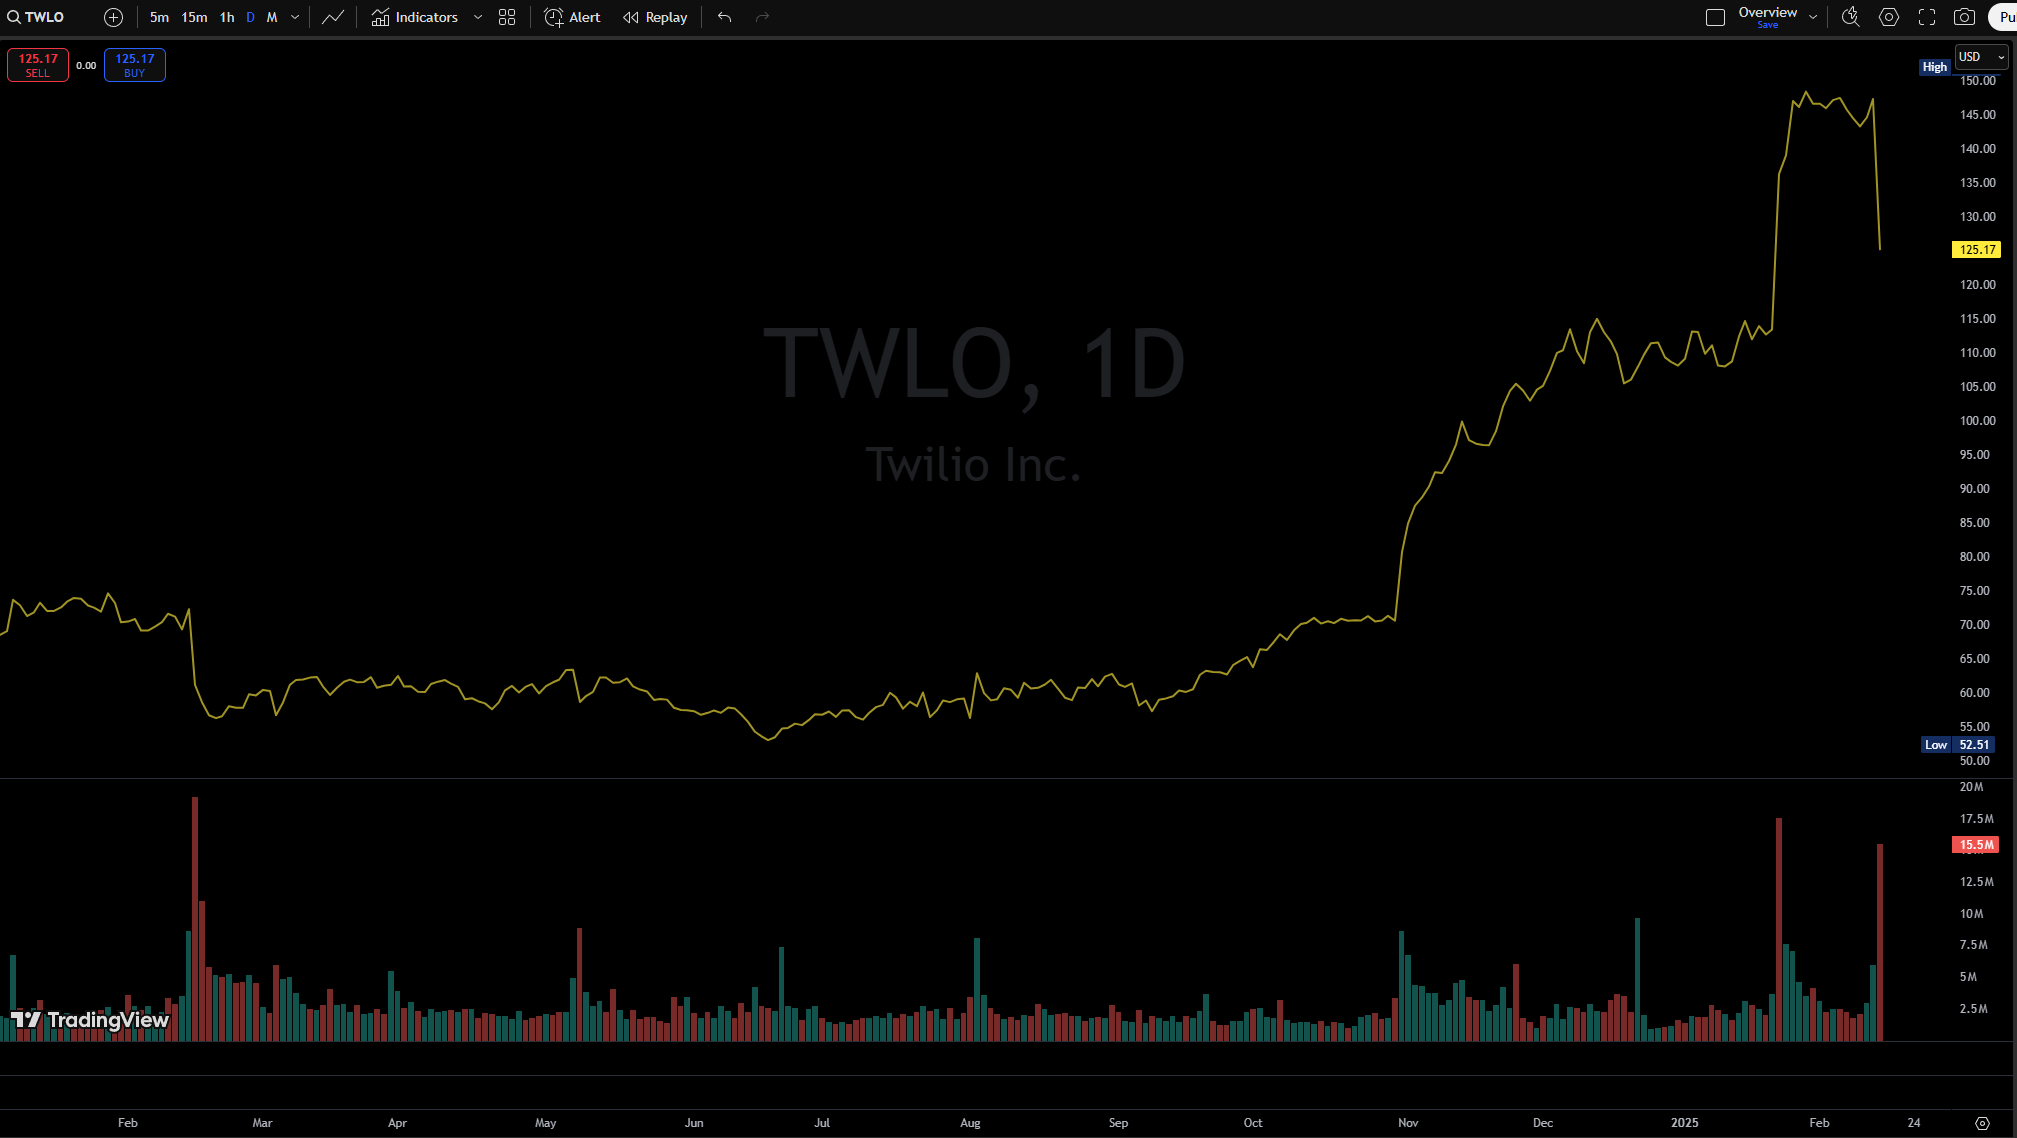
However, not all companies found favor with investors. Twilio saw its shares decline more than 14% after providing disappointing management guidance, though analysts noted underlying support based on artificial intelligence expectations. Applied Materials faced similar challenges, dropping more than 7% after issuing negative guidance partially attributed to Chinese restrictions affecting its sales outlook.
The international market landscape revealed surprising strength in European equities, challenging prevailing negative narratives. The Euro Stoxx 50 edged down 0.13% for the week, but not before touching a new 25-year high. More notably, the German DAX has advanced 13% year-to-date, while the broader Stoxx 600 has gained 10%, both outpacing the S&P 500. This performance is particularly remarkable given the headwinds facing European economies, including manufacturing weakness in Germany, which accounts for 30% of eurozone GDP.

Asian markets presented a mixed picture, with China's Shanghai Composite Index advancing 0.43% while Japan's Nikkei Stock 225 declined 0.79%. Chinese stocks listed in the United States found support on news that Chinese political leaders may meet with Alibaba co-founder Jack Ma, interpreted as a potential signal of improving relations between Beijing and the private sector. This development helped drive Alibaba shares up more than 4%, while PDD gained more than 2%.
Trade policy emerged as a significant market influence as the Trump administration outlined plans for new tariff measures. The announcement of auto import tariffs scheduled for implementation around April 2 added another layer of complexity to global trade relations. While markets responded positively to the delay of reciprocal tariffs until April 1, the administration's comprehensive approach to tariff calculations, including consideration of VAT taxes and non-tariff barriers, suggests the potential for substantial impact on U.S. imports from numerous countries.
Geopolitical tensions added another dimension to market considerations, particularly following a drone attack on the Chernobyl nuclear plant in Ukraine. This incident, occurring Thursday night, raised concerns about escalation in the Ukraine-Russian conflict and its potential implications for global stability and energy markets.
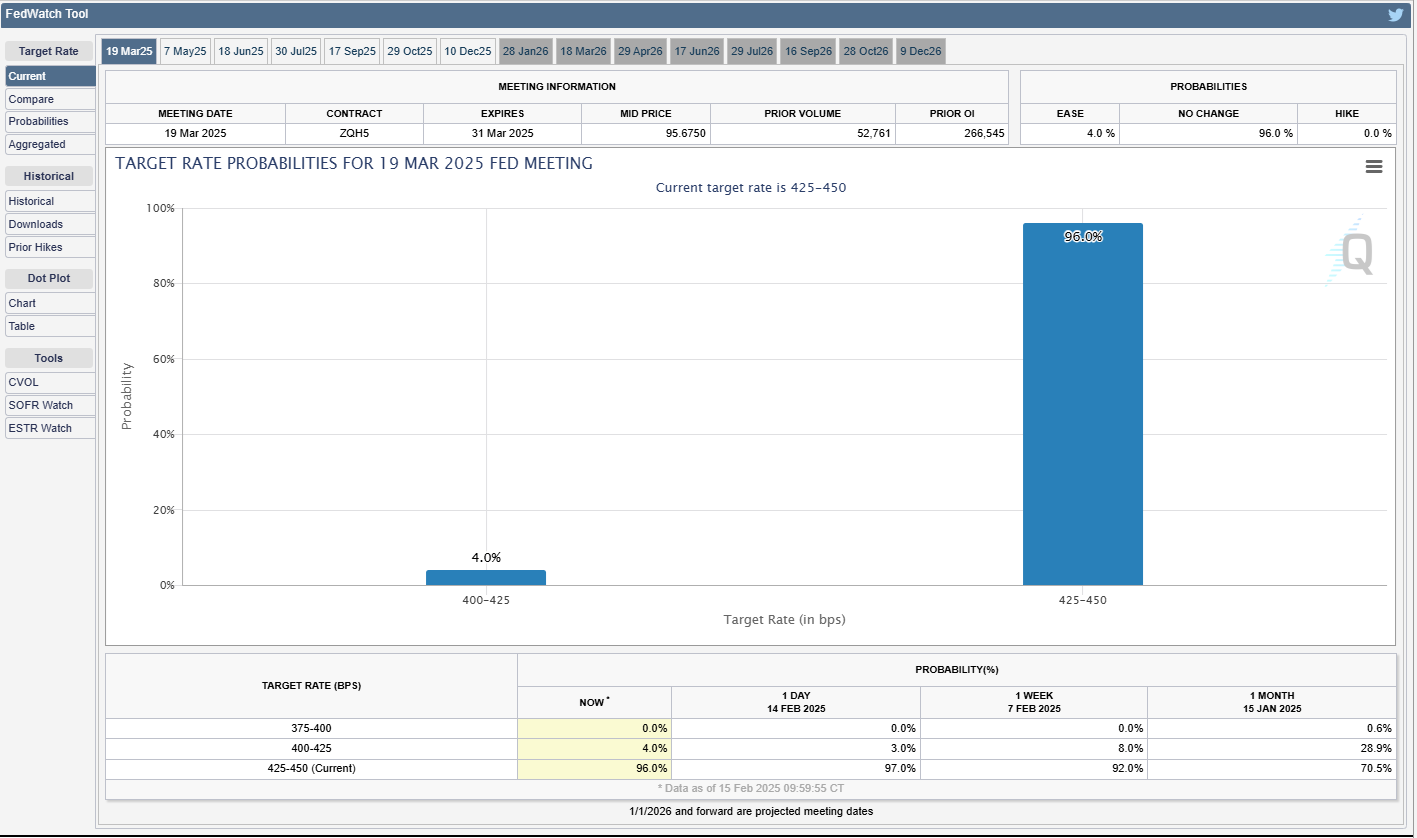
The Federal Reserve's monetary policy stance continued to evolve in response to economic data. Markets now assign only a 2% probability to a 25 basis point rate cut at the next FOMC meeting in March, reflecting a significant shift in rate expectations. This reassessment of the Fed's likely path forward comes amid persistent inflation concerns and relatively robust economic data outside of retail sales.
These various cross-currents have created a market environment that demands careful navigation. The broadening of market leadership beyond the Magnificent Seven represents a potentially healthy development for market sustainability, while the resilience of corporate earnings provides fundamental support for current valuation levels. However, the combination of sticky inflation, uncertain monetary policy, and evolving trade dynamics suggests continued market volatility may lie ahead.

Looking forward, several key themes emerge as critical for market direction. The ability of companies to maintain profit margins in the face of persistent inflation pressures will be crucial. The evolution of trade policy and its impact on global supply chains and corporate profitability bears careful monitoring. Additionally, the potential for further rotation in market leadership, particularly between growth and value styles and across geographic regions, may create both opportunities and challenges for investors.
The fixed income market's response to these developments will be particularly important to watch. With the 10-year Treasury yield hovering near 4.5%, any significant move above this level could present opportunities for duration extension in fixed income portfolios. Meanwhile, the divergence between U.S. and European monetary policy expectations, with the ECB showing greater inclination toward near-term easing, may create opportunities in international fixed income markets.
In conclusion, while the headline indices suggest relatively calm markets, significant changes are occurring beneath the surface. The combination of strong corporate earnings, evolving monetary policy expectations, and shifting market leadership points to a dynamic investment environment that rewards careful analysis and selective positioning. As markets continue to process these various influences, maintaining flexibility in investment approach while remaining anchored to fundamental analysis appears crucial for navigating the path forward.
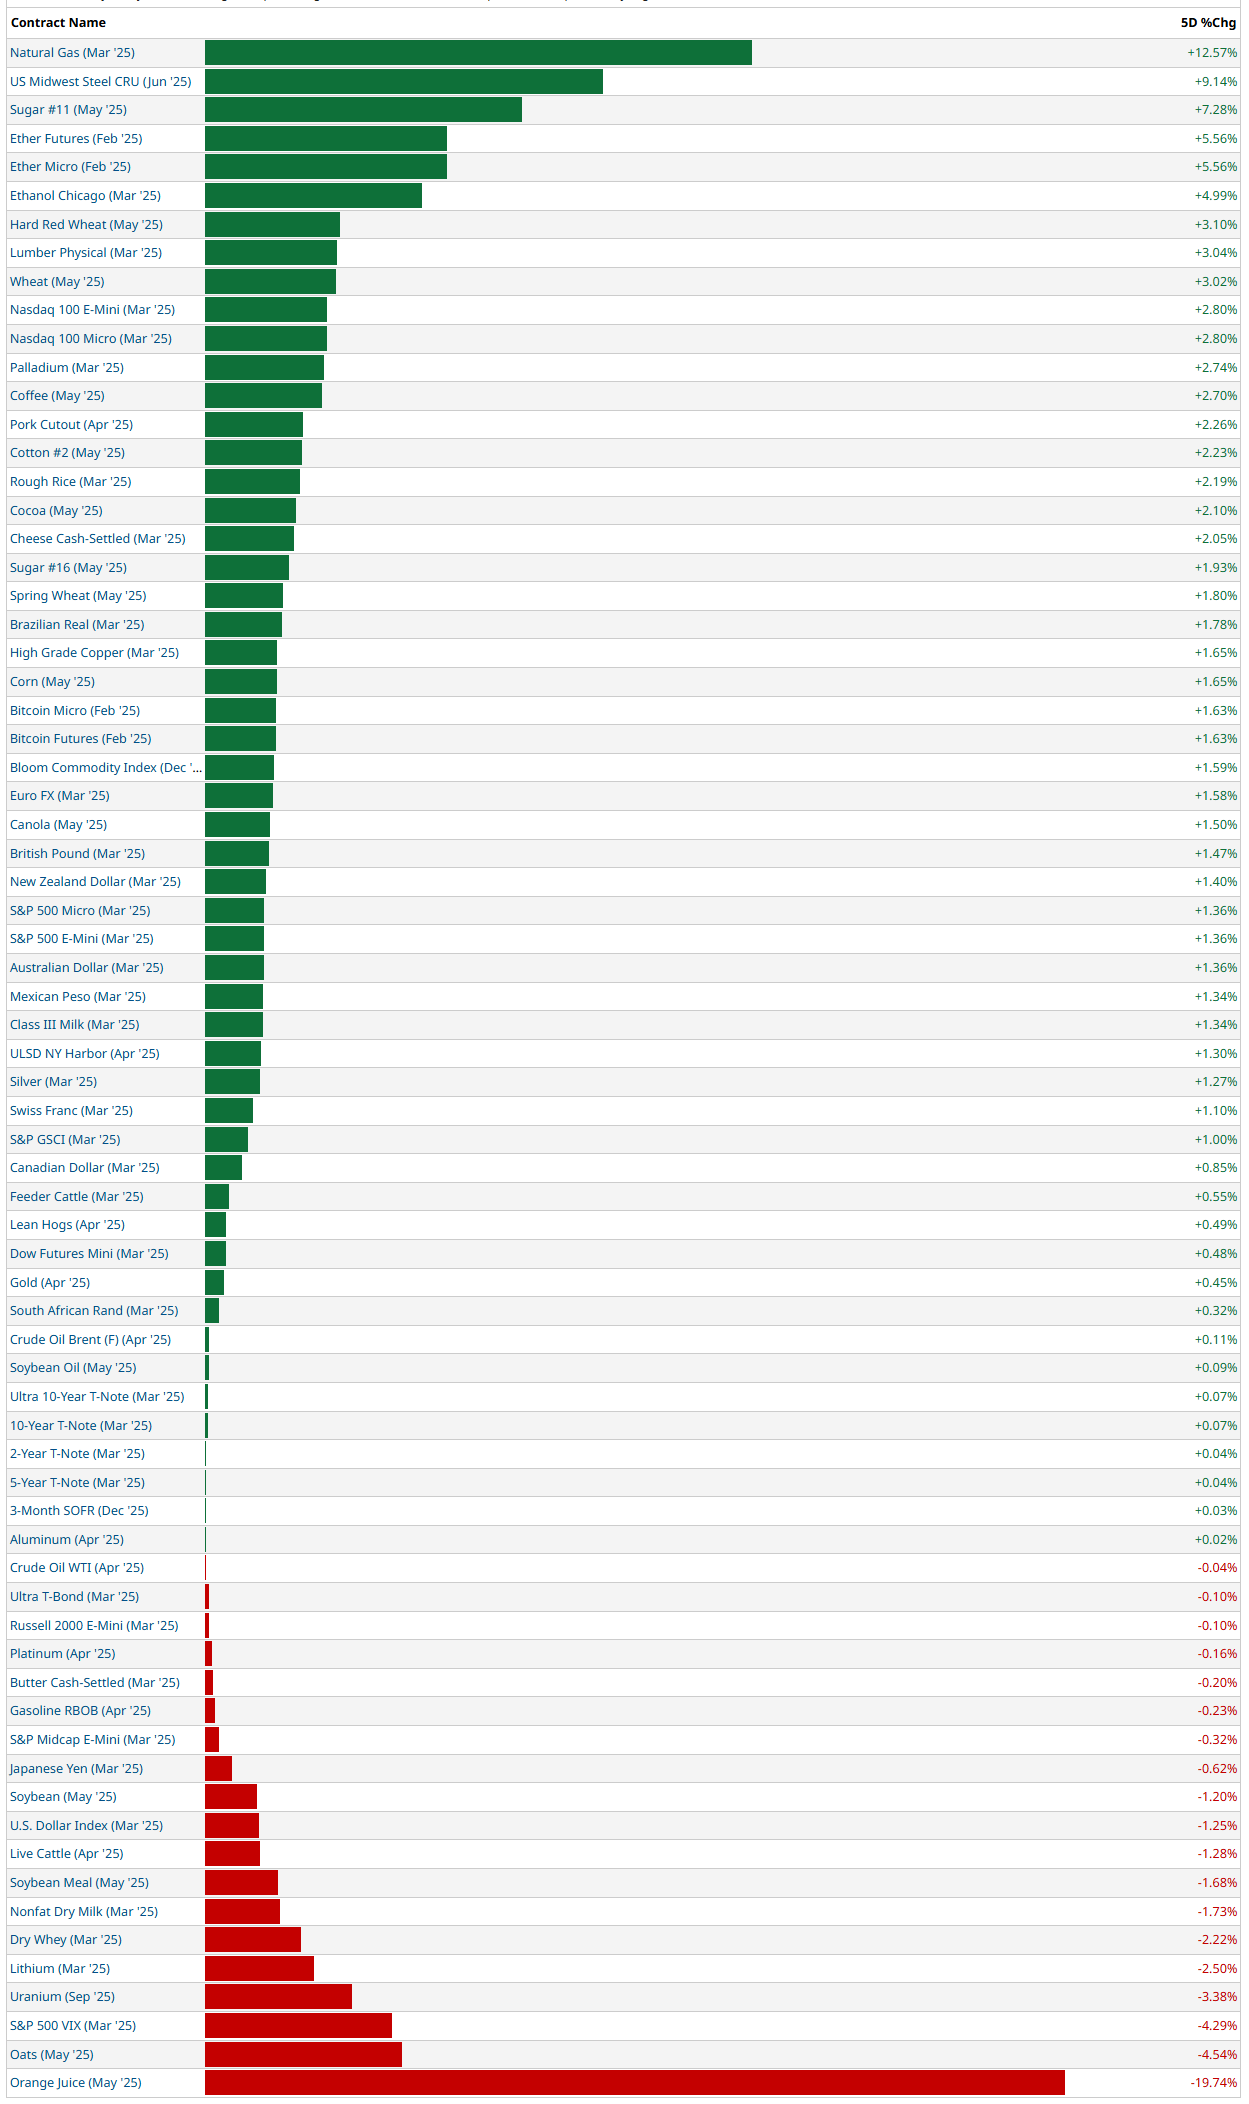
5-Day Futures Performance Leaders
S&P 500 Sector Insights
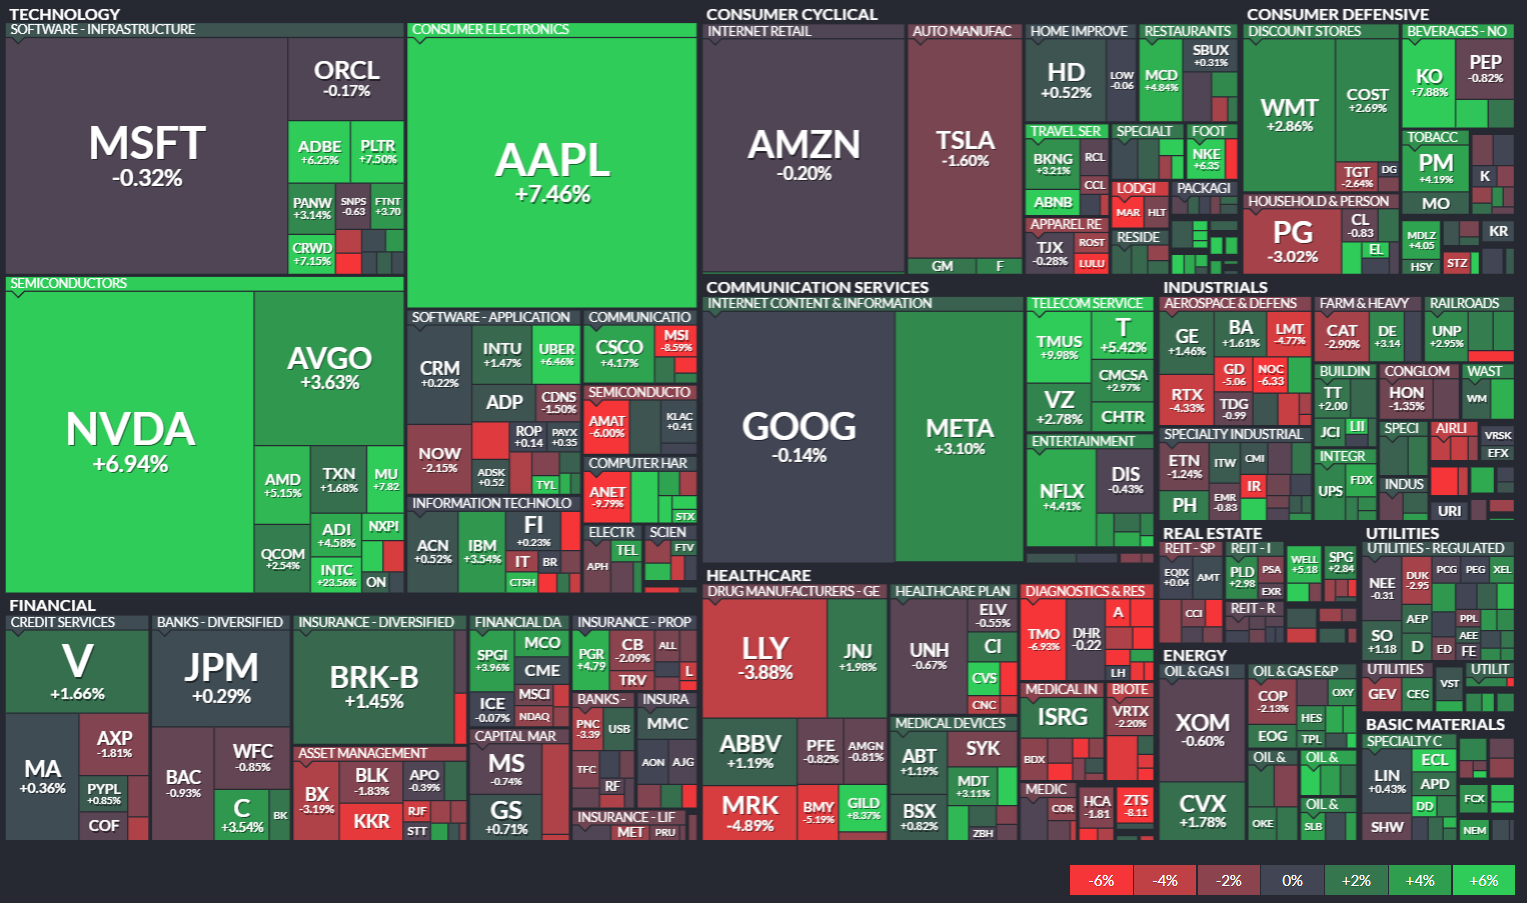
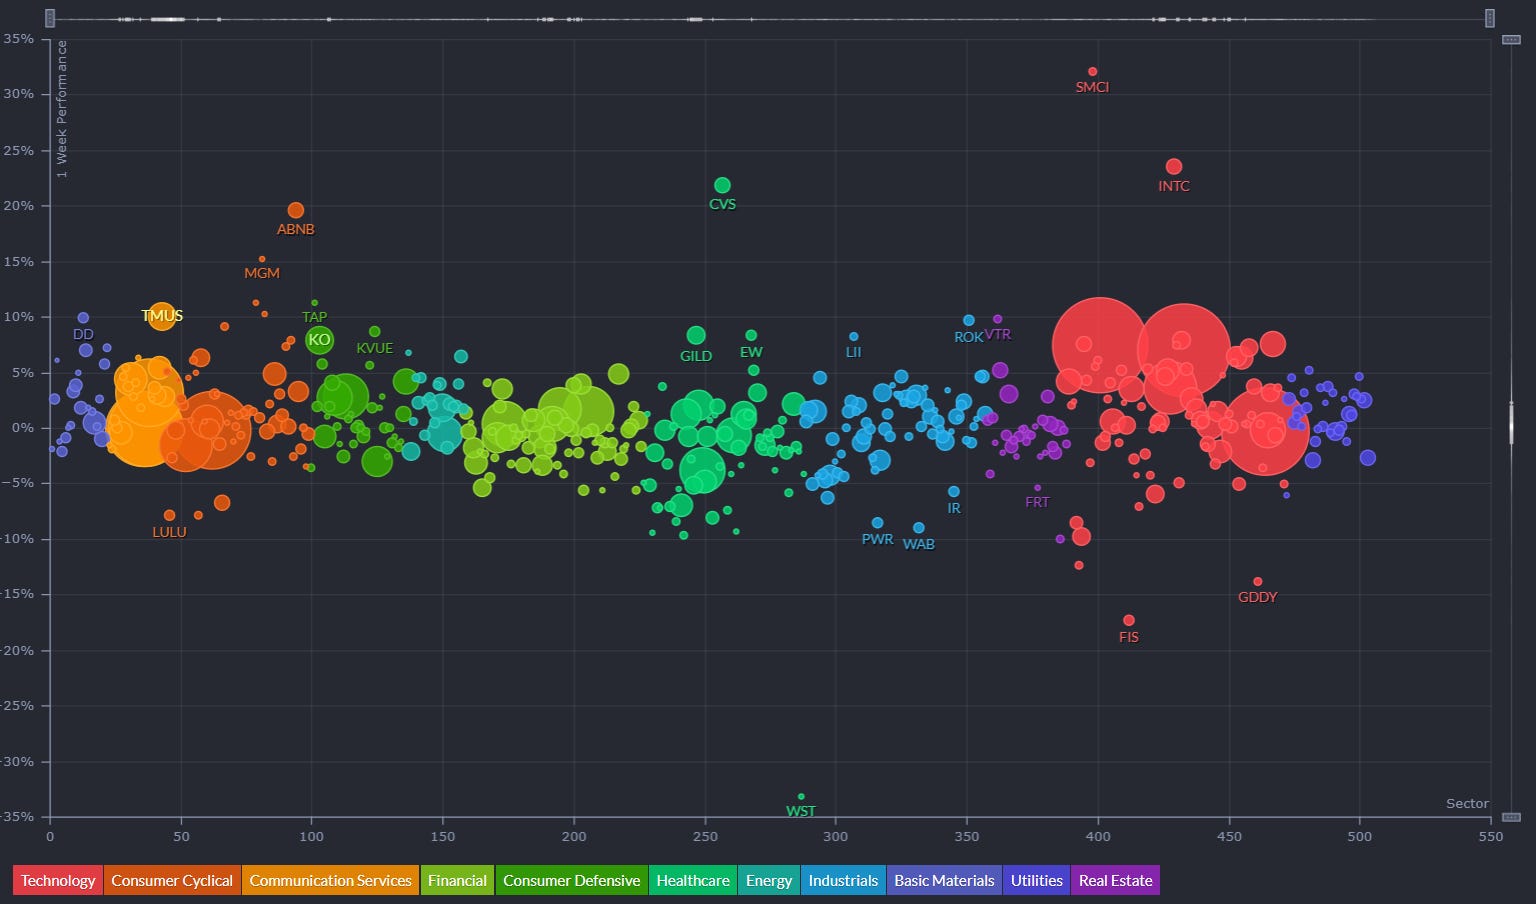
Sector Overview With Individual Names By Market Cap
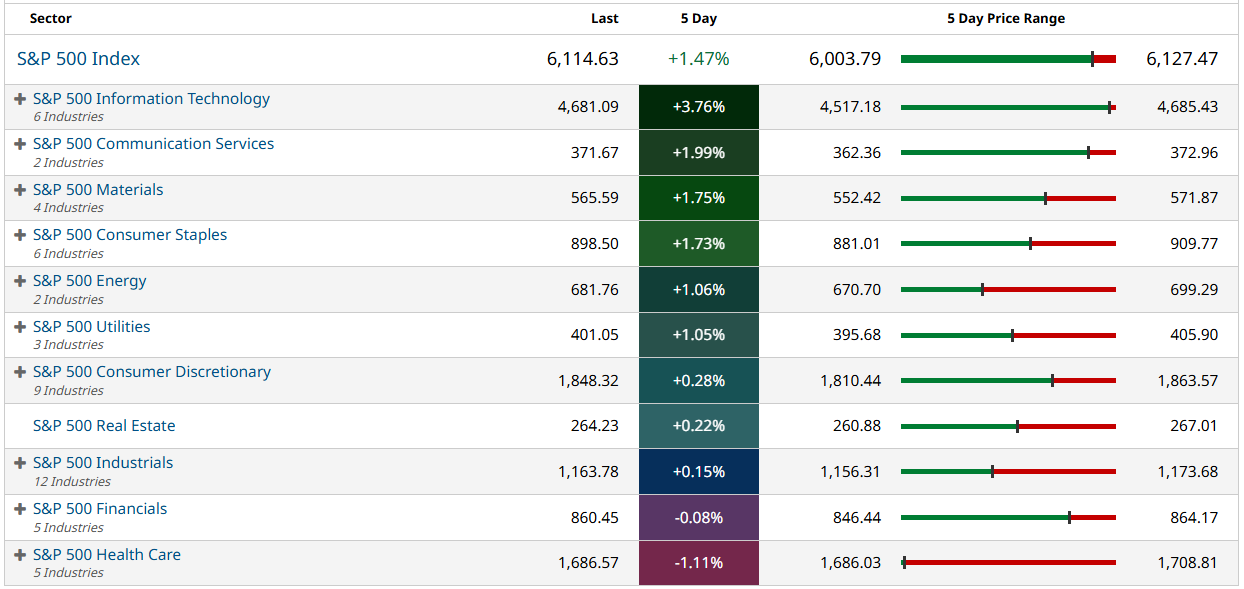
5-Day Sector Leaderboard
5-Day Sinkers vs Swimmers Grouped By Sector
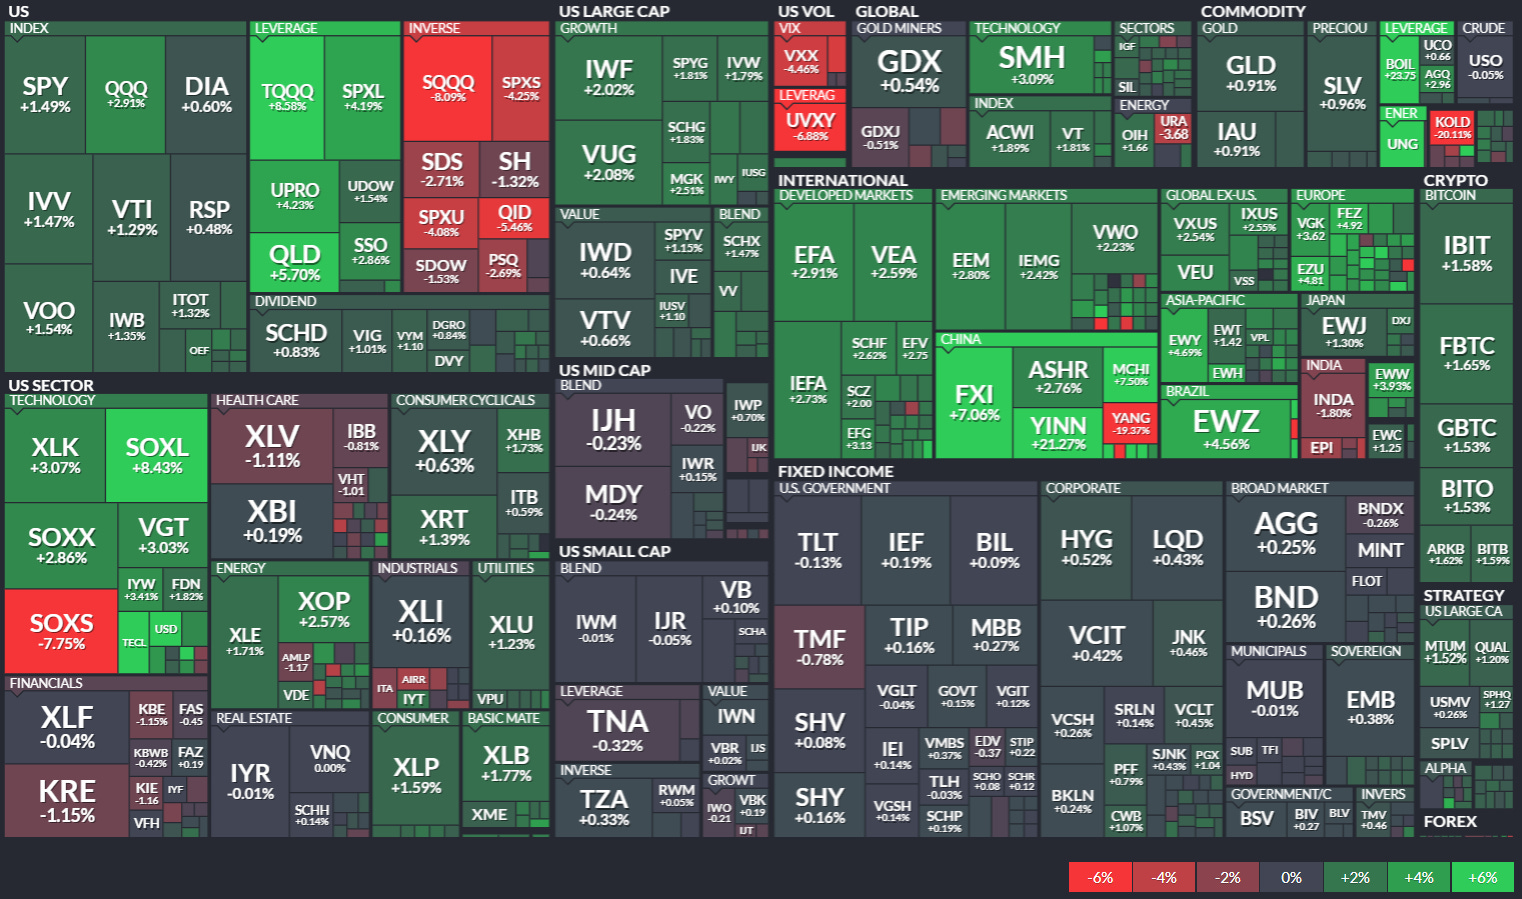
ETF Insights
Reviewing a heatmap like this weekly can be incredibly helpful for investors as it provides a quick and visual summary of market performance across various sectors, asset classes, and geographies.
1. Sector and Asset Class Trends
Identify Strong and Weak Sectors: Investors can quickly spot which sectors (e.g., technology, energy, healthcare) are performing well or underperforming.
Asset Class Diversification: Seeing how commodities, fixed income, equities, and cryptocurrencies performed helps assess diversification.
2. Market Sentiment
Risk-On or Risk-Off: A green-dominated map suggests bullish sentiment, while red indicates bearish sentiment. Investors can align their strategies accordingly.
Volatility Indicators: Observing movements in volatility indices (e.g., VIX) can highlight changing market dynamics.
3. Regional Analysis
Global Insights: Performance in developed and emerging markets (e.g., Europe, China, Asia-Pacific) helps in gauging international investment opportunities or risks.
Currency Impacts: Movements in forex or country-specific ETFs can indicate currency-driven market trends.
4. Thematic Trends
Growth vs. Value: Comparing the performance of growth ETFs (e.g., VUG) versus value ETFs (e.g., VTV) reveals the prevailing market preference.
Industry Leadership: Highlighting leadership within industries (e.g., gold miners, semiconductors) can inform thematic plays.
5. Monitoring Investments
Portfolio Alignment: Investors can track how their existing investments or watchlist align with broader market trends.
Rotation Signals: Seeing week-over-week changes in sector dominance may signal sector rotation opportunities.
6. Risk Management
Recognizing Overbought/Oversold Conditions: Consistent underperformance or overperformance in specific areas may indicate potential mean-reversion trades.
Correlation Awareness: By observing how different asset classes move, investors can manage portfolio correlation and risk.
7. Decision Support
Identify Outperformers/Underperformers: ETFs, sectors, or indices that repeatedly outperform or underperform can help refine trading or investment strategies.
Macro Perspective: Weekly trends highlight macroeconomic or geopolitical influences affecting markets.
Regularly reviewing a heatmap like this is a strategic practice that supports data-driven decision-making while fostering a holistic understanding of market dynamics.
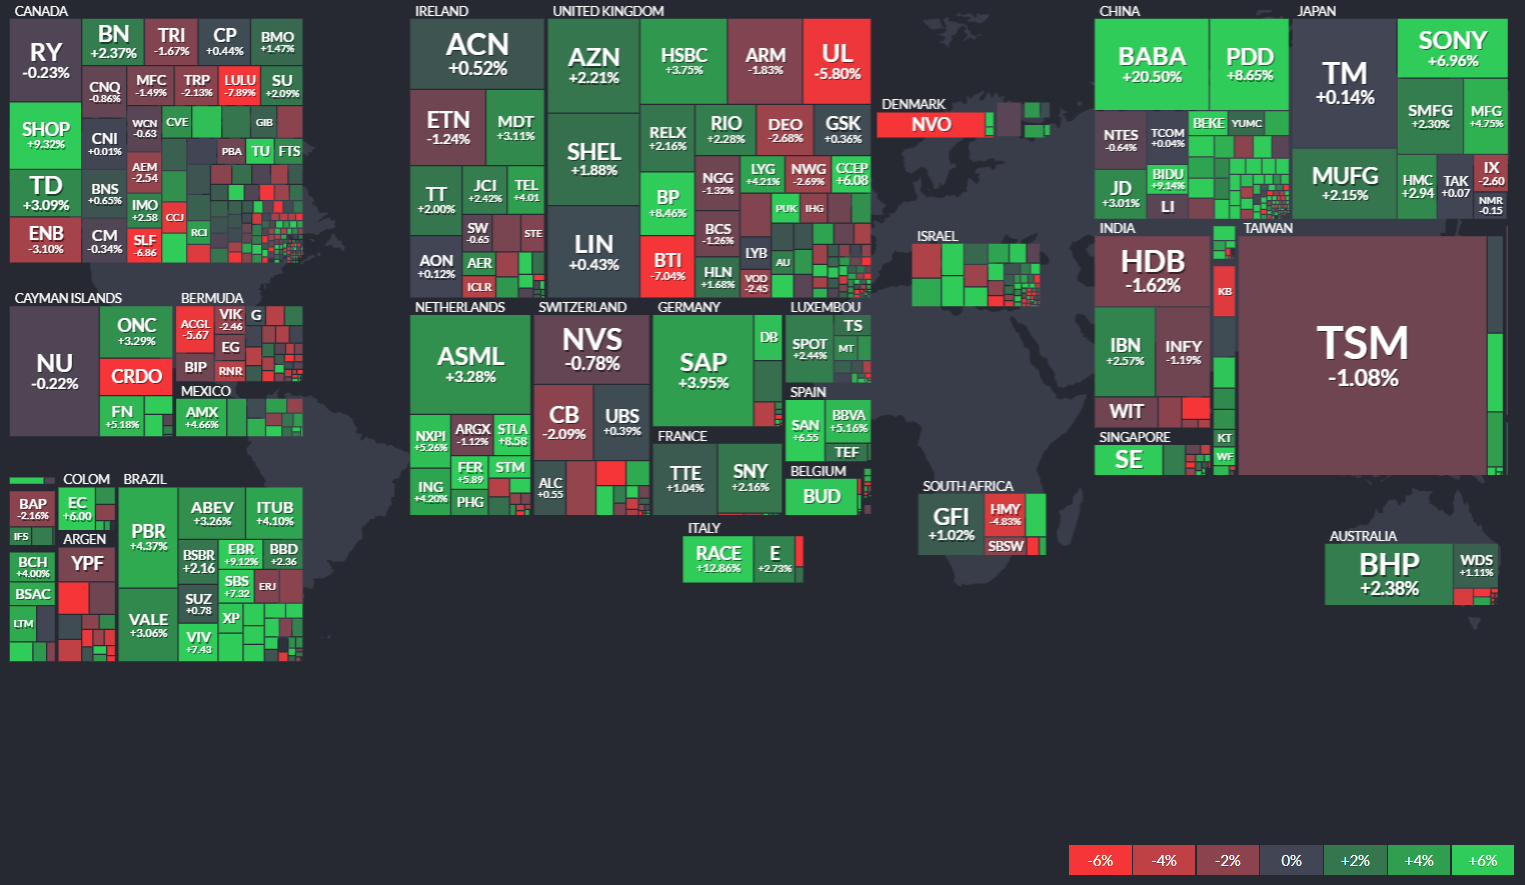
Global Overview
Foreign ADR stocks listed on NYSE, NASDAQ & AMEX categorized by geographic location. Reviewing a global heatmap like this weekly is valuable for investors because it offers insights into international markets, helping to:
Identify Global Trends: Spot which regions or countries are performing well or underperforming.
Assess Sector and Regional Performance: Understand how industries are faring across different regions.
Diversify Portfolios: Uncover opportunities in emerging or developed markets for greater diversification.
Gauge Global Sentiment: Recognize the impact of macroeconomic events on specific regions.
Align with Global Strategies: Refine investment strategies based on regional strengths or weaknesses.
This overview ensures investors stay informed about global opportunities and risks, complementing their domestic market analysis.

Special Coverage: Are US Financial Markets Topping, or Are We Entering a New Economic Paradigm?
The debate over the state of US financial markets is as fierce as ever. Some argue that the market is overheating, with valuation models flashing red and historical indicators suggesting we are on the precipice of a significant downturn. Others, however, point to robust economic fundamentals and the transformative power of artificial intelligence as reasons why traditional valuation frameworks may no longer apply. The question at hand is whether these indicators of market exuberance are a harbinger of trouble, or if we are on the verge of a new economic paradigm.
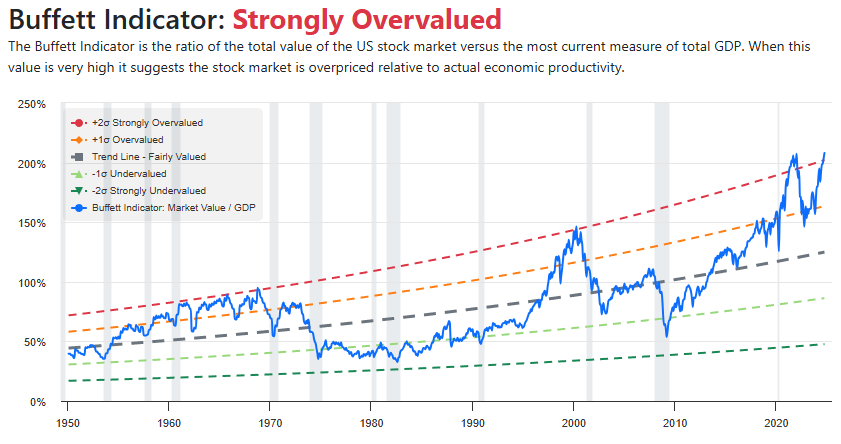
For decades, investors have relied on valuation models like the Buffett Indicator, the CAPE Ratio, and price-to-earnings ratios to determine whether stocks are overvalued. Time and again, markets have corrected when these indicators reached extreme levels. Yet, despite these ominous signs, the US economy remains resilient. Unemployment is low, corporate earnings are strong, and technological advancements—especially in AI—are reshaping industries in ways we have never seen before.
We must therefore examine both perspectives. Are the historical models still valid predictors of market trends, or are we in uncharted territory where the old rules no longer apply? This essay will explore both sides of the argument, assessing whether investors should brace for a market correction or embrace a new era of economic growth driven by technological disruption.
The Bearish Argument: Signs of a Market Top
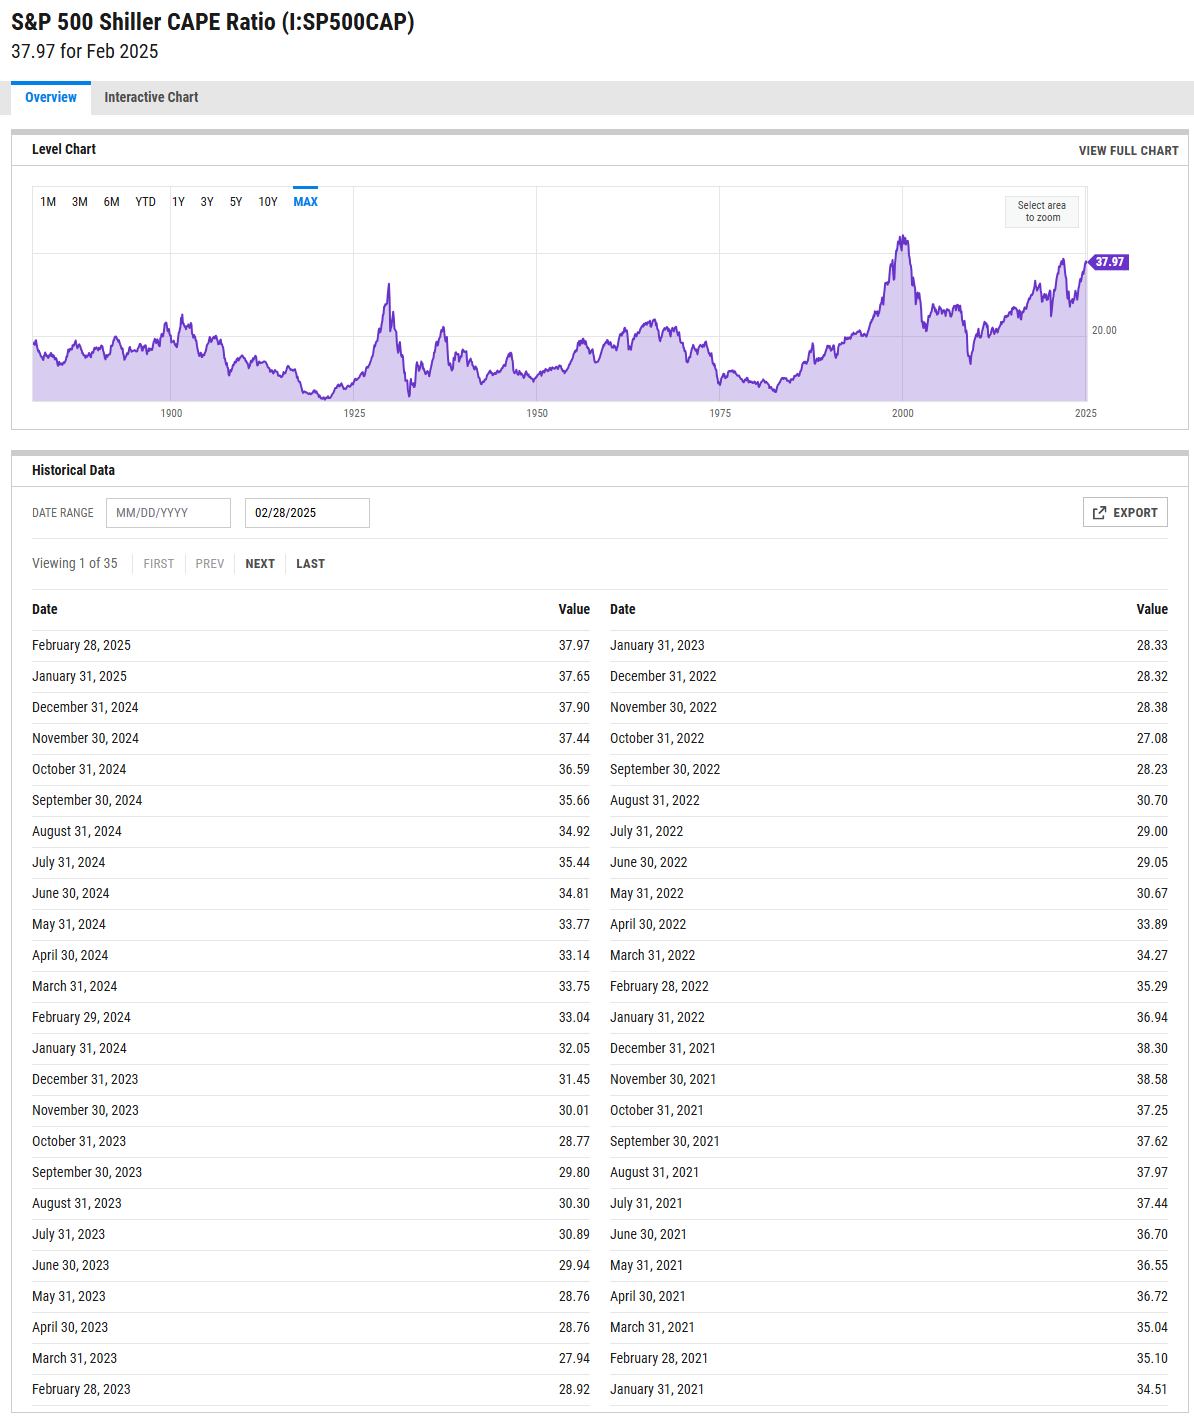
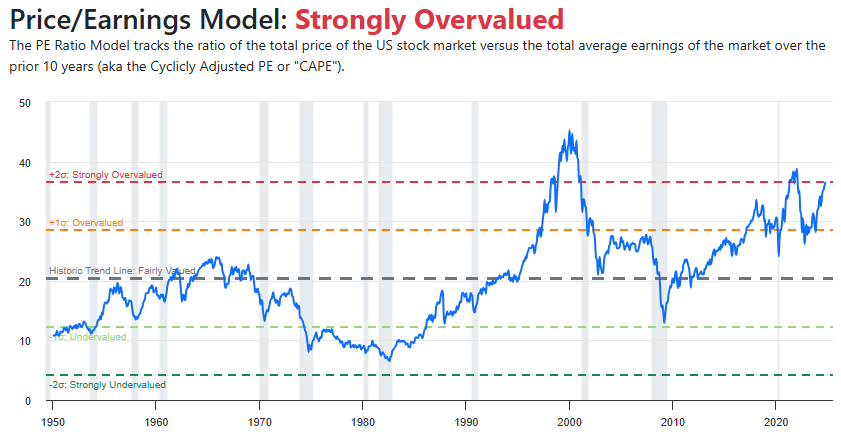
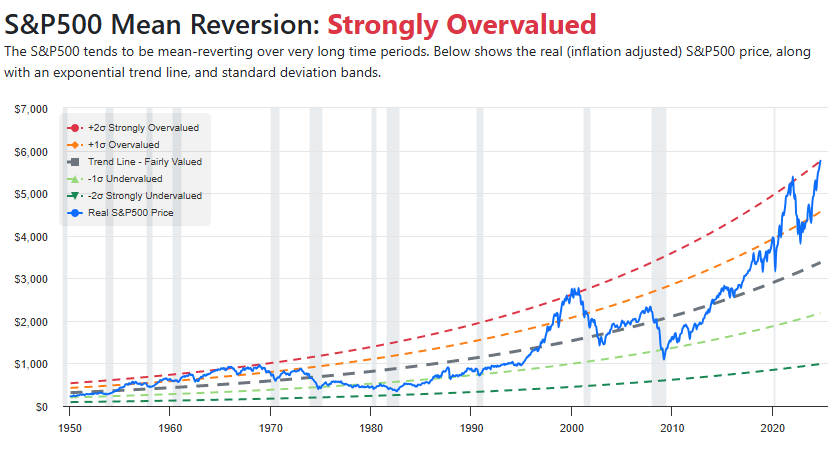
In the eyes of many seasoned investors, the market is displaying all the classic signs of an imminent peak. Valuation metrics that have historically preceded market downturns are at unprecedented levels. The Buffett Indicator—measuring the ratio of stock market capitalization to GDP—has surged beyond its historical average. The CAPE Ratio, which adjusts earnings over a 10-year period, is also in historically high territory, suggesting that stocks are priced well above their long-term fair value.

This is not the first time markets have ignored traditional warning signs. The Dot-Com Bubble of the late 1990s saw similarly stretched valuations, fueled by excitement over the internet revolution. Investors dismissed concerns about excessive valuations, believing that technology would rewrite economic rules. But reality caught up, and the market collapsed, erasing trillions in wealth. Similarly, before the Great Financial Crisis of 2008, real estate markets were booming, and debt was soaring. Analysts warned of unsustainable growth, yet euphoria carried on—until it didn’t.
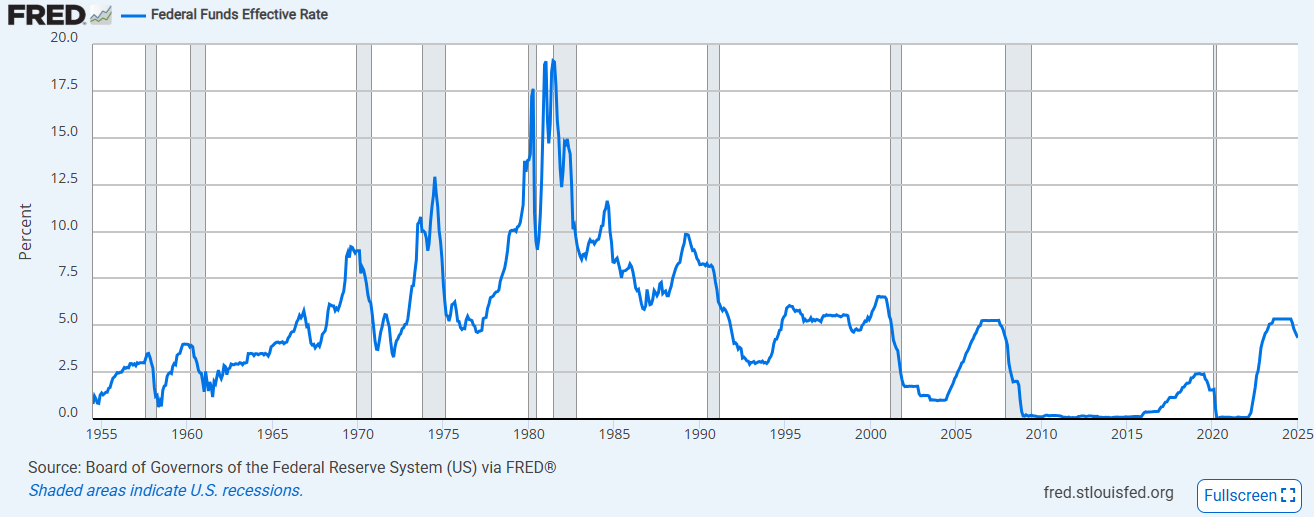
Today's market bears see similar warning signs. Debt levels are rising at an unsustainable rate. The Federal Reserve’s monetary tightening efforts are creating liquidity concerns. Meanwhile, geopolitical tensions, inflationary pressures, and economic uncertainties only add to the risks. Historically, when markets ignore these warning signs, a painful reckoning has followed.
Recession Risks: Are Storm Clouds Gathering?
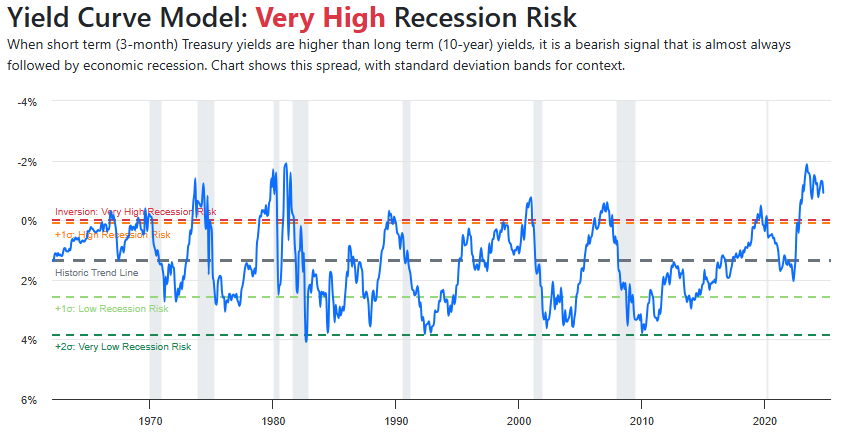
While the economy remains strong, several indicators suggest that recession risks should not be ignored. The yield curve, a historically reliable predictor of recessions, has been inverted for an extended period, signaling potential economic trouble ahead. Consumer confidence has shown signs of weakening, particularly as persistent inflation erodes purchasing power.
Corporate earnings, while resilient, face pressure from rising borrowing costs as interest rates remain elevated. Additionally, cracks in the labor market, such as slowing job growth and increased layoffs in key industries, may indicate an impending slowdown. A recession would not only impact stock valuations but could also exacerbate existing debt concerns, leading to further economic distress.
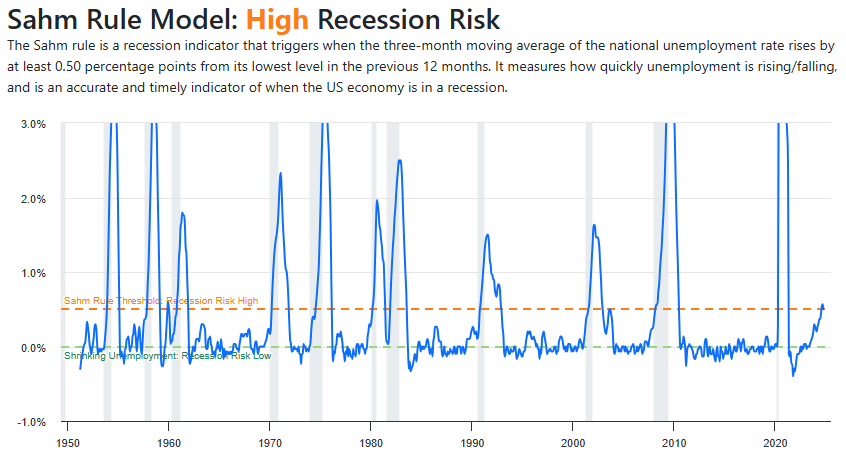
The Sahm Rule is a real-time recession indicator developed by economist Claudia Sahm. It is designed to identify the onset of a recession based on changes in the unemployment rate. The rule states that a recession is likely underway if the three-month moving average of the national unemployment rate rises by 0.5 percentage points or more above its lowest level from the previous 12 months.
History and Importance
Developed by Claudia Sahm, a former Federal Reserve economist, the rule was created as a simple and effective way to detect recessions early.
First published in 2019, it has since gained credibility among economists and policymakers due to its accuracy in signaling past recessions.
Used by policymakers, including the Federal Reserve and government agencies, to inform economic stimulus decisions.
Unlike many economic indicators that lag in confirming recessions, the Sahm Rule provides an early warning system, allowing for quicker responses to economic downturns.
It has been effective in identifying every U.S. recession since 1960 with minimal false signals.
This rule is particularly valuable in the context of monetary and fiscal policy since it helps determine when stimulus measures may be needed to counteract economic contractions. Given the ongoing debates about market tops and potential recessions, the Sahm Rule remains an important tool for assessing economic risk.
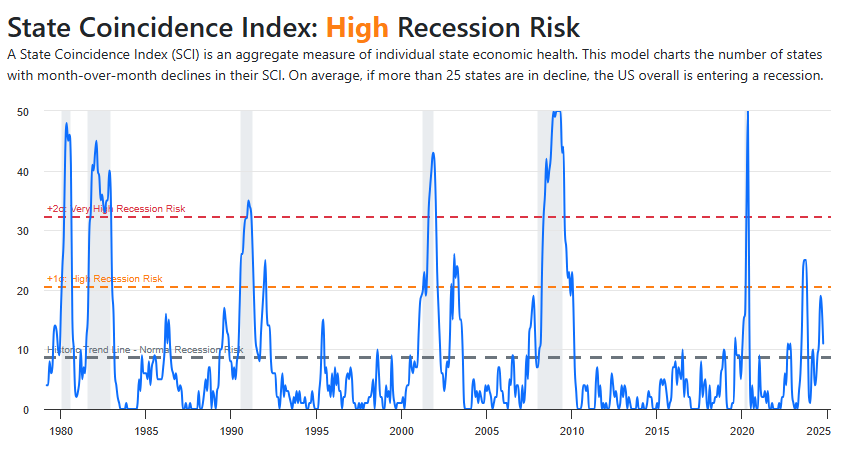
The State Coincidence Index (SCI) is an economic indicator developed by the Federal Reserve Bank of Philadelphia to track economic activity at the state level. It is designed to provide a real-time assessment of individual state economies and their overall contributions to national economic performance.
History and Development
The Philadelphia Fed created the index in the 1990s as a way to measure economic conditions across different U.S. states.
It is based on four key economic variables:
Nonfarm payroll employment
Unemployment rate
Average hours worked in manufacturing
Wage and salary disbursements
By aggregating these data points, the SCI provides a single composite measure of each state's economic health.
Importance and Use
The SCI allows economists, policymakers, and businesses to analyze regional economic trends in real-time.
It helps identify recessions or economic expansions at the state level, often preceding national economic downturns.
The index is frequently used in conjunction with the Leading and Lagging Economic Indicators to anticipate broader economic shifts.
It also provides a more granular look at how different states contribute to overall U.S. economic conditions, which is crucial for understanding uneven recoveries or localized recessions.
Given the importance of regional economic dynamics, the State Coincidence Index serves as a valuable tool for investment decisions, fiscal policy, and labor market analysis. It is particularly relevant when assessing whether the broader U.S. economy is at risk of a slowdown or if some states are faring better than others during periods of economic uncertainty.
While some believe that AI-driven productivity growth and strong consumer spending can offset these risks, history suggests that downturns often arrive unexpectedly, even when headline economic indicators appear stable. Investors should therefore remain cautious and consider hedging against potential downturn scenarios.
The Bullish Counterpoint: The Economy Remains Strong
Despite these concerns, there is a strong counterargument that the market’s rally is far from over. Economic fundamentals remain robust. The US economy continues to expand, driven by consumer spending, corporate investment, and technological innovation.
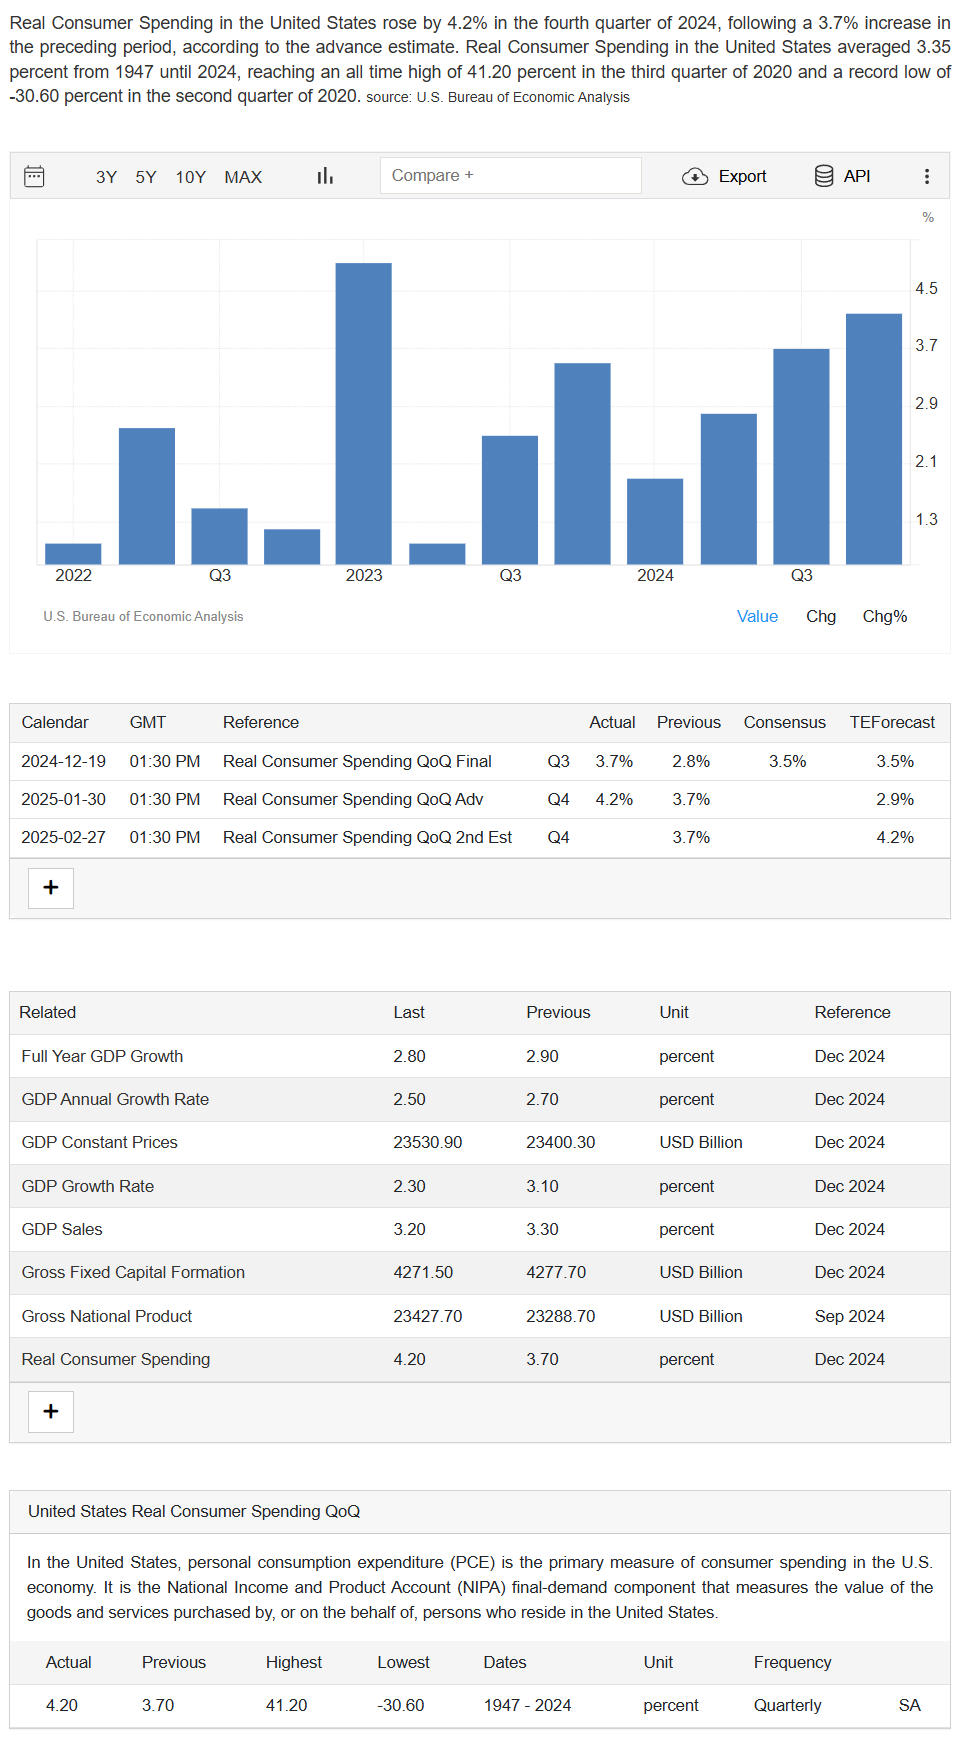
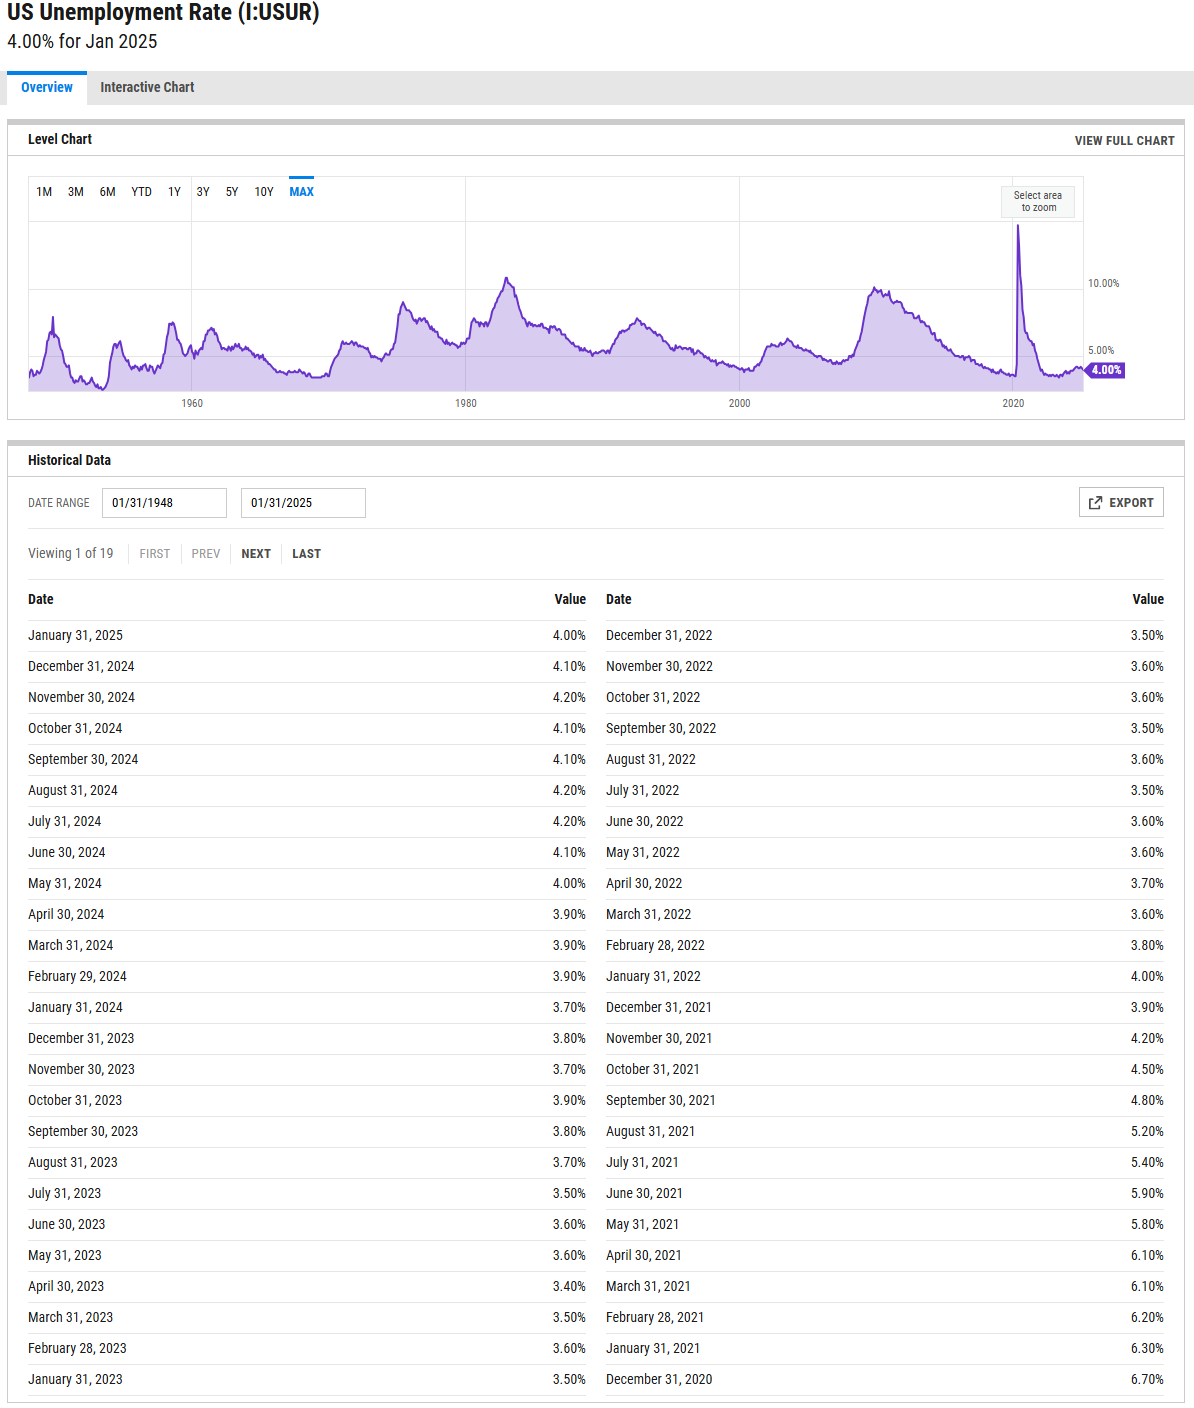
One of the most persuasive arguments against a market downturn is the strength of the labor market. Unemployment remains near record lows, and wage growth is healthy. Consumers, who drive much of the economy, continue to spend, providing a solid foundation for economic stability. Unlike in past bubbles, corporate balance sheets are generally strong, with many companies having locked in low interest rates before the Federal Reserve’s tightening cycle. This resilience suggests that even if a downturn were to occur, its effects could be more muted than in past cycles.
Another key factor is the Federal Reserve’s balancing act. While the Fed has aggressively raised interest rates to combat inflation, policymakers have signaled a willingness to pivot if economic conditions deteriorate. This flexibility provides a safety net that was absent during previous market collapses.
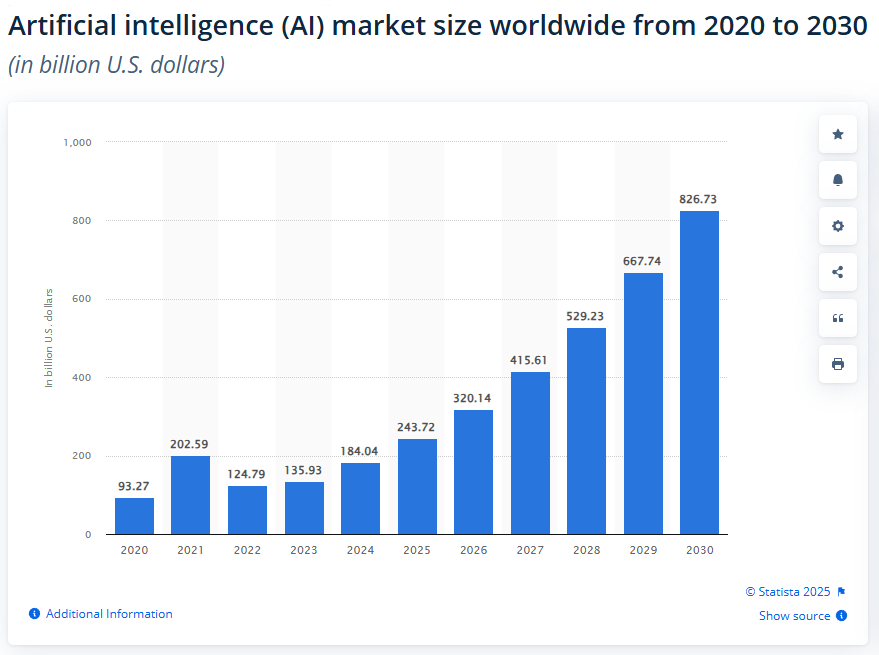
AI as a Market Game-Changer
Perhaps the strongest case for continued market expansion is the rapid adoption and development of artificial intelligence. AI is poised to revolutionize industries in ways that could justify the elevated valuations seen today. Much like how the industrial revolution and the internet age transformed economies, AI has the potential to drive unparalleled productivity growth, unlocking new efficiencies and creating wealth in ways we cannot yet fully quantify.
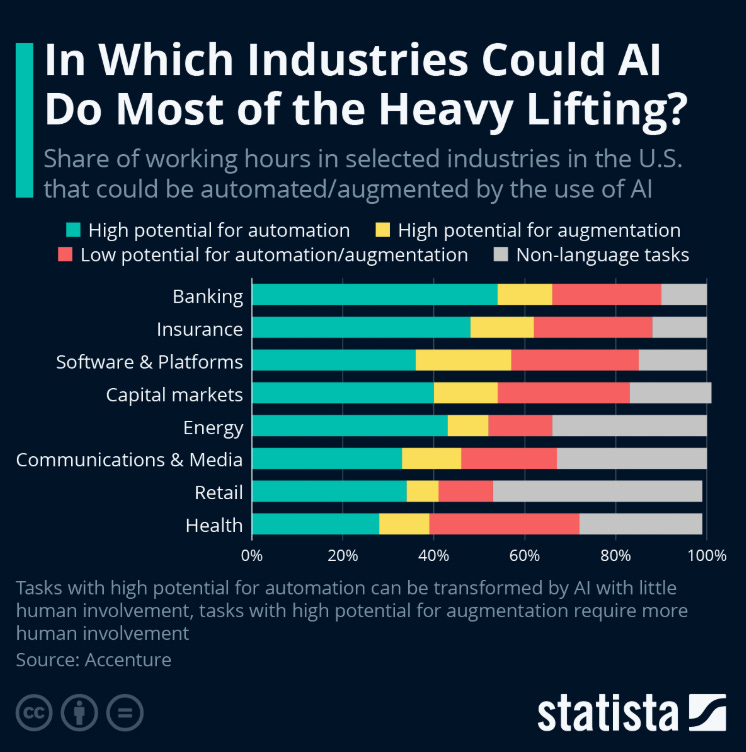
Skeptics argue that AI-driven growth is speculative, yet history suggests that transformative technologies often defy early valuation concerns. Consider how companies like Amazon and Google were initially dismissed as overvalued during their early years, only to become some of the most valuable enterprises in the world. AI’s impact on automation, healthcare, finance, and countless other sectors could be the foundation of a new economic era.
Furthermore, if AI meaningfully increases productivity, it could alter economic structures so significantly that traditional valuation models may no longer apply. If companies can generate higher profits with fewer resources, then their valuations, even if historically high, may be justified. This raises an essential question: Are we truly overvalued, or are we just beginning to grasp AI’s economic implications?

Bridging the Gap: Are Old Models Still Relevant?
If history is any guide, market excesses tend to correct themselves eventually. But the scale and nature of such corrections vary. While skeptics argue that markets must revert to historical valuation norms, proponents of AI-driven expansion suggest that new economic paradigms render past models obsolete.
It is also possible that both sides are correct in different respects. The market may indeed face short-term corrections, particularly if external shocks—such as monetary policy missteps or geopolitical crises—trigger investor panic. However, over the long run, if AI and technological advancements continue to drive productivity, then markets could sustain higher valuations than ever before.
Conclusion: Navigating Uncertainty
The US financial markets stand at a crossroads, caught between traditional warning signs of a market top and the promise of a technological revolution that could sustain economic expansion. Historical valuation models suggest a pullback is overdue, while economic resilience and AI’s transformative potential point toward continued growth.
Investors must carefully balance these perspectives. While prudence suggests recognizing the risks of excessive valuations, dismissing the possibility of a new economic paradigm could mean missing out on one of the most significant investment opportunities of our time. The answer may not be black and white. Instead, the best course of action is to stay adaptable, hedge against risks, and remain open to the possibility that we are witnessing the dawn of a new economic era—one where old valuation rules may no longer apply.

US Investor Sentiment
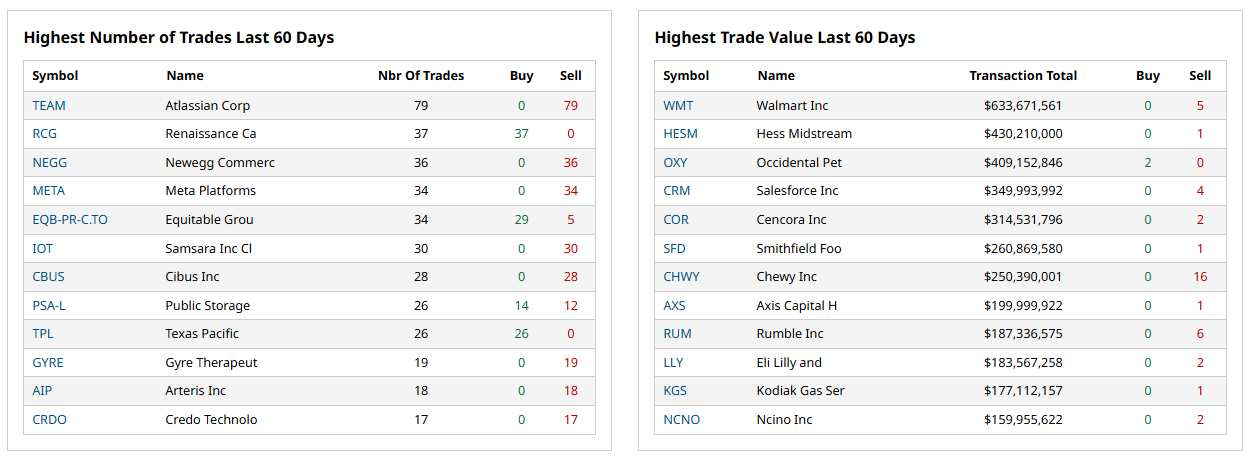
Insider Trading
Insider trading occurs when a company’s leaders or major shareholders trade stock based on non-public information. Tracking these trades can reveal insider expectations about the company’s future. For example, large purchases before an earnings report or drug trial results might indicate confidence in upcoming good news.
%Bull-Bear Spread
The %Bull-Bear Spread chart is a sentiment indicator that shows the difference between the percentage of bullish and bearish investors, often derived from surveys or sentiment data, such as the AAII (American Association of Individual Investors) sentiment survey. This spread tells investors about the prevailing mood in the market and can provide insights into market extremes and potential turning points.
Bullish or Bearish Sentiment:
When the spread is positive, it means more investors are bullish than bearish, indicating optimism about the market’s direction.
A negative spread indicates more bearish sentiment, meaning more investors expect the market to decline.
Contrarian Indicator:
The %Bull-Bear Spread is often used as a contrarian indicator. For example, extremely high levels of bullish sentiment might suggest that the market is overly optimistic and could be due for a correction.
Similarly, when bearish sentiment is extremely high, it might indicate that the market is overly pessimistic, and a rally could be on the horizon.
Market Extremes and Reversals:
Historically, extreme values of the spread (both positive and negative) can signal turning points in the market. A very high positive spread can signal market exuberance, while a very low or negative spread may indicate fear or capitulation.
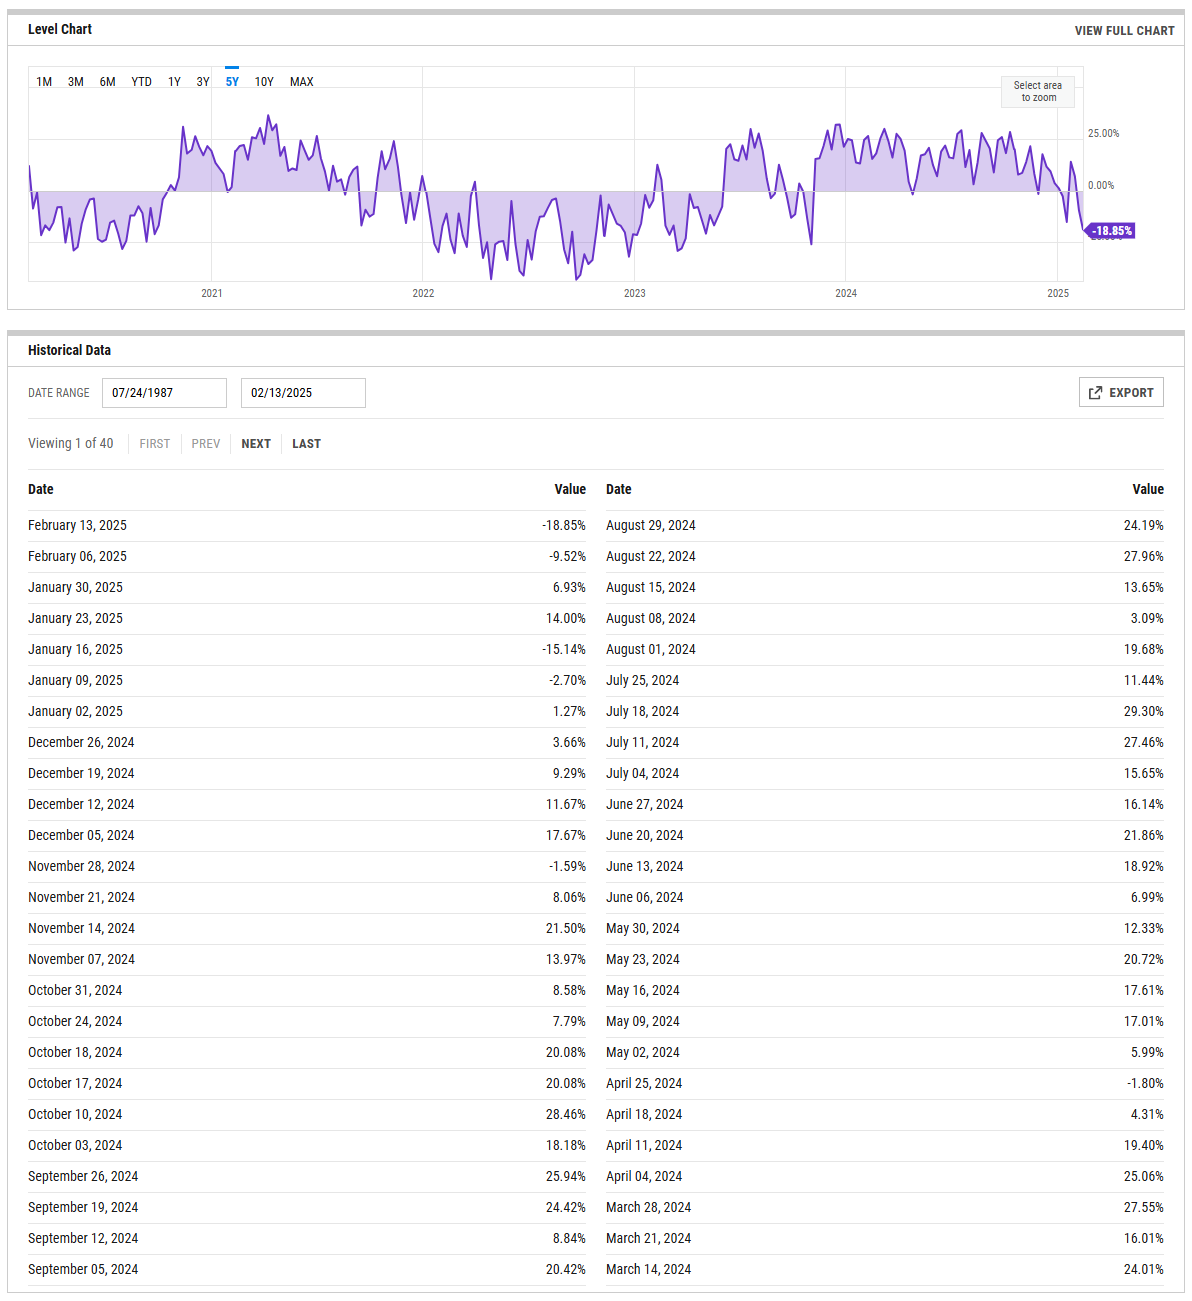
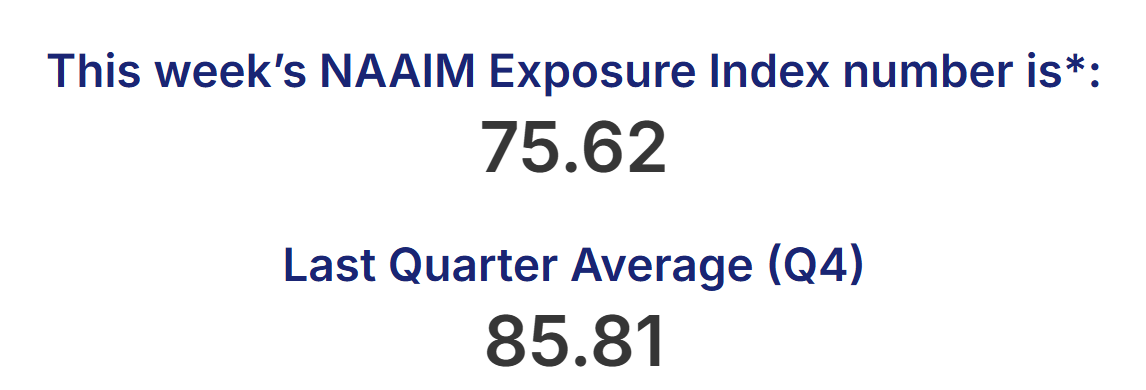
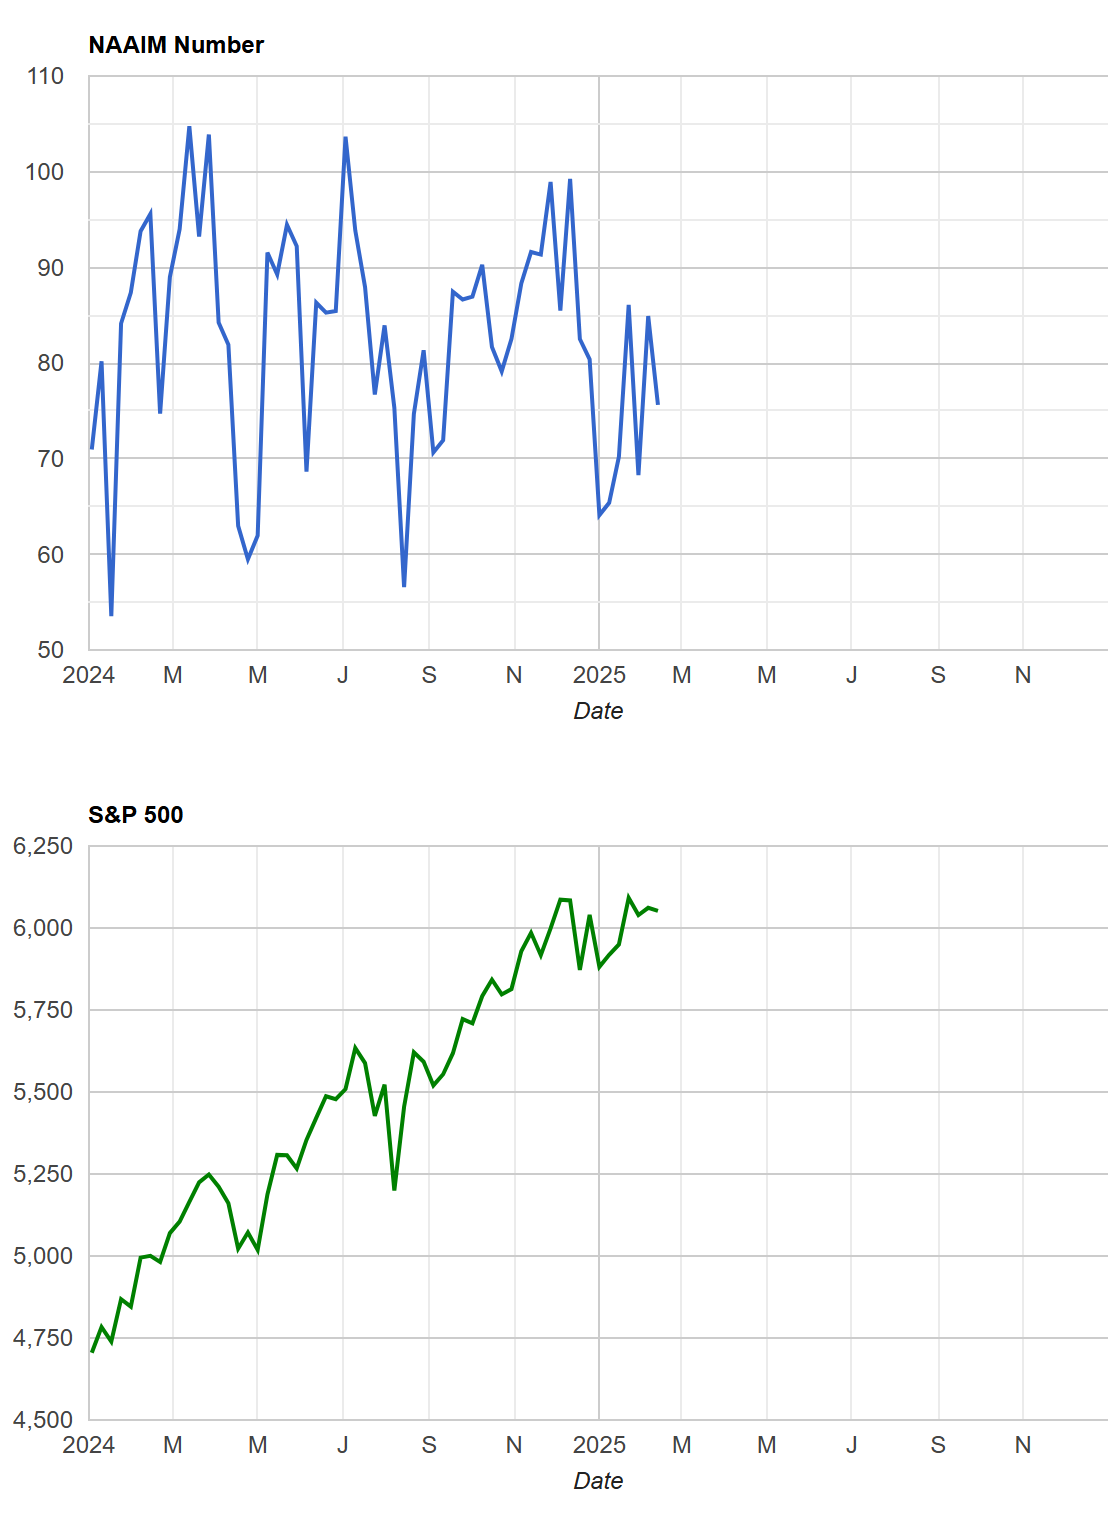
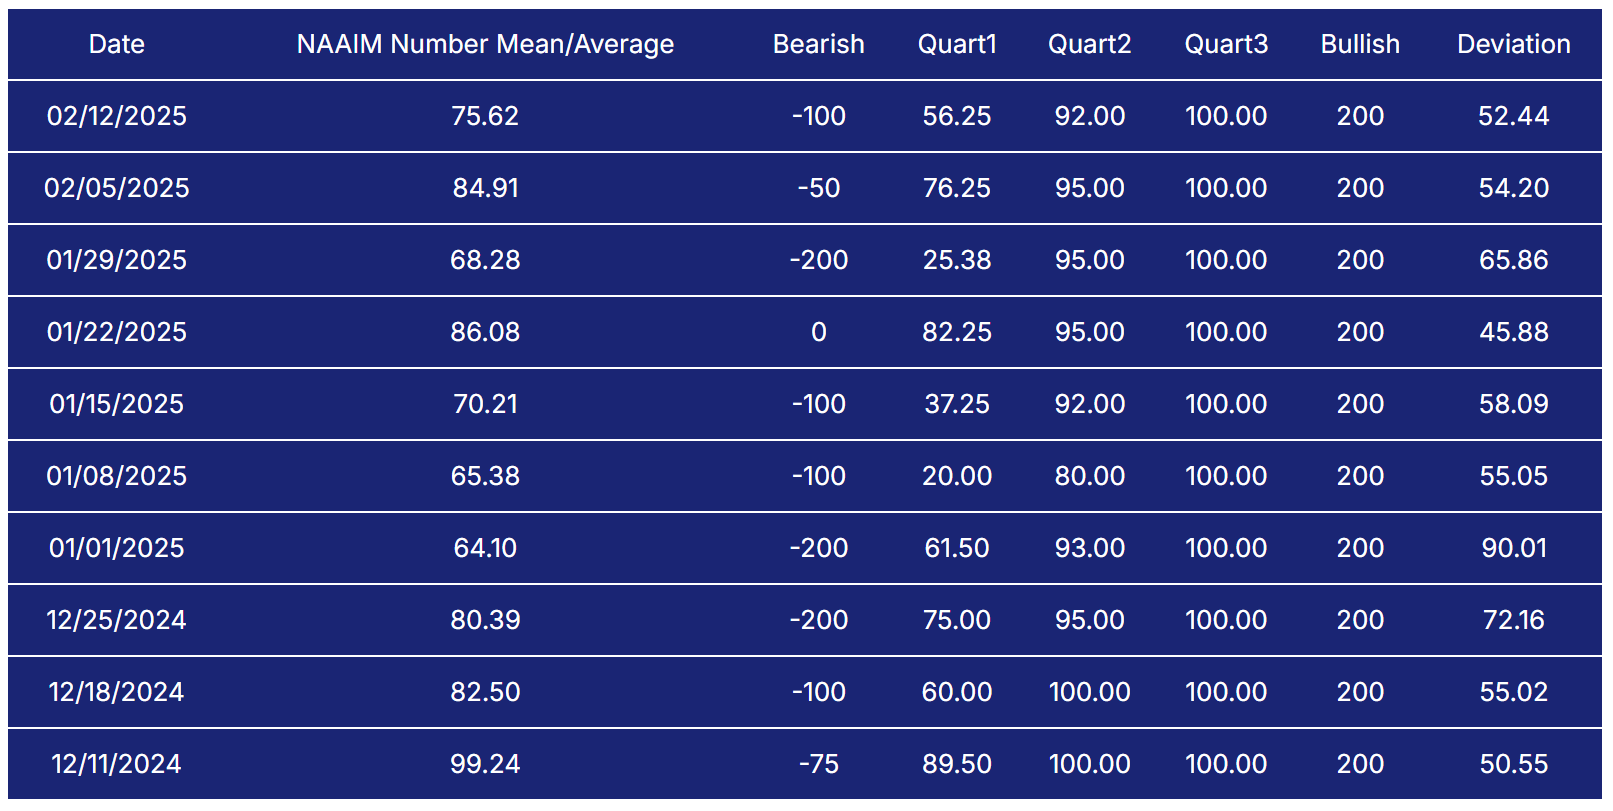
NAAIM Exposure Index
The NAAIM Exposure Index (National Association of Active Investment Managers Exposure Index) measures the average exposure to U.S. equity markets as reported by its member firms. These are typically active money managers who provide their equity exposure levels weekly. The index offers insight into how much these managers are investing in equities at any given time, ranging from being fully short (-100%) to leveraged long (up to +200%).
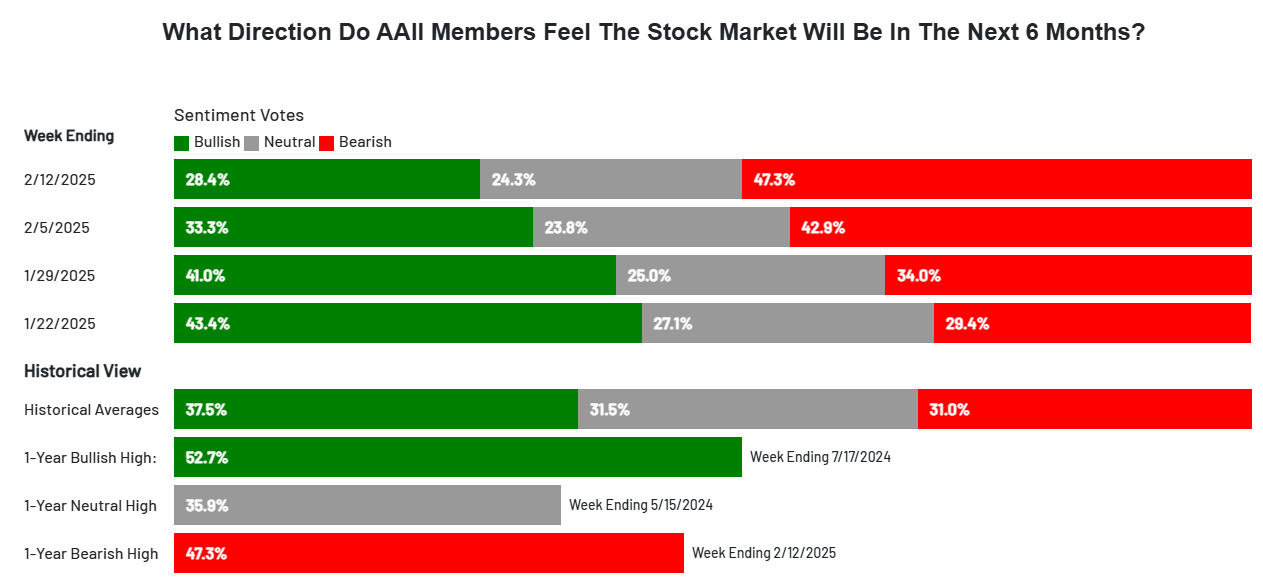
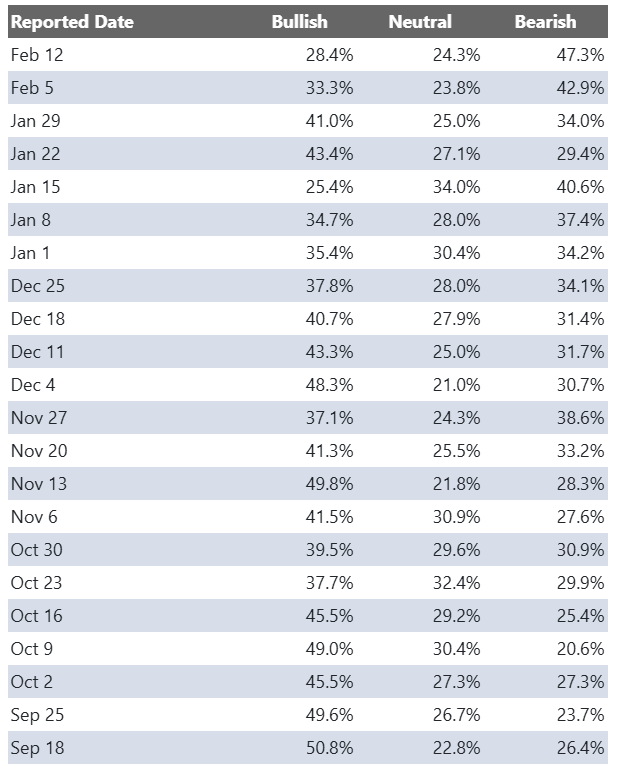
AAII Investor Sentiment Survey
The AAII Investor Sentiment Survey is a weekly survey conducted by the American Association of Individual Investors (AAII) to gauge the mood of individual investors regarding the direction of the stock market over the next six months. It provides insights into whether investors are feeling bullish (expecting the market to rise), bearish (expecting the market to fall), or neutral (expecting the market to stay about the same).
Key Points:
Bullish Sentiment: Reflects the percentage of investors who believe the stock market will rise in the next six months.
Bearish Sentiment: Represents those who expect a decline.
Neutral Sentiment: Reflects investors who anticipate little to no market movement.
The survey is widely followed as a contrarian indicator, meaning that extreme levels of bullishness or bearishness can sometimes signal market turning points. For example, when a large number of investors are overly optimistic (high bullish sentiment), it could suggest a market top, while excessive pessimism (high bearish sentiment) may indicate a market bottom is near.
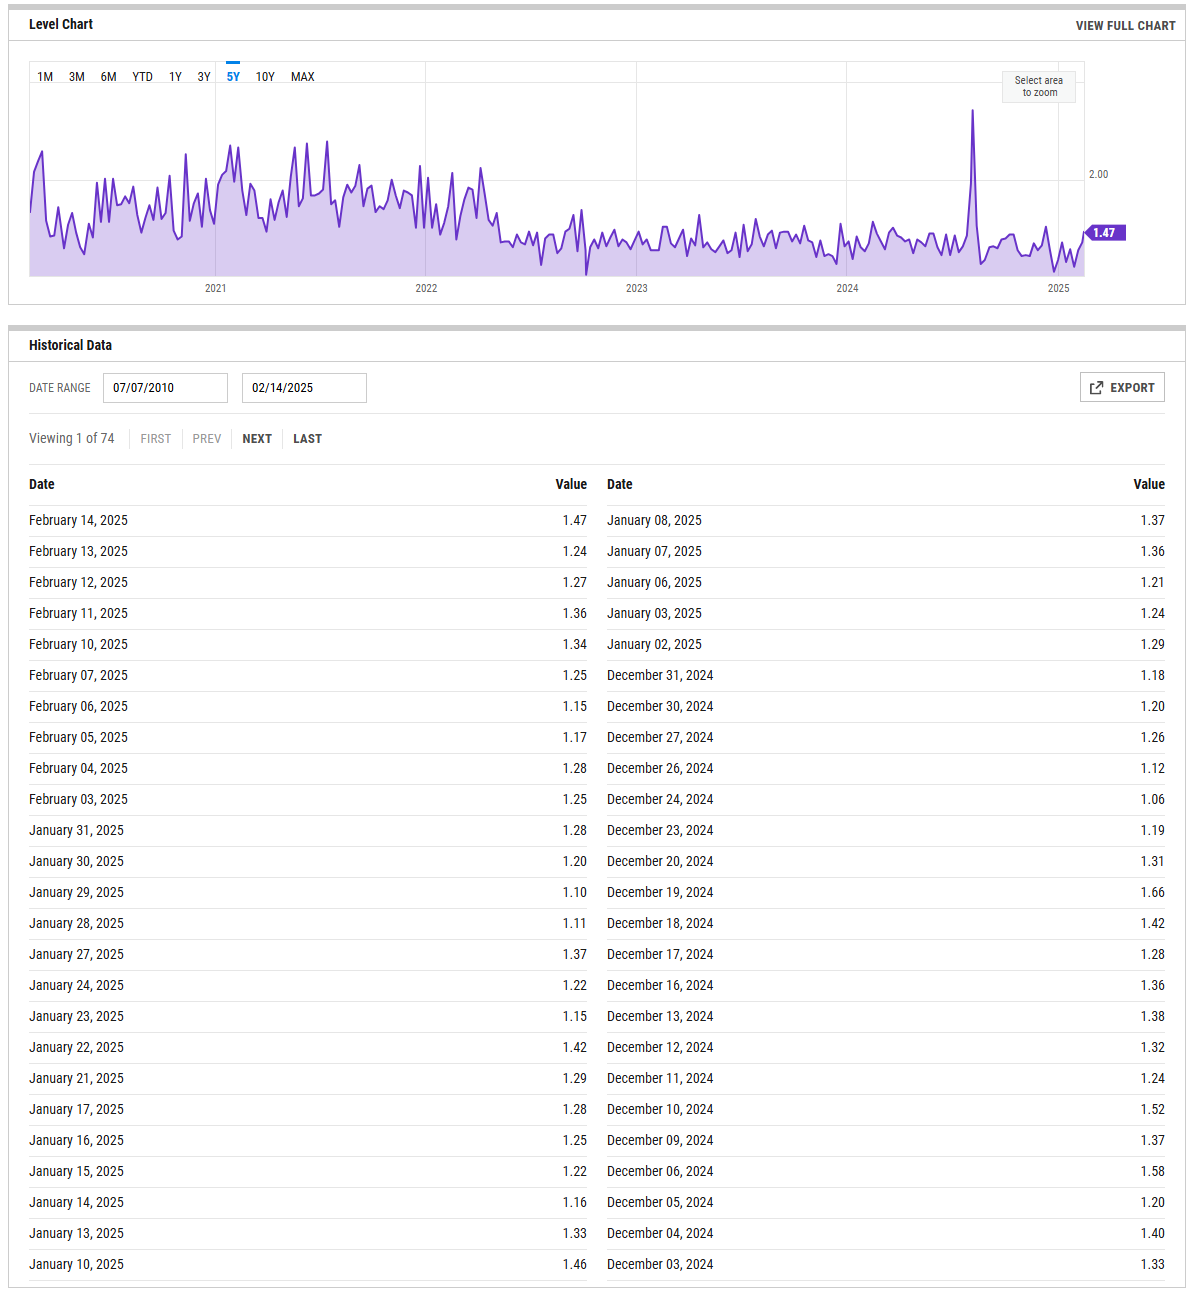
SPX Put/Call Ratio
The SPX Put/Call Ratio is an indicator that is used to gauge market sentiment. This is calculated as the ratio between trading S&P 500 put options and S&P call options. A high put/call ratio can indicate fear in the markets, while a low ratio indicates confidence. For example, in 2015, the Put-Call ratio was as high as 3.77 because of market fears stemming from various global economic issues like a GDP growth slowdown in China and a Greek debt default.
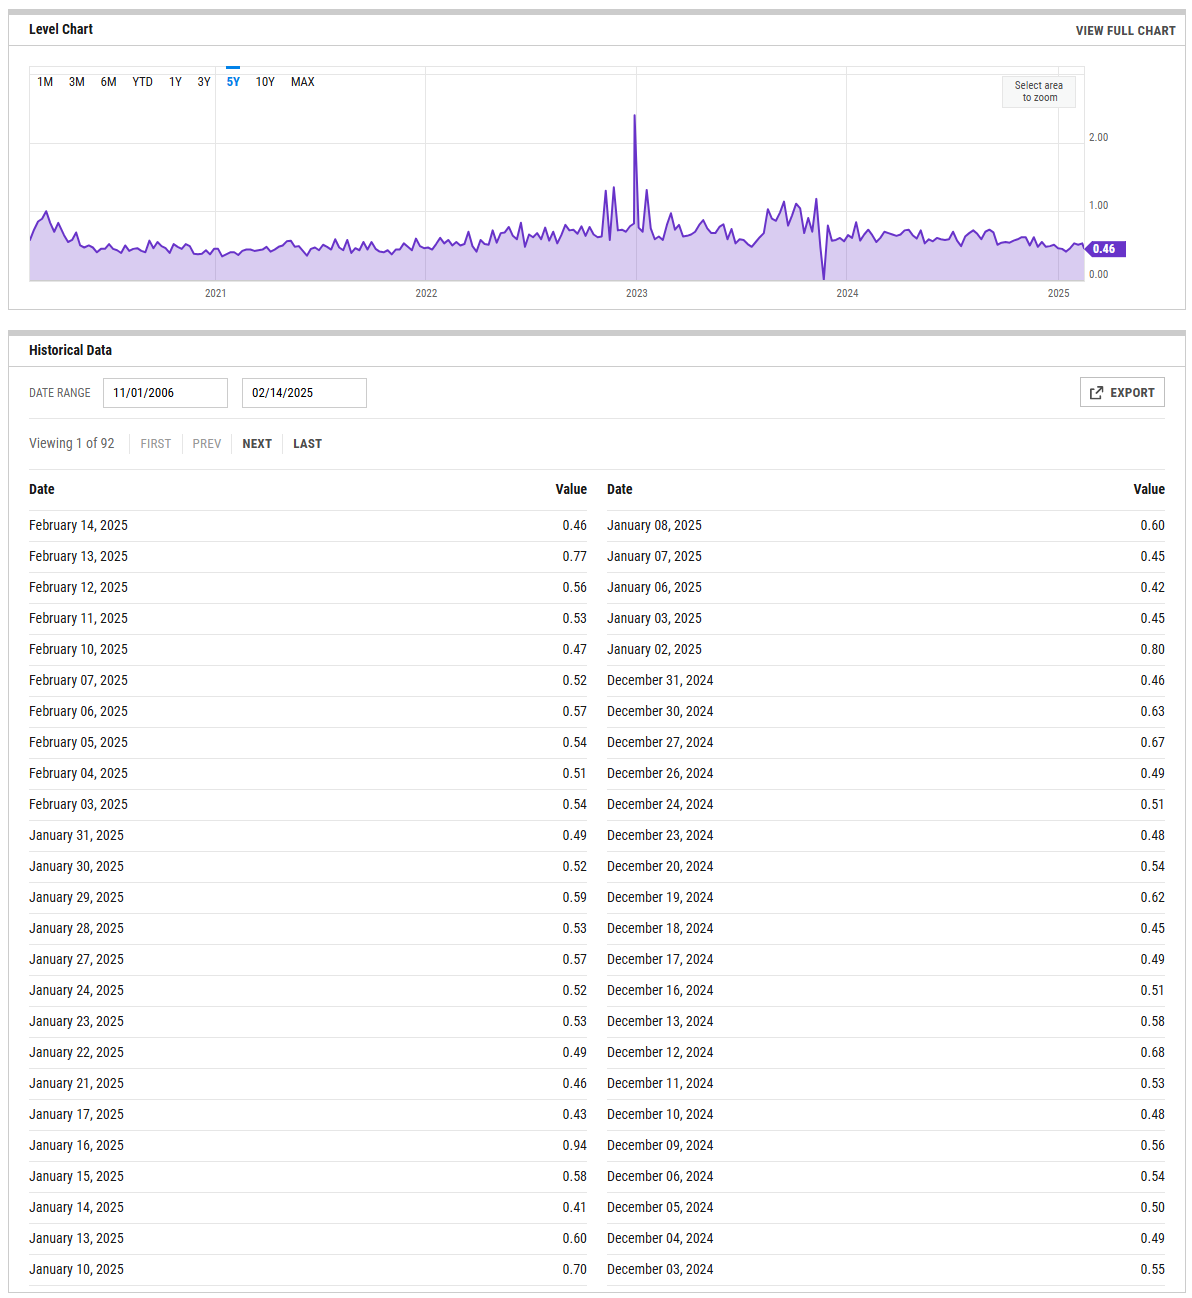
CBOE Equity Put/Call Ratio
The CBOE (Chicago Board Options Exchange) equity put/call ratio is a sentiment indicator used by traders and analysts to gauge market sentiment and potential shifts in investor behavior. It is calculated by dividing the volume of put options by the volume of call options on equities. Here’s what it reveals and how it is generally interpreted:
High Put/Call Ratio: When the put/call ratio is high (above 1.0), it suggests that there is more demand for put options than call options. This typically reflects a more bearish sentiment, as investors may be hedging against potential declines or expecting the market to fall.
Low Put/Call Ratio: Conversely, a low put/call ratio (below 0.7) indicates a higher volume of call options compared to puts, reflecting bullish sentiment. Investors may be expecting upward momentum and are positioning themselves to profit from price gains
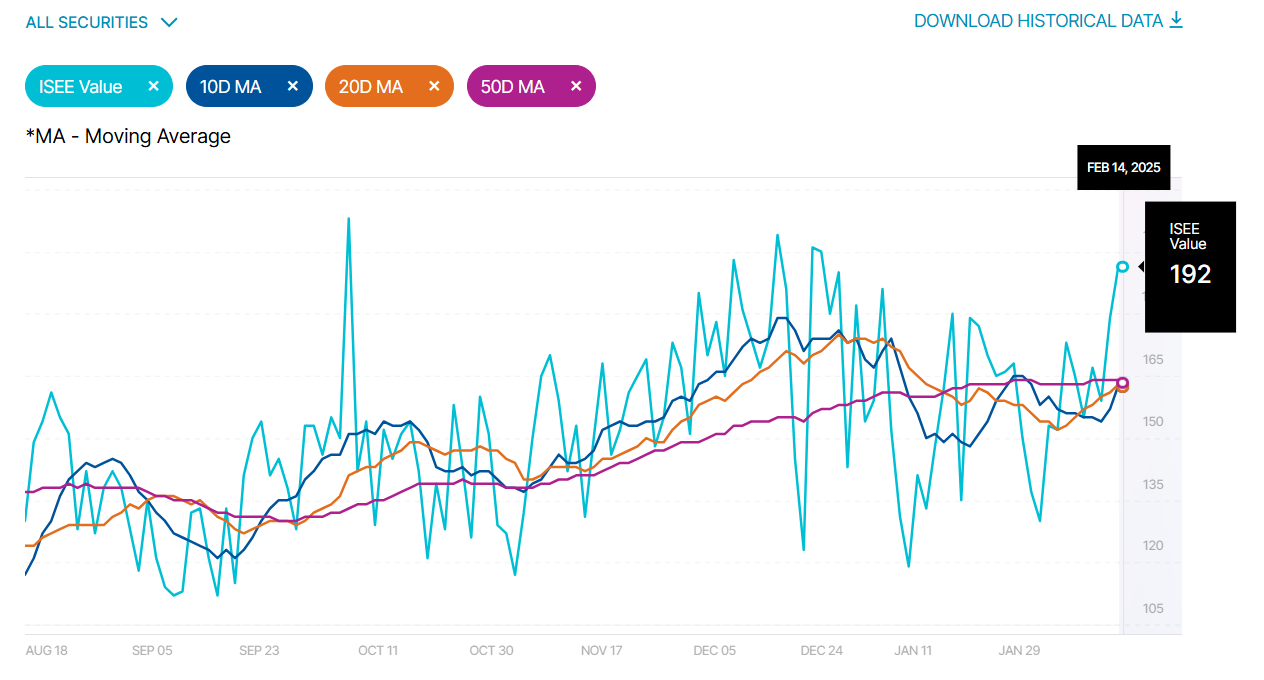
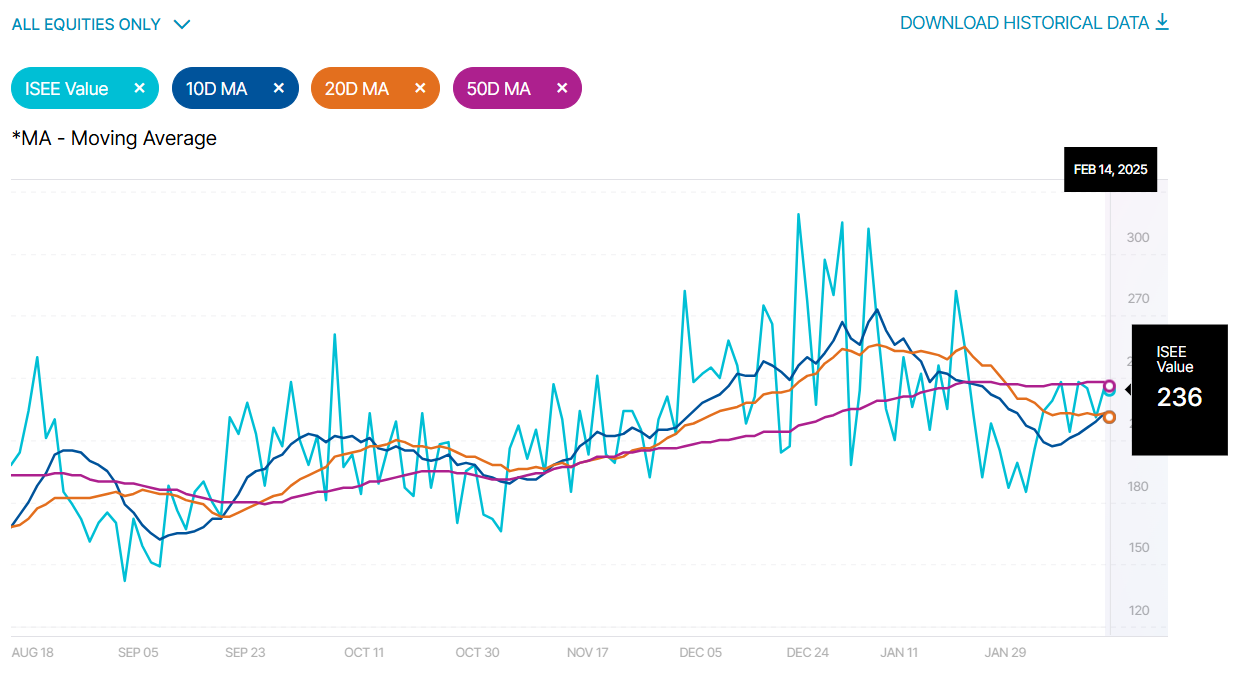
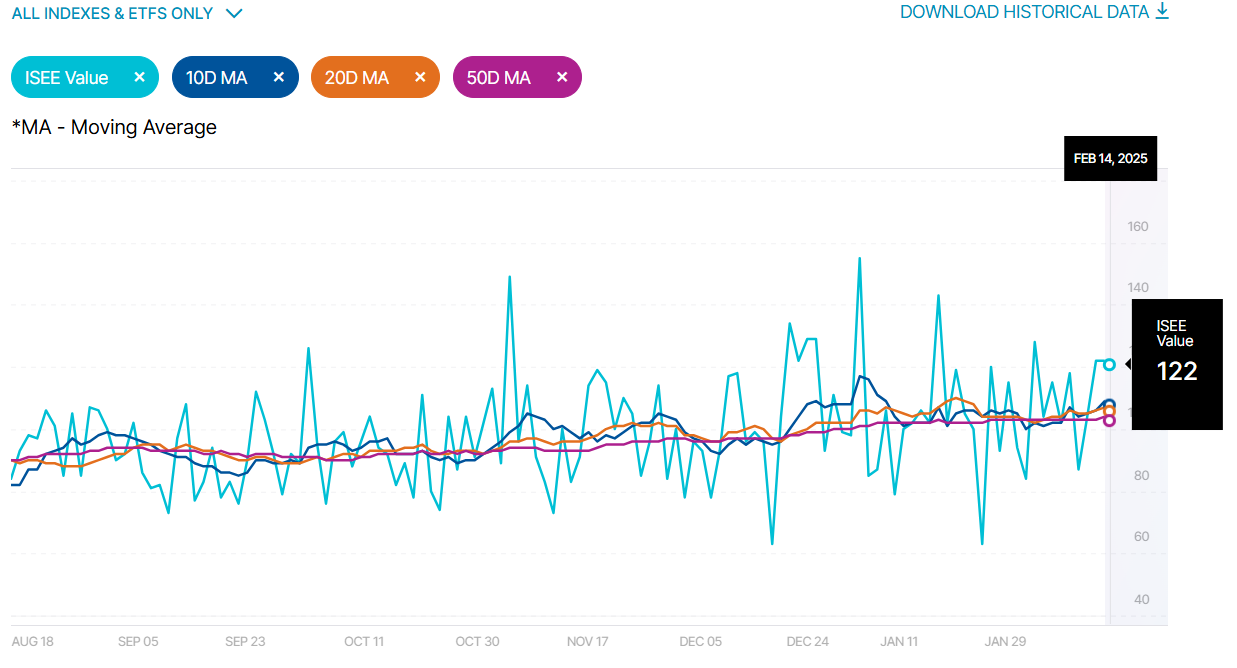
ISEE Sentiment Index
The ISEE (International Securities Exchange Sentiment) Index is a measure of investor sentiment derived from options trading. Unlike traditional put/call ratios, the ISEE Index focuses only on opening long customer transactions and is adjusted to remove market-maker and firm trades, providing a purer sentiment reading.
The ISEE Index typically ranges from 0 to 200, with readings above 100 indicating more call options being bought relative to put options, suggesting bullish sentiment. Conversely, readings below 100 suggest bearish sentiment, with more puts being purchased relative to calls.
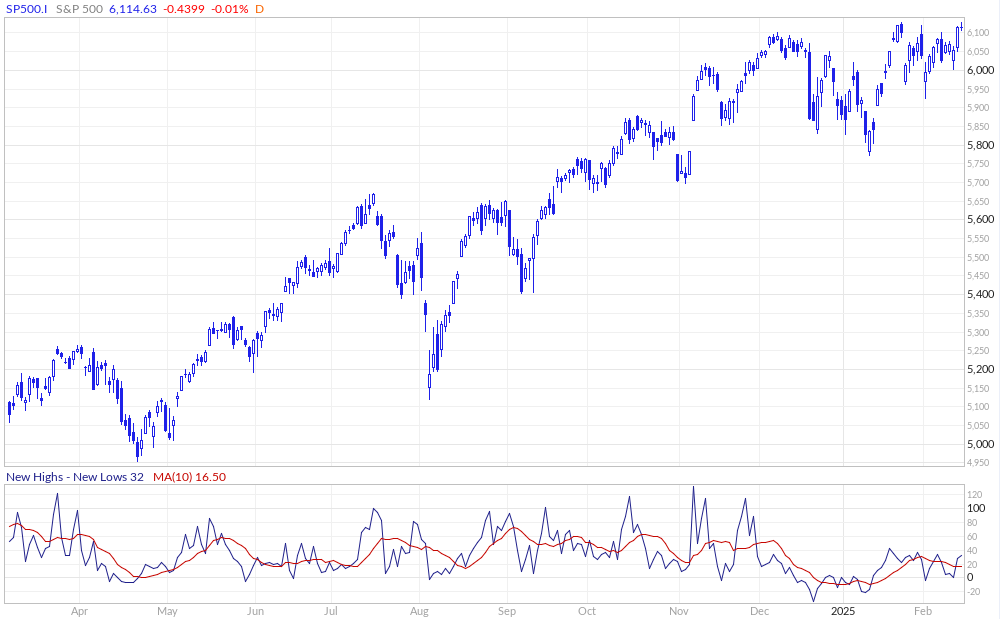
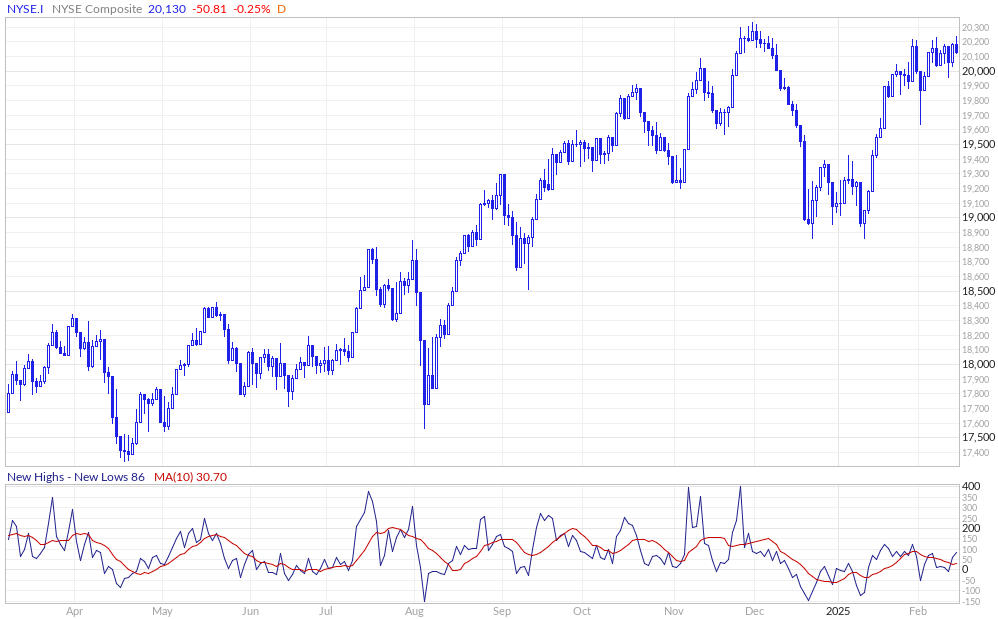
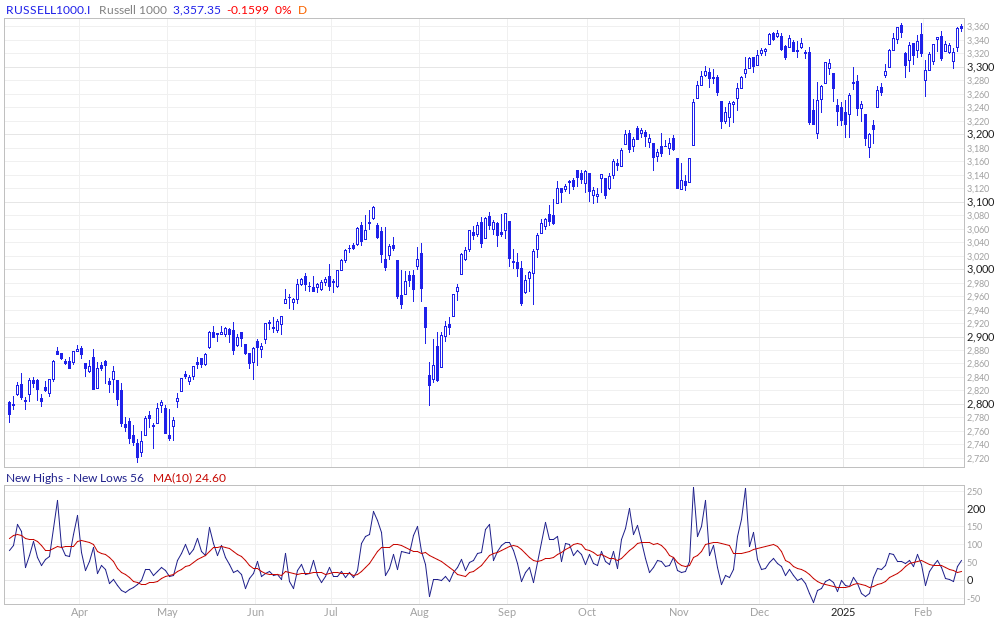
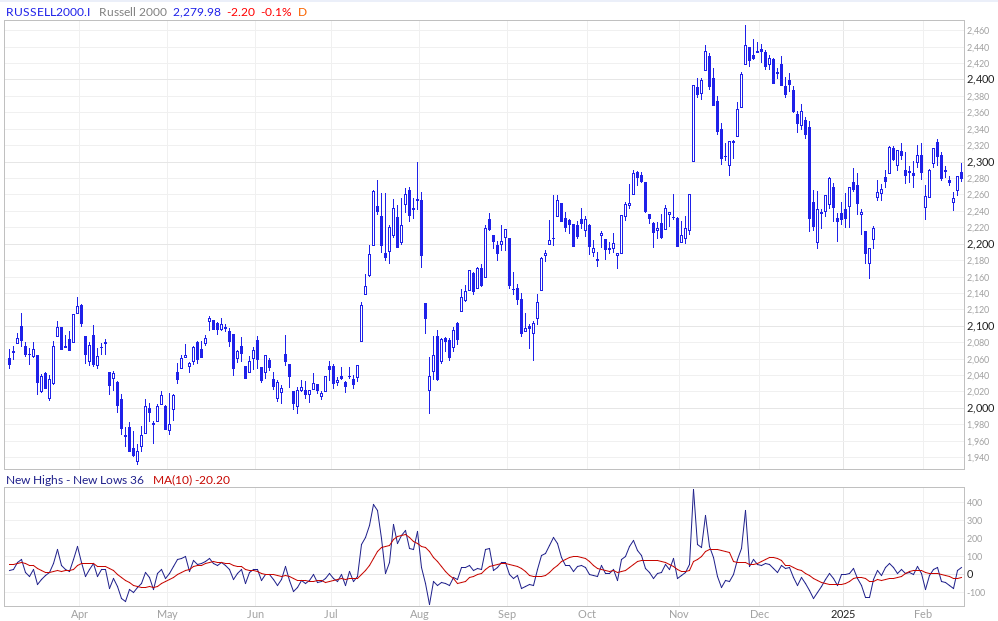
New Highs - New Lows
The New Highs - New Lows indicator (NH-NL) displays the daily difference between the number of stocks reaching new 52-week highs and the number of stocks reaching new 52-week lows. The NH-NL indicator generally reaches its extreme lows slightly before a major market bottom. As the market then turns up from the major bottom, the indicator jumps up rapidly. During this period, many new stocks are making new highs because it's easy to make a new high when prices have been depressed for a long time. The NH-NL indicator oscillates around zero. If the indicator is positive, the bulls are in control. If it is negative, the bears are in control. As the cycle matures, a divergence often occurs as fewer and fewer stocks are making new highs (the indicator falls), yet the market indices continue to reach new highs. This is a classic bearish divergence that indicates that the current upward trend is weak and may reverse.
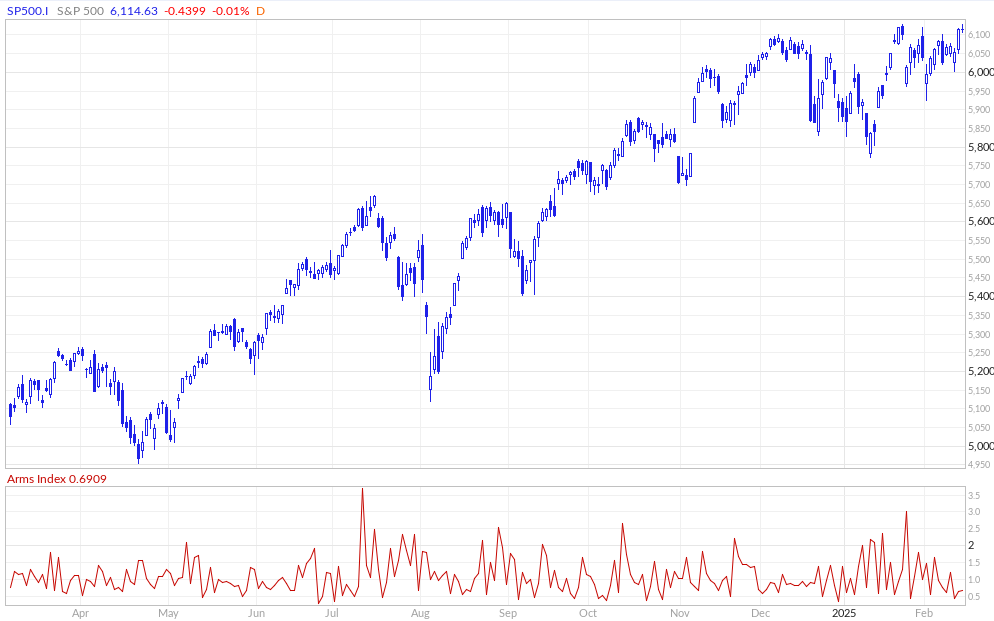
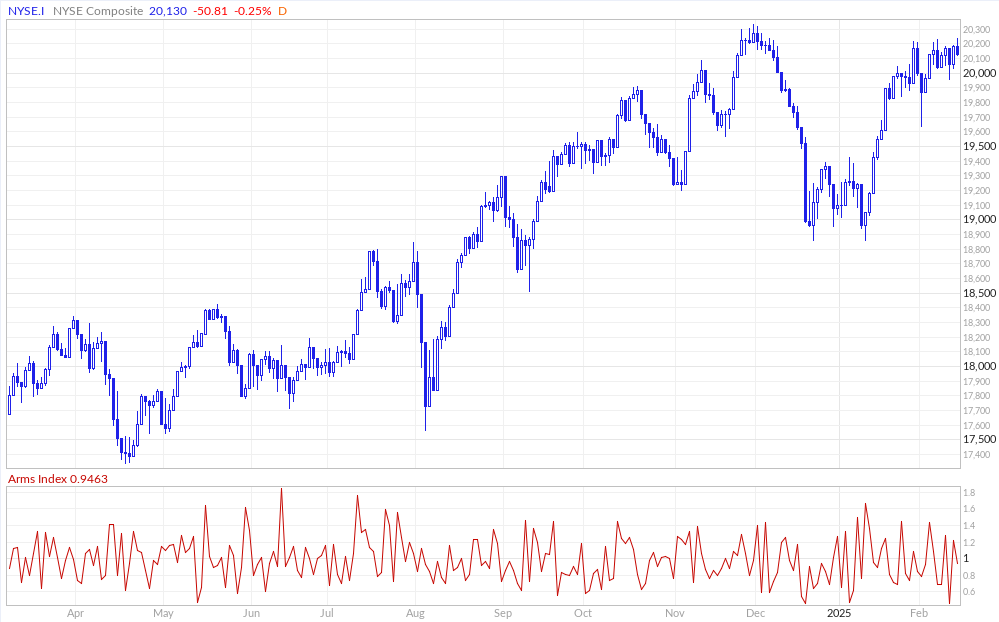
ARMS Index
The Arms Index, also known as the TRIN (Short-Term TRading INdex), was developed by Richard Arms in the 1960s. It is calculated by dividing the ratio of advancing stocks to declining stocks by the ratio of advancing volume to declining volume. Interpreting the Arms Index involves looking at its value in relation to certain thresholds. A value below "1" is considered bullish, indicating that advancing stocks and volume dominate the market. Conversely, a value above "1" is considered bearish, suggesting that declining stocks and volume are more prevalent. Extremely low values (below 0.5) or high values (above 2) are often seen as potential reversal signals.

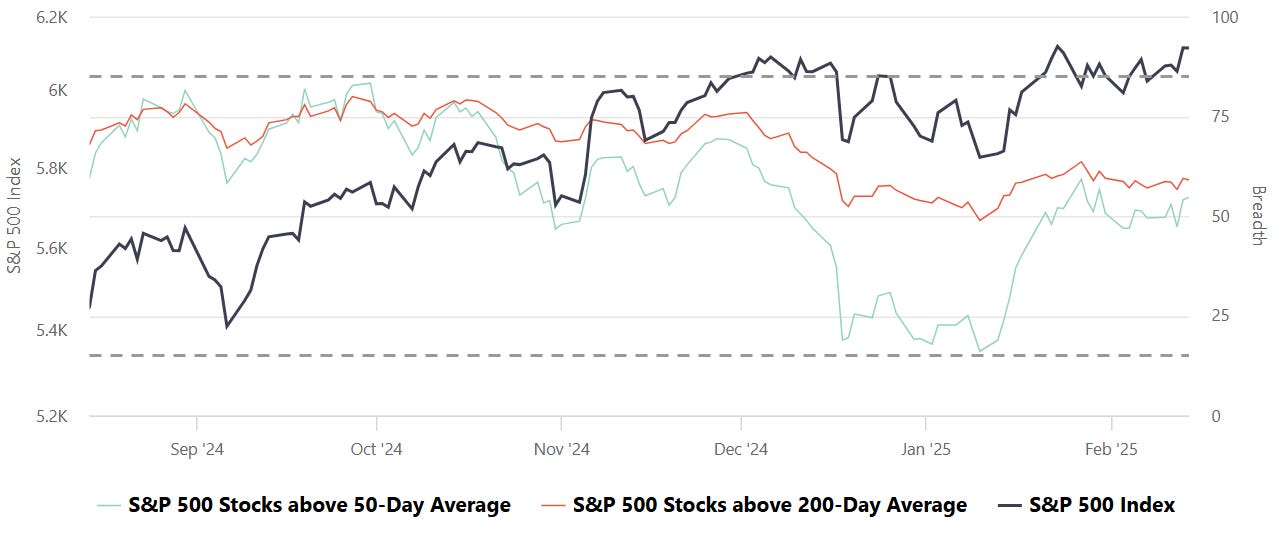
S&P Breadth
Breadth, in the context of stock market analysis, refers to the measure of how many stocks in a given index (such as the S&P 500) are participating in a trend, such as advancing or declining relative to a certain moving average (e.g., 50-day or 200-day).
Market Strength Assessment:
Breadth provides insight into whether a market rally or decline is broad-based or driven by only a few large-cap stocks. A rally supported by a high percentage of stocks above their 50-day or 200-day averages is generally considered healthier and more sustainable.
Early Warning Signals:
Divergences between breadth indicators and the index price can signal potential reversals. For example:
If the index is rising, but the number of stocks above their moving averages is declining, it may indicate weakening underlying strength and potential for a pullback.
Conversely, if breadth improves while the index remains flat or declines, it may suggest accumulating strength for a future rally.
Trend Confirmation:
Breadth indicators can confirm trends. For instance, a strong majority of stocks above their moving averages signals robust market momentum, providing confidence in the prevailing trend.
Identifying Overbought or Oversold Conditions:
Extremely high or low breadth readings can signal overbought or oversold conditions, which might lead to mean reversion. For example:
If nearly all stocks are above their 50-day or 200-day averages, it may suggest overbought conditions.
Conversely, extremely low levels indicate oversold conditions and potential for a bounce.
Breadth and Timing Investments:
Entry Points:
When breadth improves (e.g., more stocks move above their 50-day or 200-day moving averages) after a market pullback, it can indicate a good time to start building positions as the broader market is regaining strength.
Exit Points:
Breadth deterioration during a rally may suggest it’s time to reduce exposure, especially if only a small number of stocks are driving index gains. This is often a warning sign of an impending correction.
Volatility and Risk Management:
Weak breadth in volatile markets may prompt caution or defensive positioning. Conversely, improving breadth can justify taking on more risk during uptrends.
CME Fedwatch
What is the likelihood that the Fed will change the Federal target rate at upcoming FOMC meetings, according to interest rate traders? Use CME FedWatch to track the probabilities of changes to the Fed rate, as implied by 30-Day Fed Funds futures prices.
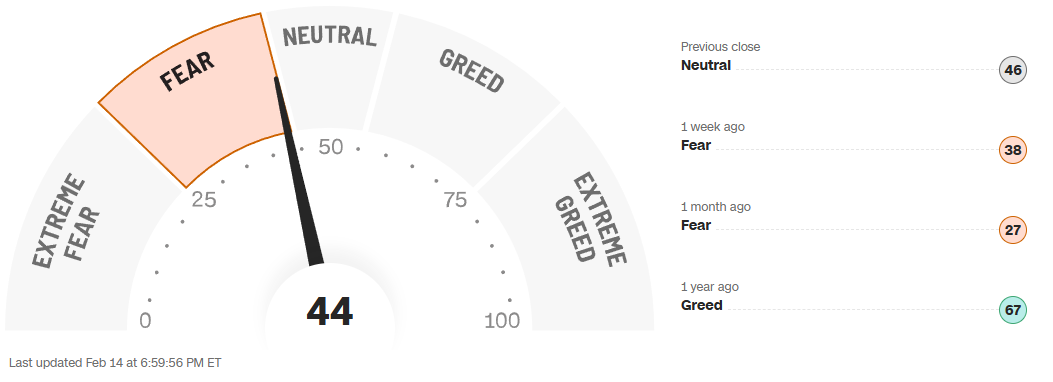
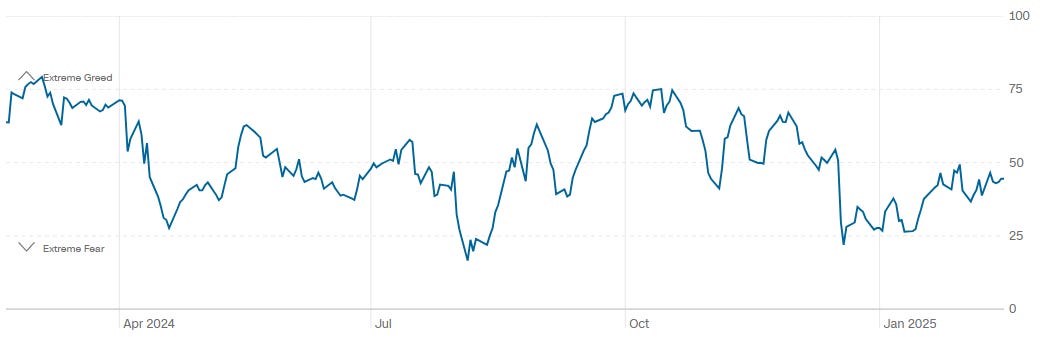
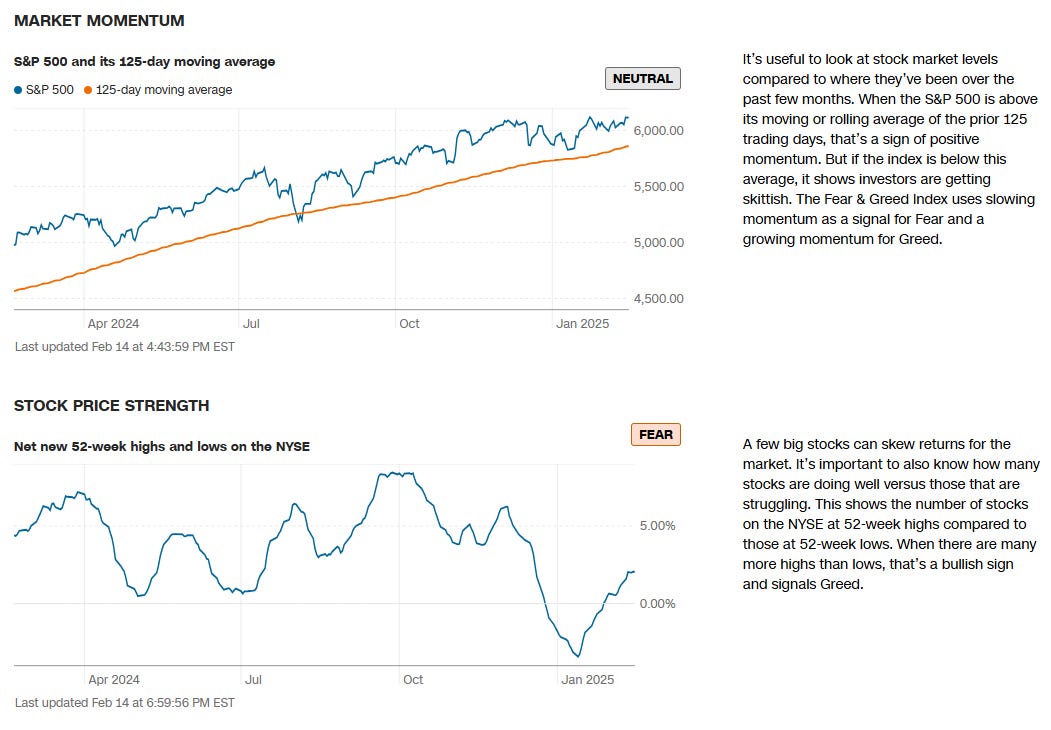
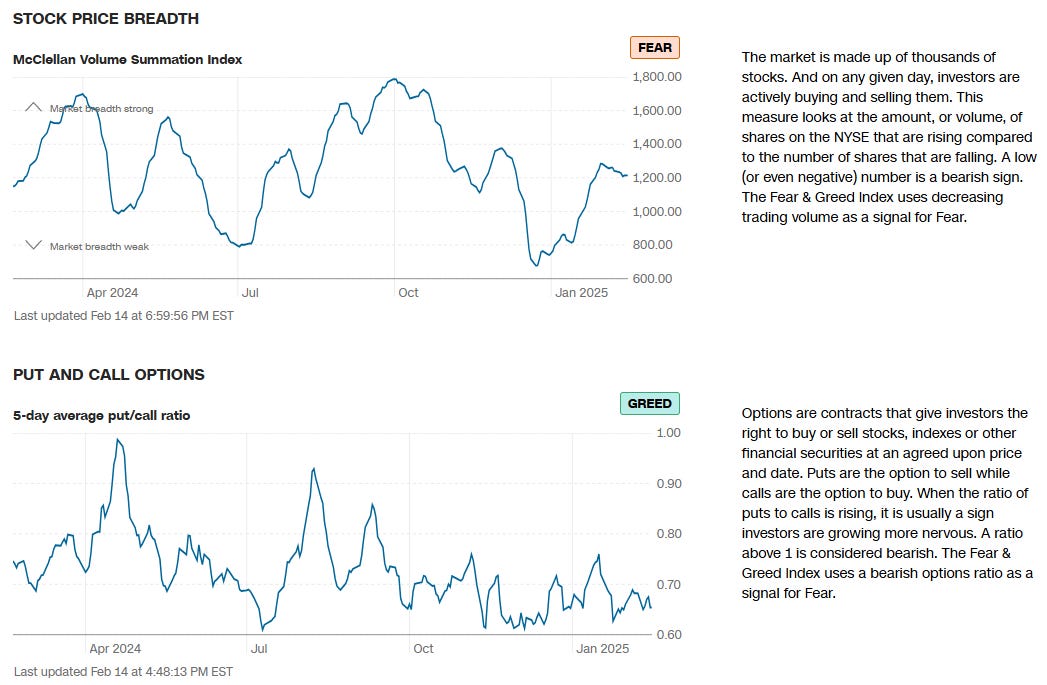
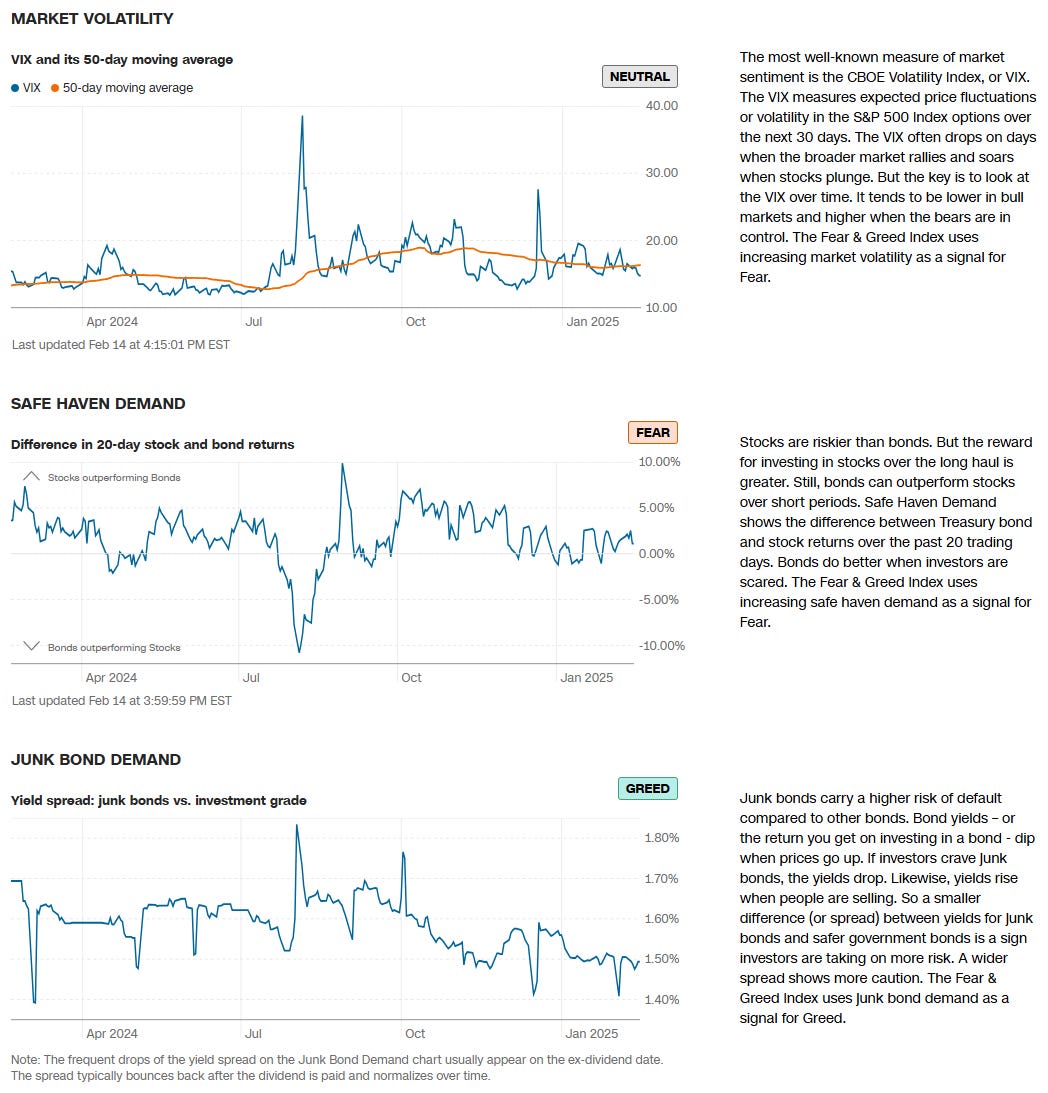
CNN Fear & Greed Constituent Data Points & Composite Index
Institutional S/R Levels for Major Indices
When you’re a large institutional player, your primary goal is to find liquidity - places to do a ton of business with the least amount of slippage possible. VolumeLeaders.com automatically identifies and visually plots the exact spots where institutions are doing business and where they are likely to return for more. It’s one of the primary reasons “support” and “resistance” concepts work and truly one of the reasons “price has memory”.
Levels from the VolumeLeaders.com platform can help you formulate trades theses about:
Where to add or take profit
Where to de-risk or hedge
What strikes to target for options
Where to expect support or resistance
And this is just a small sample; there are countless ways to leverage this information into trades that express your views on the market. The platform covers thousands of tickers on multiple timeframes to accommodate all types of traders. Observe for yourself how accurate the levels are by marking-up your charts with the information in the “Trade Levels” boxes and play-along in real-time this week.
SPY 0.03%↑
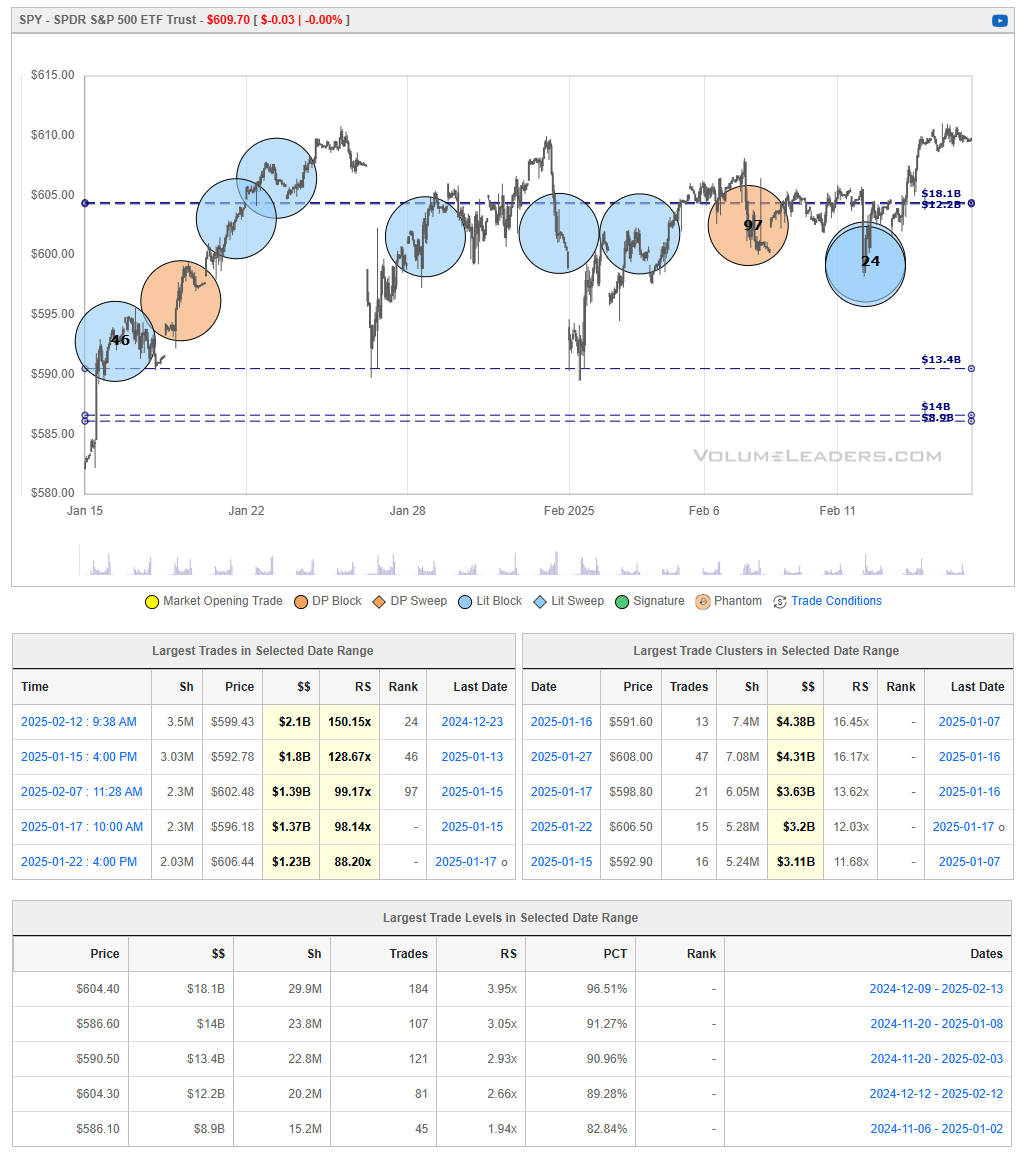
SPY has rebounded sharply off its late‐January lows, repeatedly challenging the $600–$605 area where significant institutional trades have clustered. After briefly consolidating, price climbed above $605 and pressed up toward the $610 region—an area that previously capped upside attempts.
If buyers can maintain momentum above $600–$605 and break decisively through $610, that would signal renewed bullish strength and potentially open the way for higher targets. Conversely, a break back below $600 raises the prospect of further consolidation or a pullback toward the mid‐$590s. Overall, SPY’s ability to hold these key volume‐based zones will likely determine its next directional move.
QQQ -0.01%↓
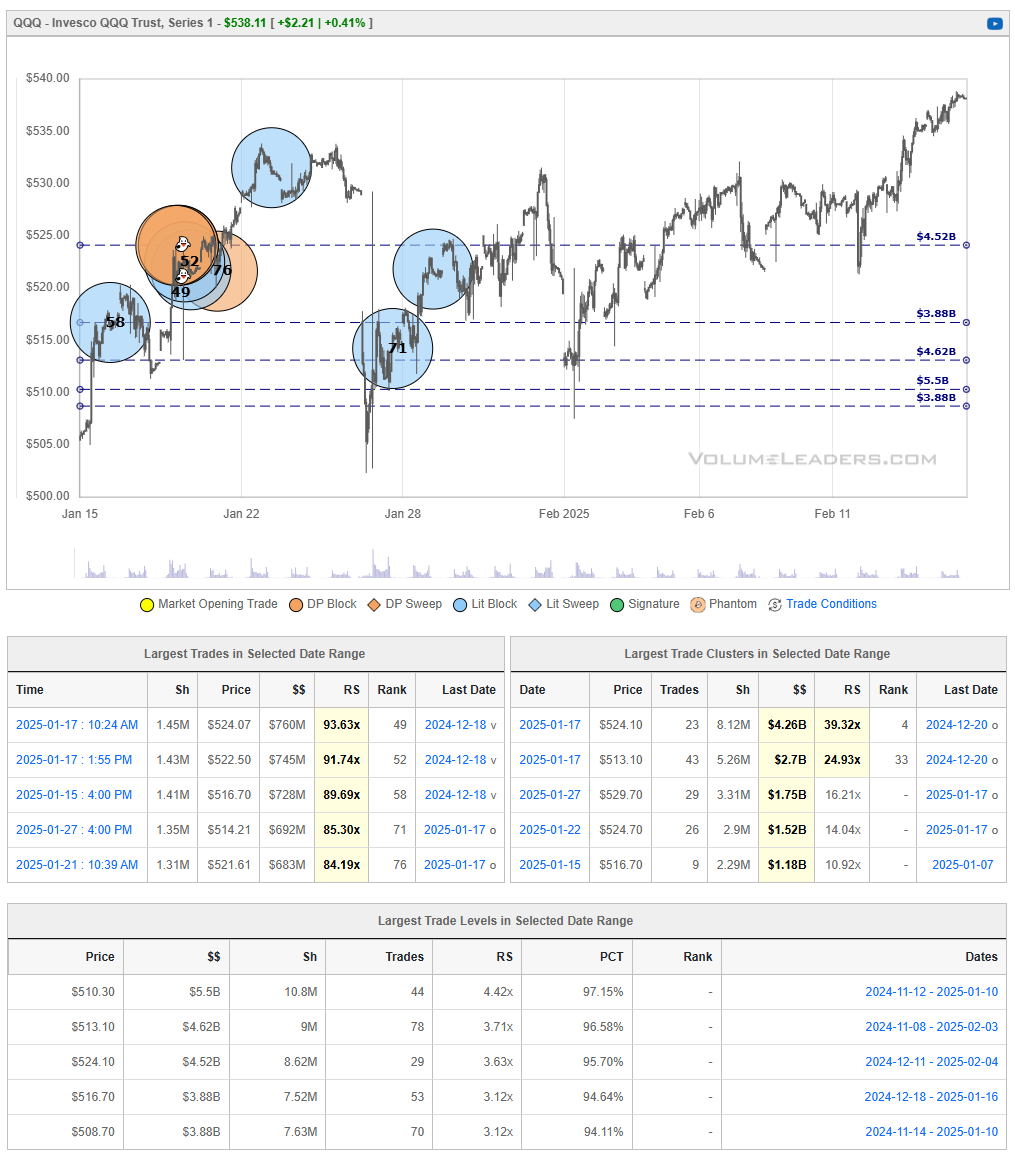
QQQ has made a strong push above prior resistance in the $515–$525 region, indicating that buyers have effectively absorbed supply at those lower levels. The ETF recently climbed into the mid‐$530s and continues to hold its gains, suggesting robust bullish momentum.
If QQQ can remain above the $530 area, it keeps the door open for a further advance toward higher price objectives. However, a retreat back below $525 would hint that the latest surge may be running out of steam, potentially leading to a pullback toward prior support zones near $515–$520.
IWM 0.00%↑
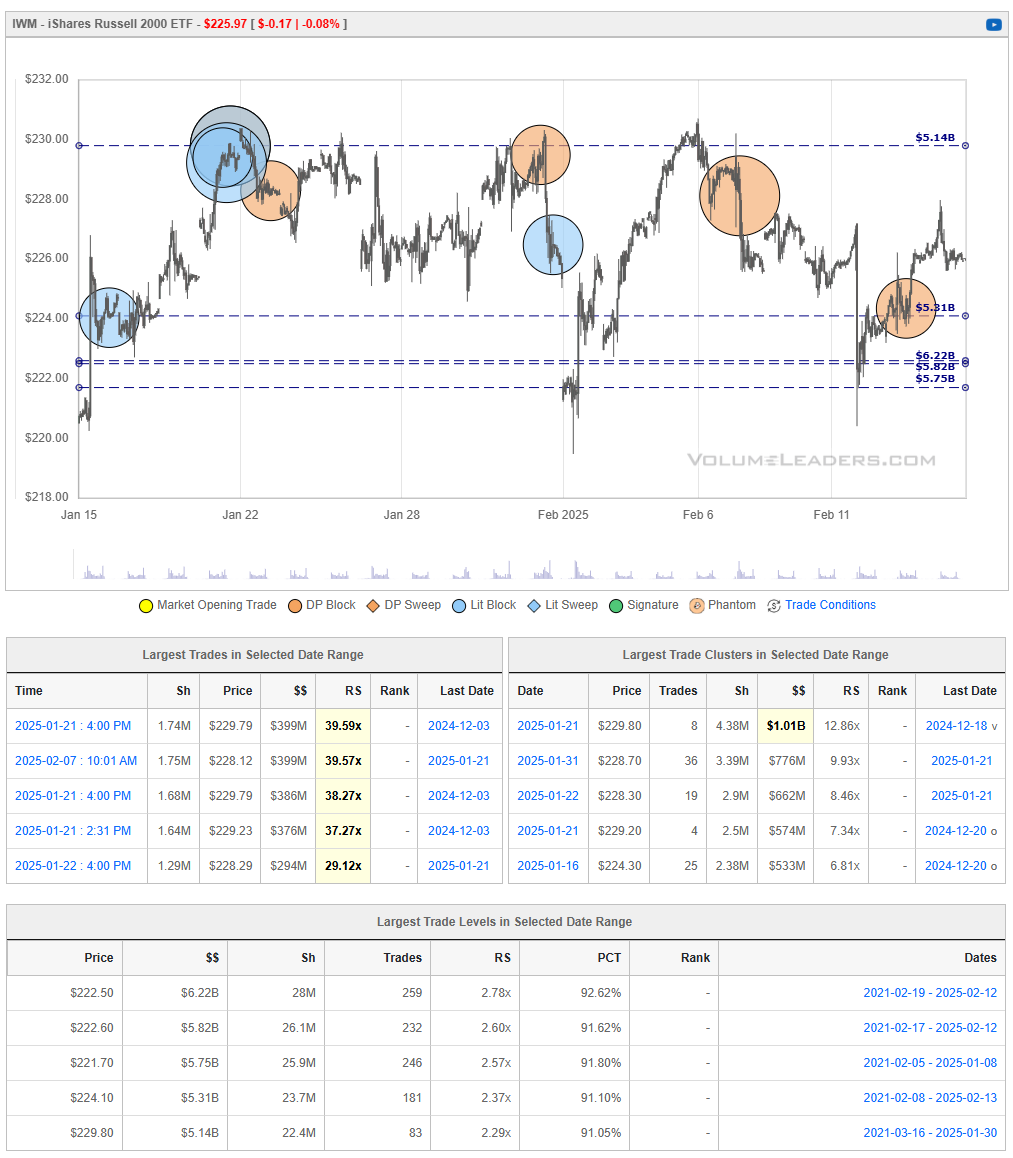
IWM remains locked in a trading range between the upper boundary near $230–$232 and lower support around $220–$222. After failing to break and hold above the $230 mark, the ETF has drifted toward the mid‐$220s, where buying activity has periodically emerged. Should IWM push decisively above $230, it would signal that buyers have absorbed overhead supply and could target higher levels. Conversely, a break below $222 would indicate that sellers are regaining control, opening the door to a deeper pullback into the low $220s—or even below, if momentum accelerates.
DIA 0.00%↑
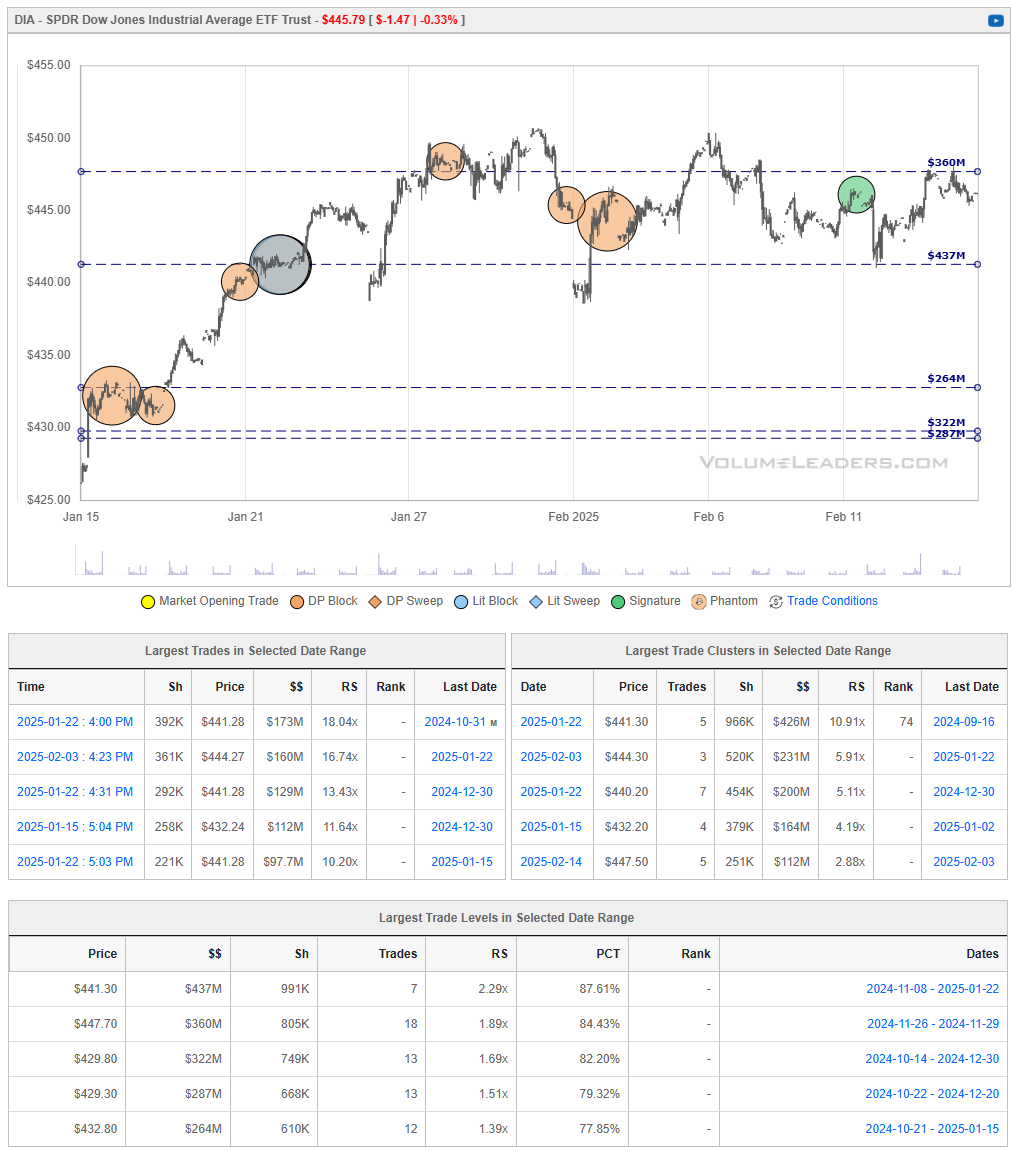
DIA remains in a broad consolidation after its January rally stalled in the mid‐$450s. The ETF has repeatedly tested and bounced between roughly $435 and $450, suggesting a tug‐of‐war between buyers and sellers in those zones. Most recently, DIA found some support around the mid‐$430s and then attempted to reclaim the $445–$447 area, where heavy institutional trades may again create resistance.
A decisive break above $450 would indicate buyers have absorbed the remaining overhead supply, potentially fueling a run back toward January’s highs. On the other hand, a move below $440–$435 support would suggest sellers are regaining momentum, raising the risk of a deeper pullback toward the lower $430s—or even below, if downside pressure accelerates.
Institutional Order Flow
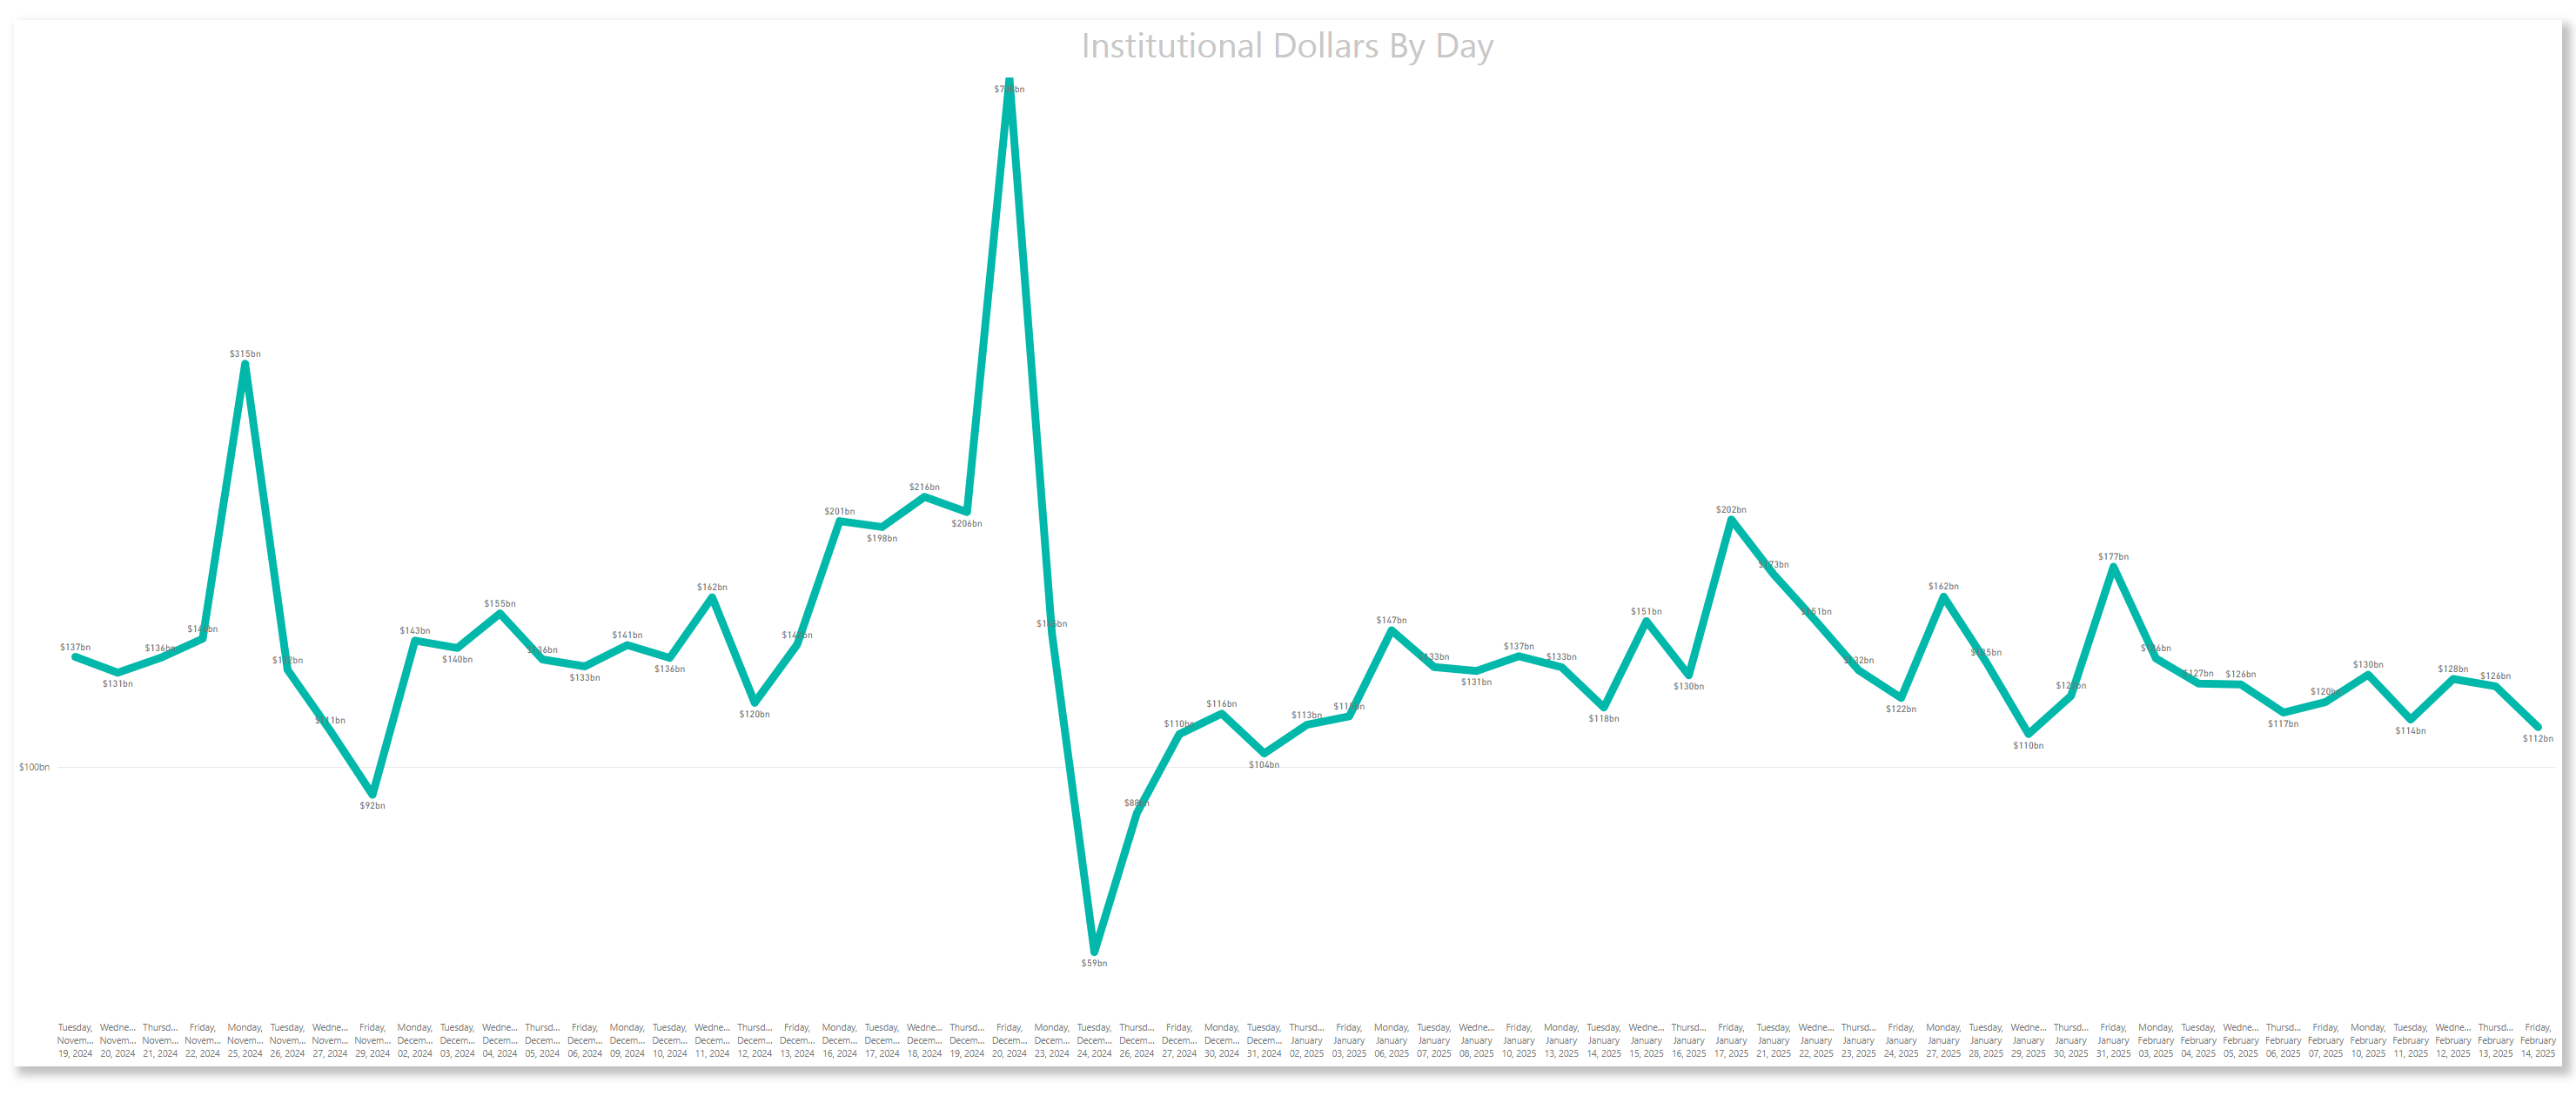
Rolling 90-Day Dollars By Day
This chart shows institutional activity by dollars by day on a rolling 1-year basis. From a theoretical standpoint, examining a chart of daily institutional dollar activity over the course of a year can offer several insights and possible inferences, though all should be approached with caution since the data alone may not prove causality or confirm underlying reasons. Some potential takeaways include:
Event-Driven Behavior:
Sharp, singular spikes on certain days might correlate with major market-moving events. These could include central bank policy announcements, significant geopolitical news, sudden macroeconomic data releases (like employment reports or GDP data), earnings seasons for large-cap companies, or unexpected shocks (e.g., mergers, acquisitions, regulatory changes).Liquidity Dynamics:
Institutions often concentrate large trades on days with higher expected liquidity. For instance, heightened activity might coincide with index reconstitutions, option expiration dates, or the days leading up to or following a major index rebalance, when large amounts of capital shift hands simultaneously.Risk Management and Hedging Activity:
Institutions may significantly adjust their exposures on days that are critical from a risk management perspective. Large spikes can occur if hedge funds, pension funds, or asset managers are rolling over futures contracts, initiating or closing out large hedges, or reacting to volatility triggers.Market Sentiment Indicators:
While the data is purely transactional, the sheer volume of institutional involvement on certain days might indirectly hint at changing sentiment or strategic shifts.
In essence, a chart like this can lead you to hypothesize that institutional trading volumes are not constant or random but rather influenced by a mix of predictable calendar effects, major market events, liquidity considerations, risk management decisions, and strategic allocation shifts.
Top Institutional Order Flow By Sector By Week For The Past 90-Days
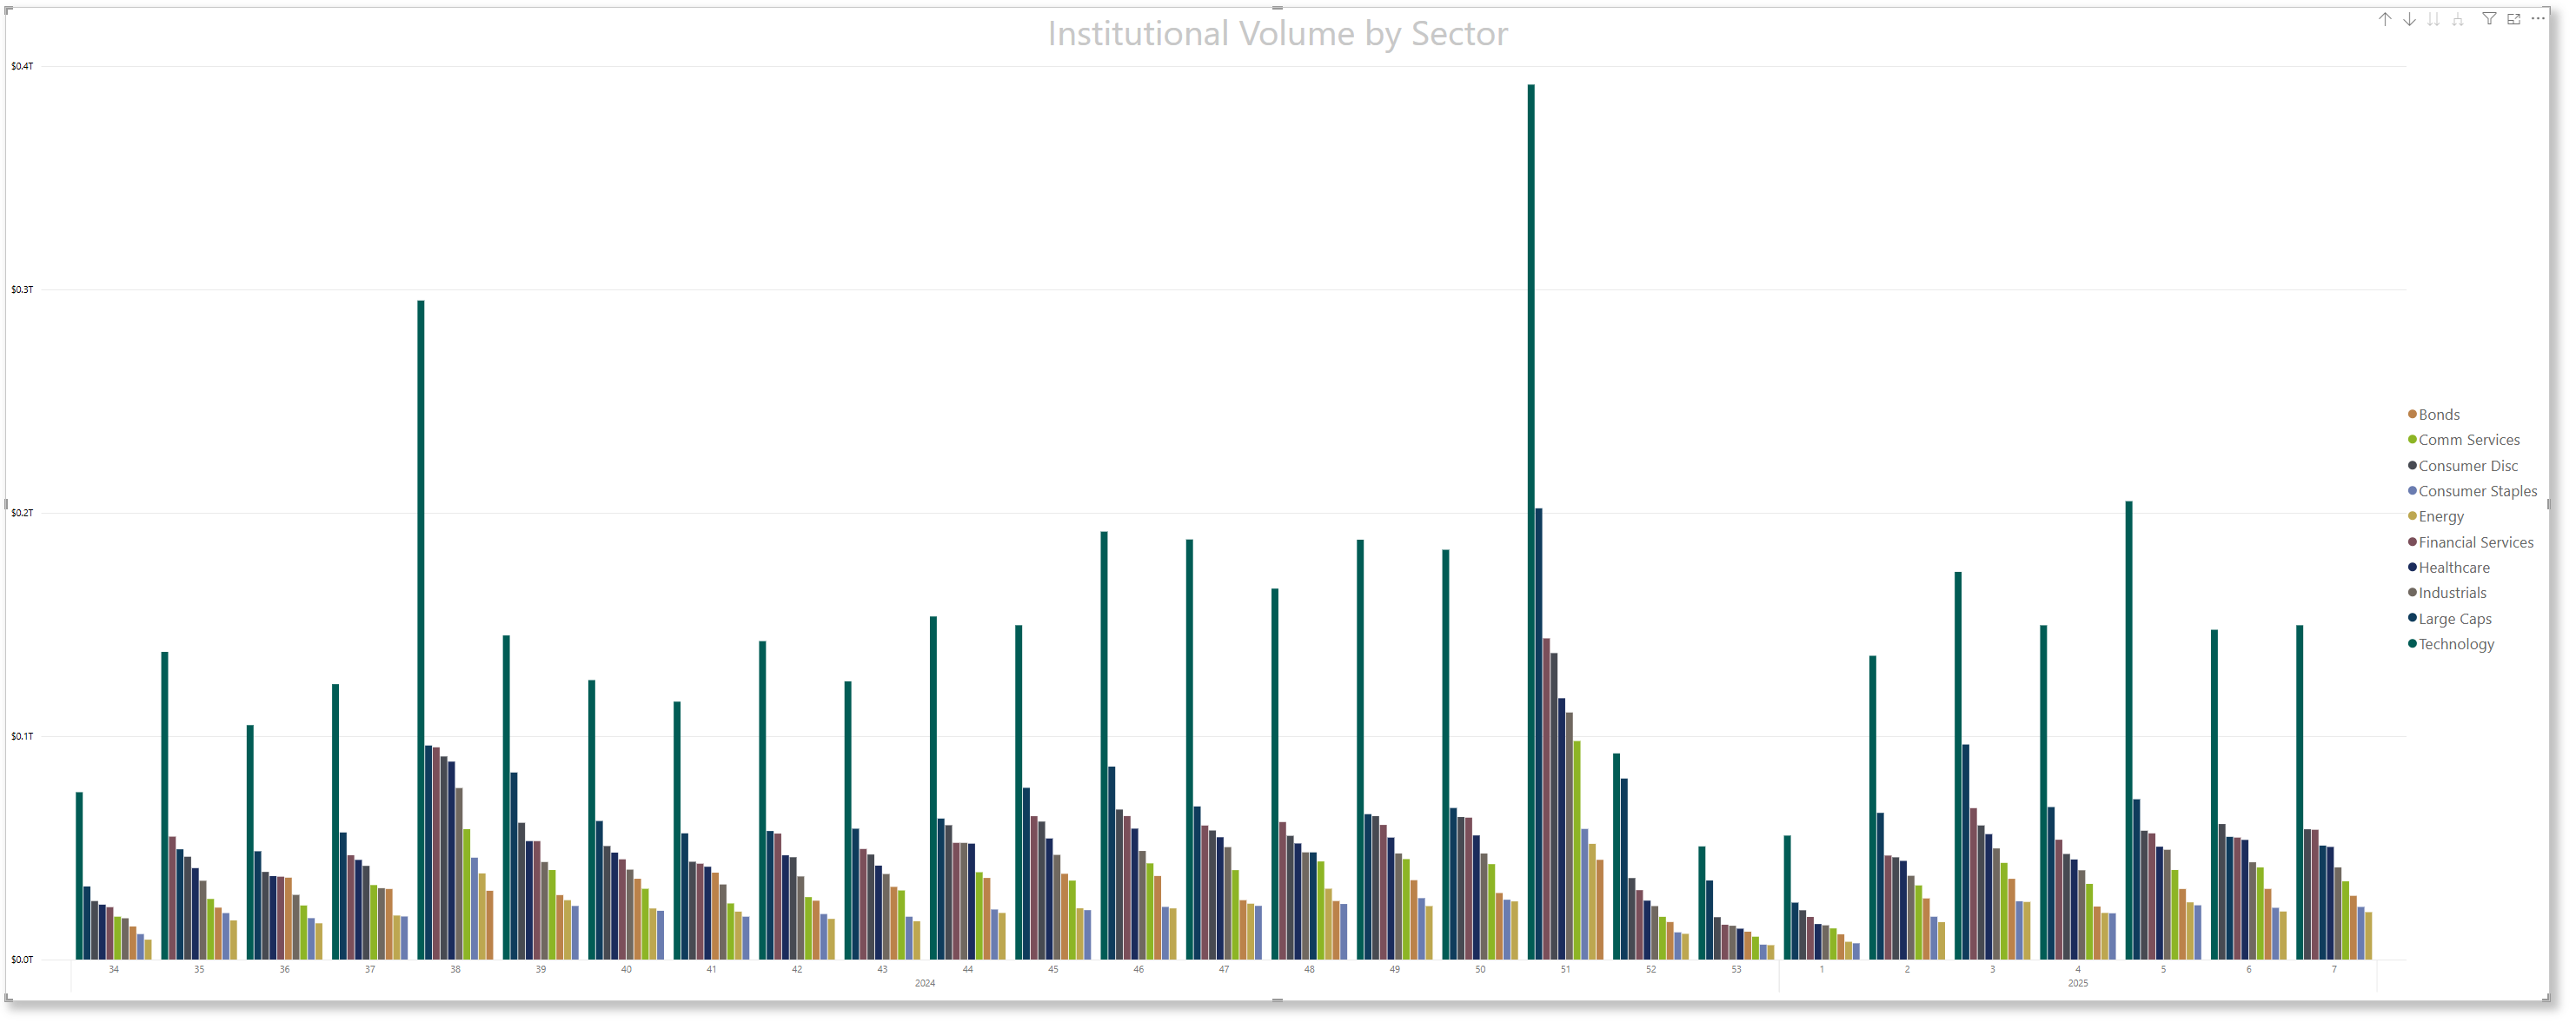
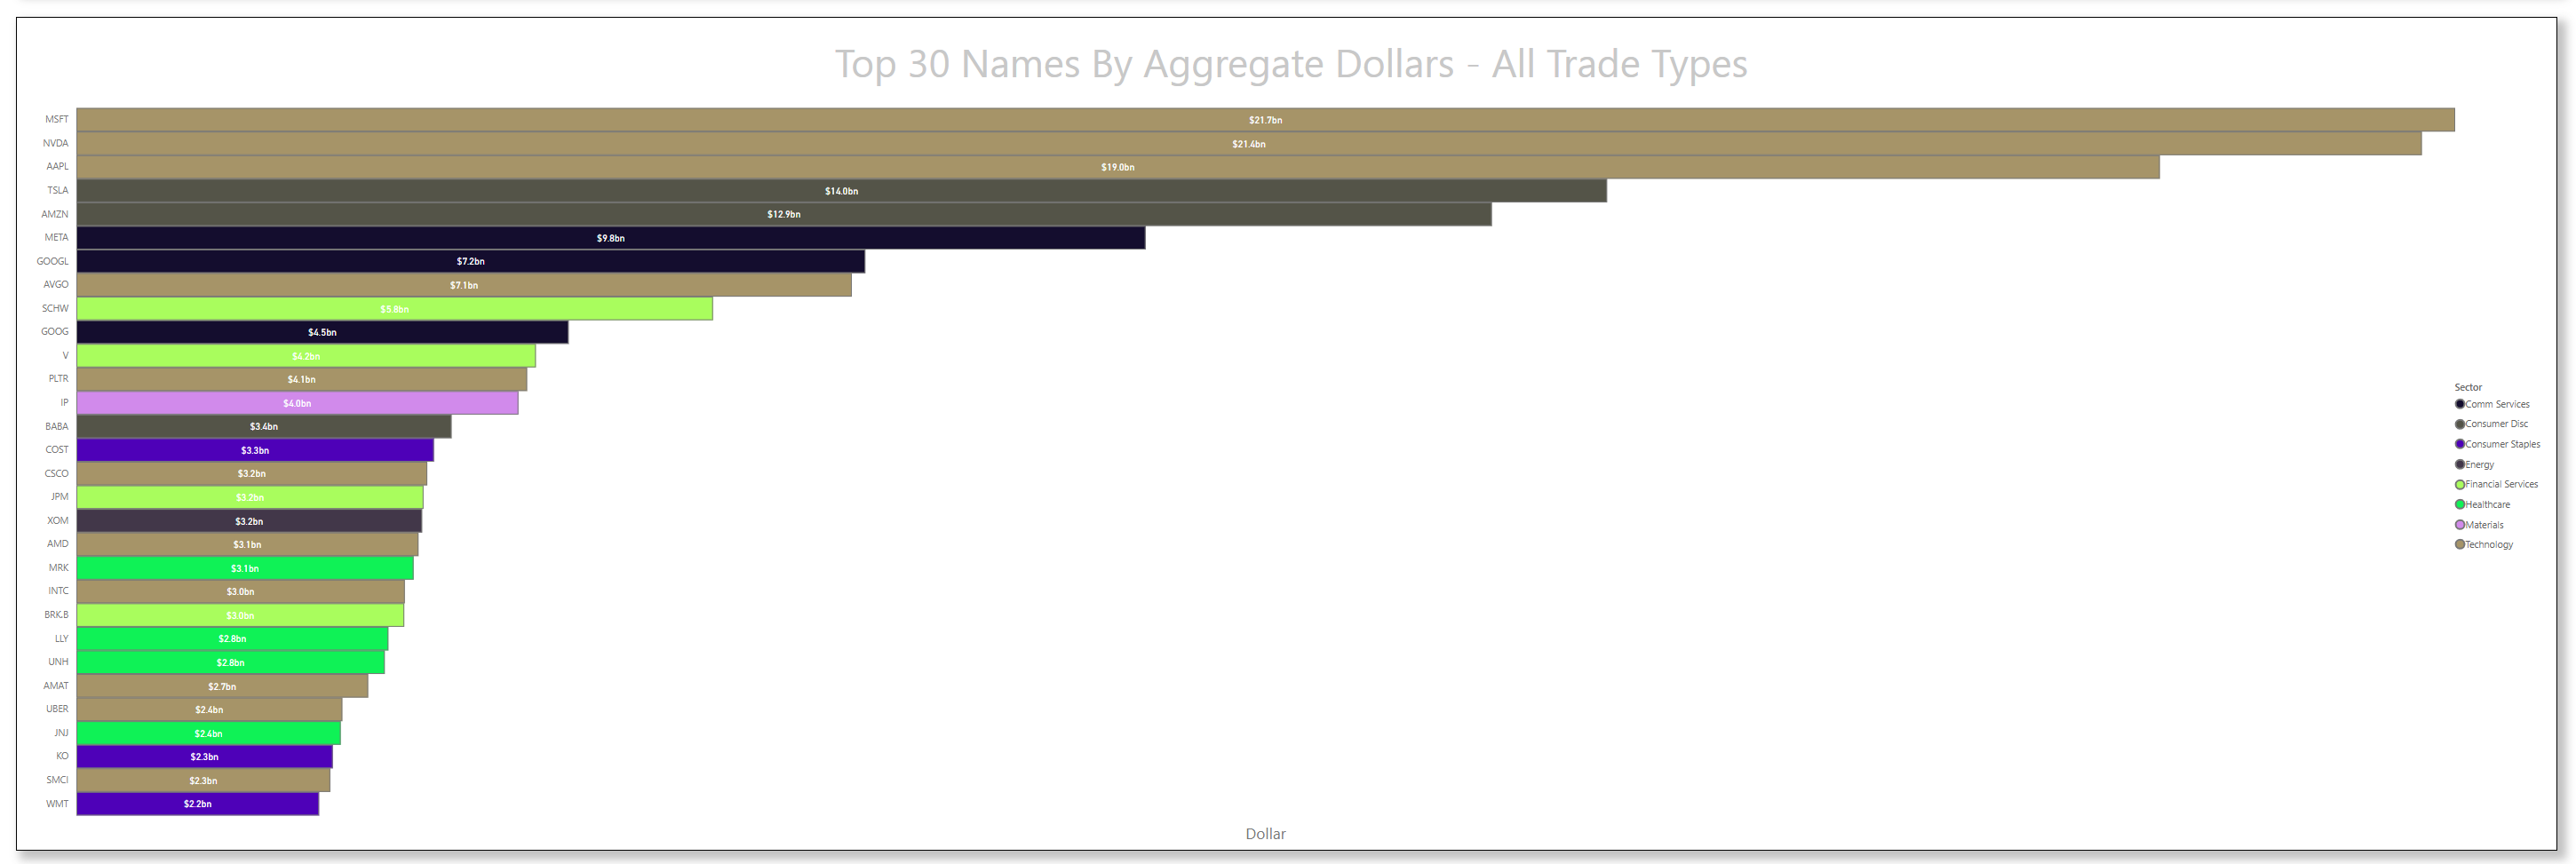
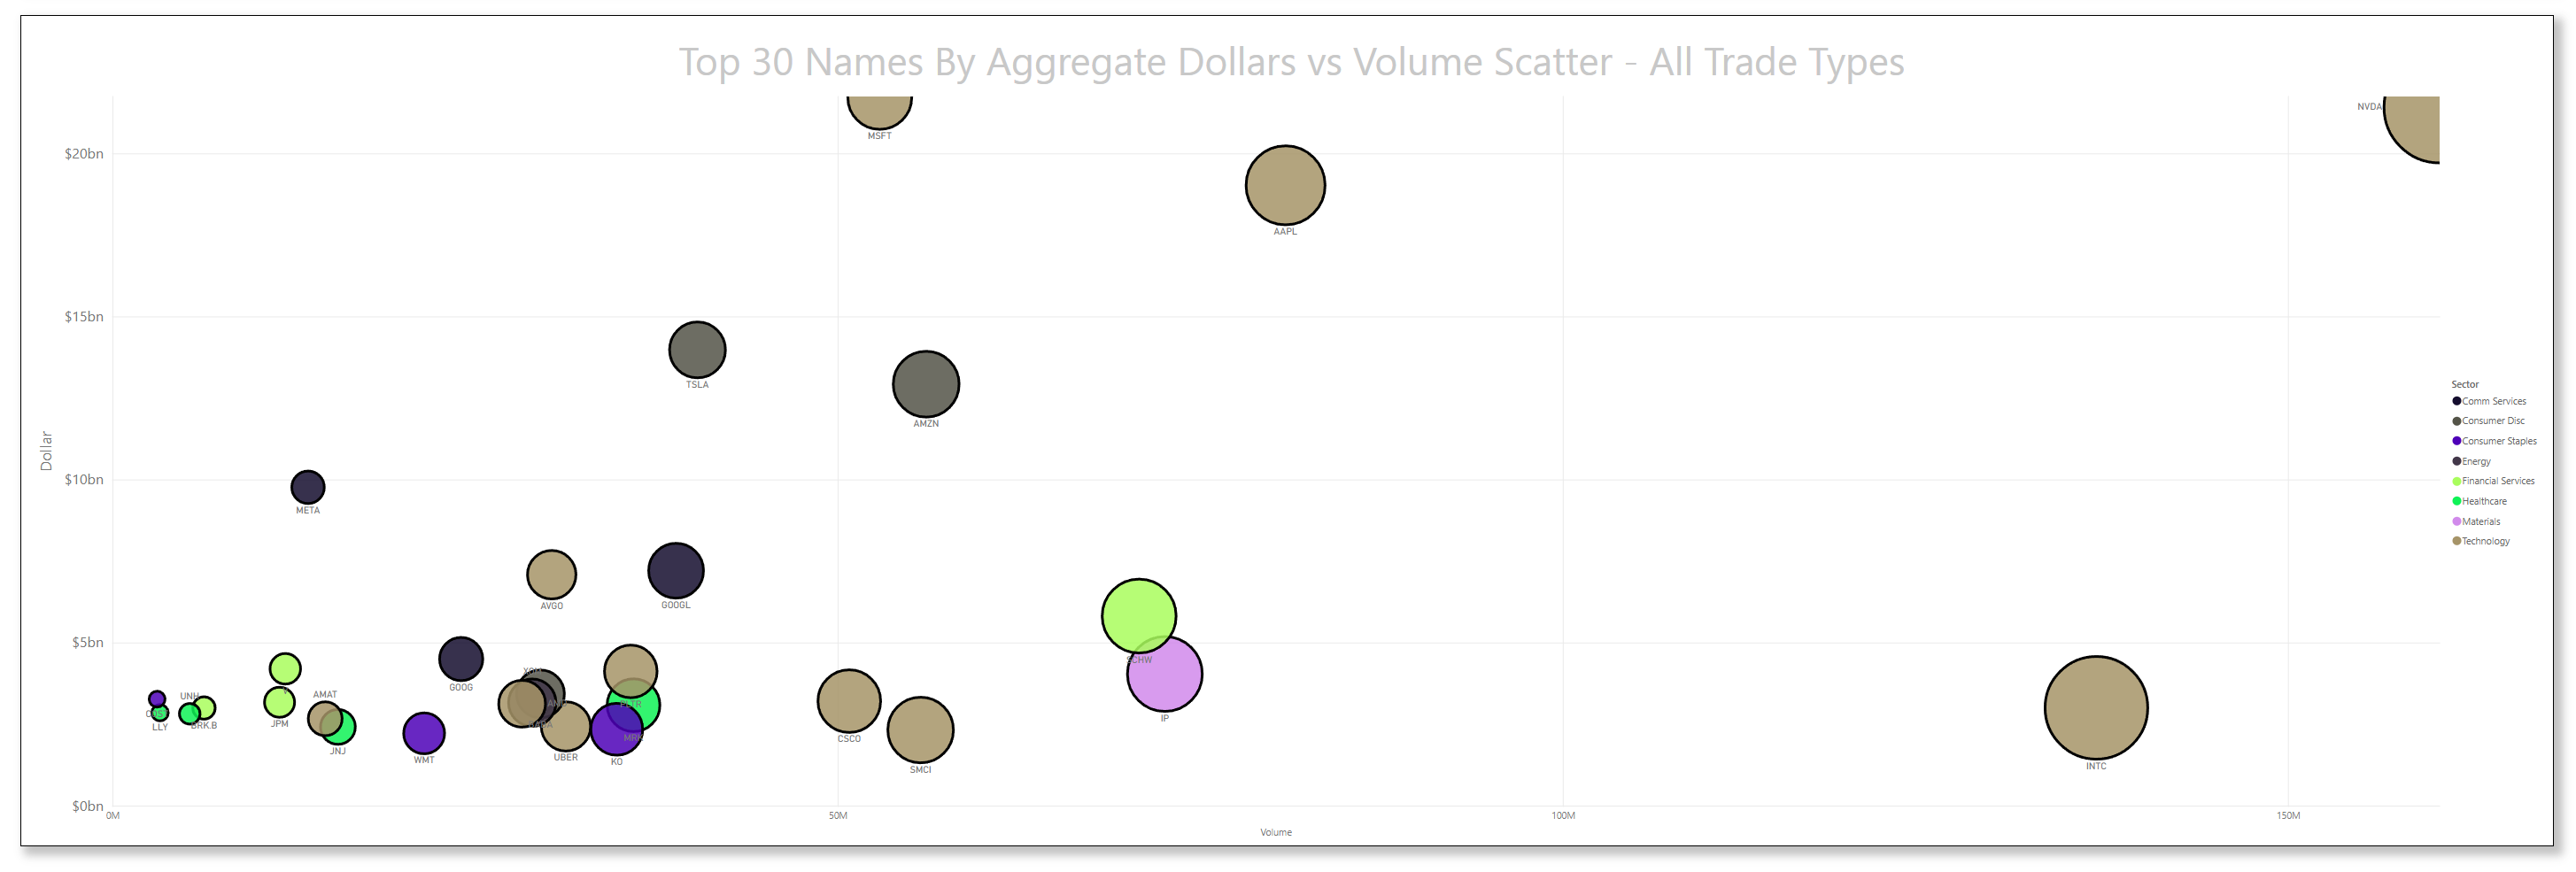
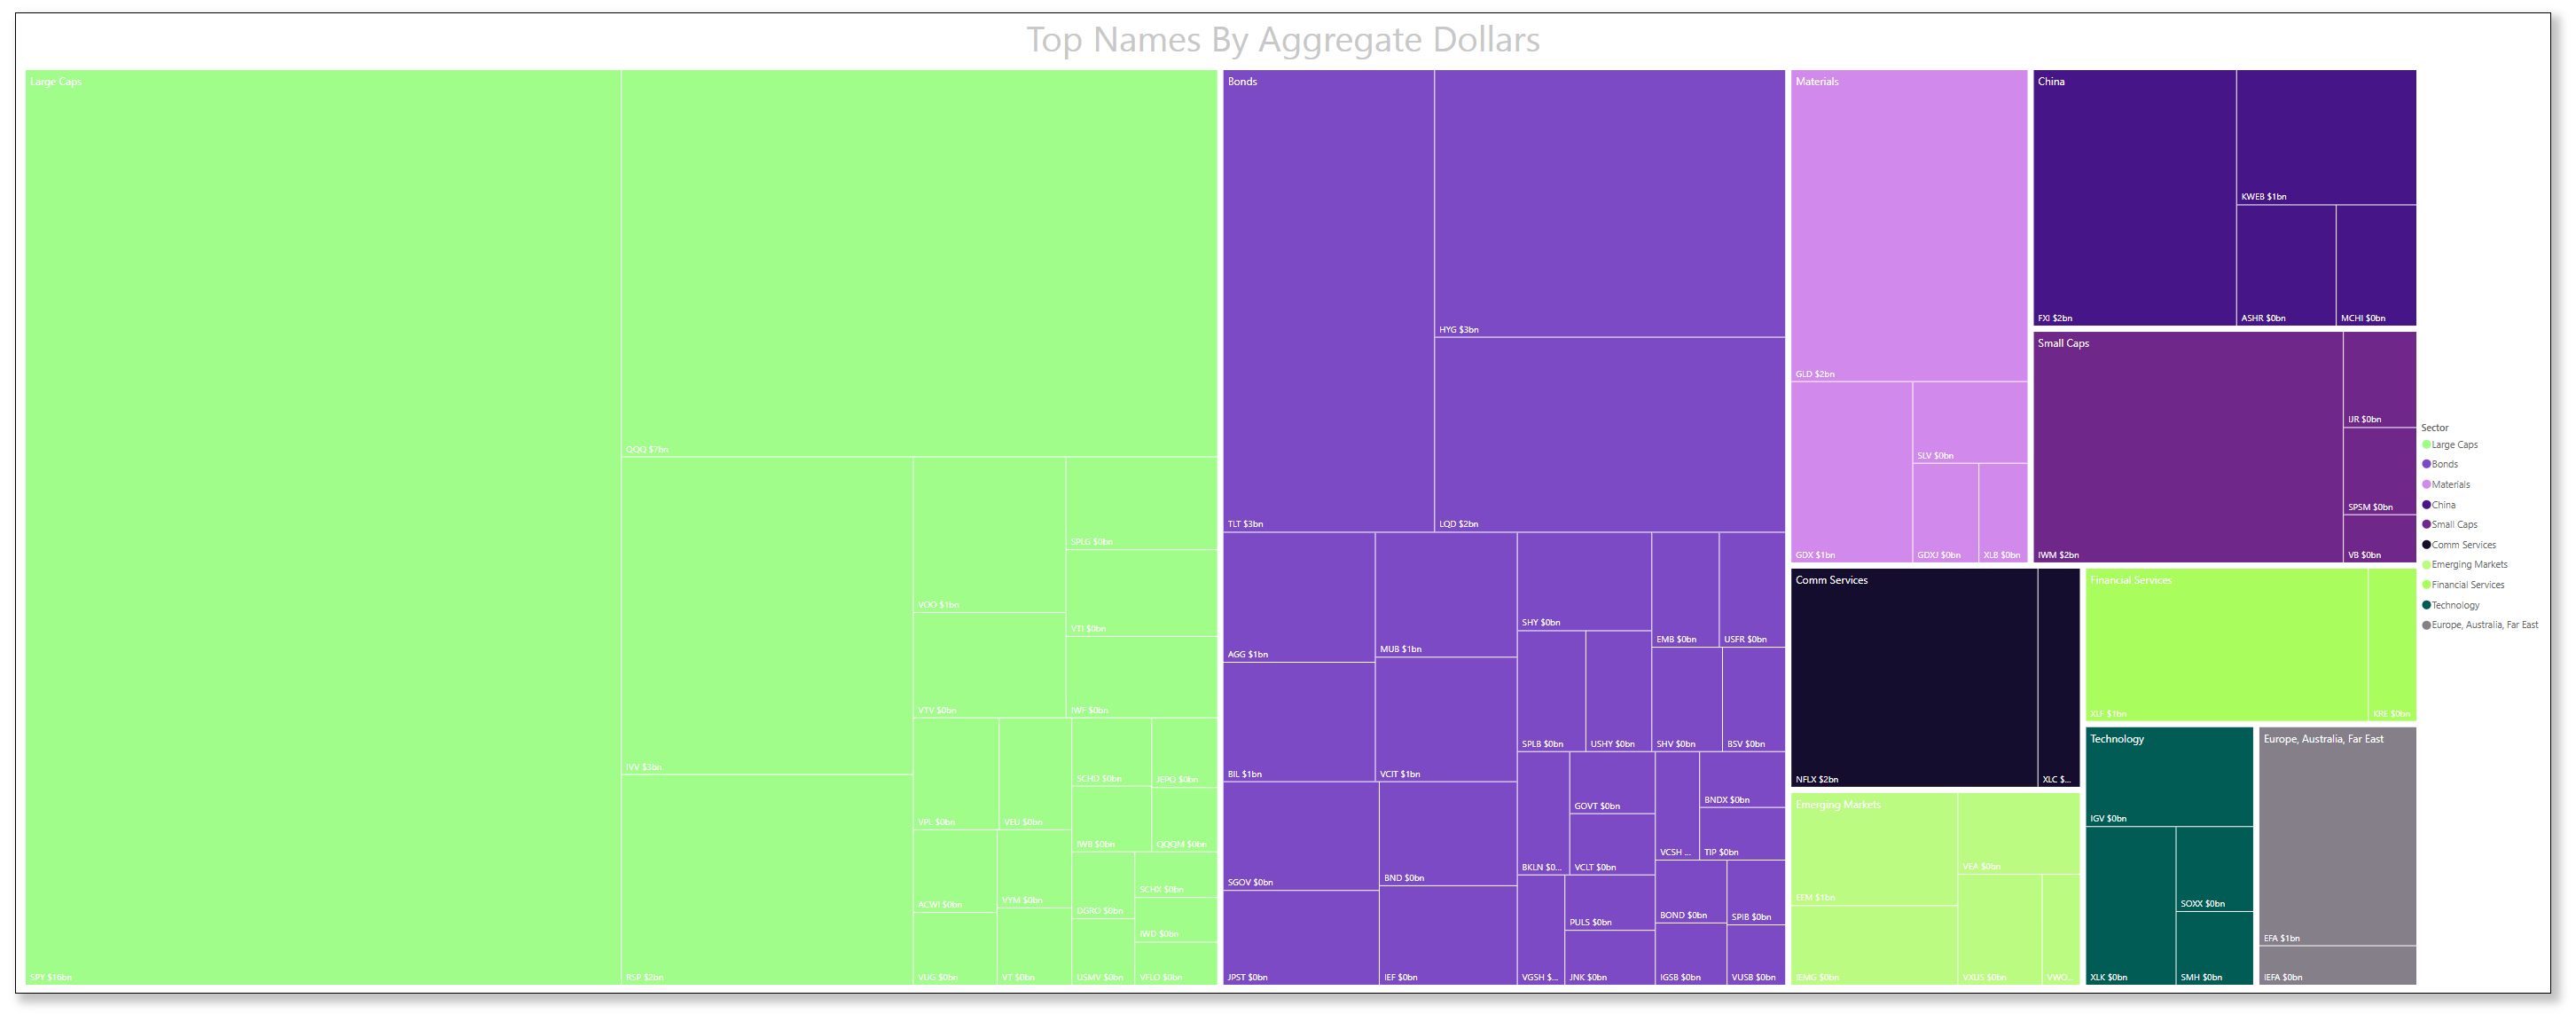
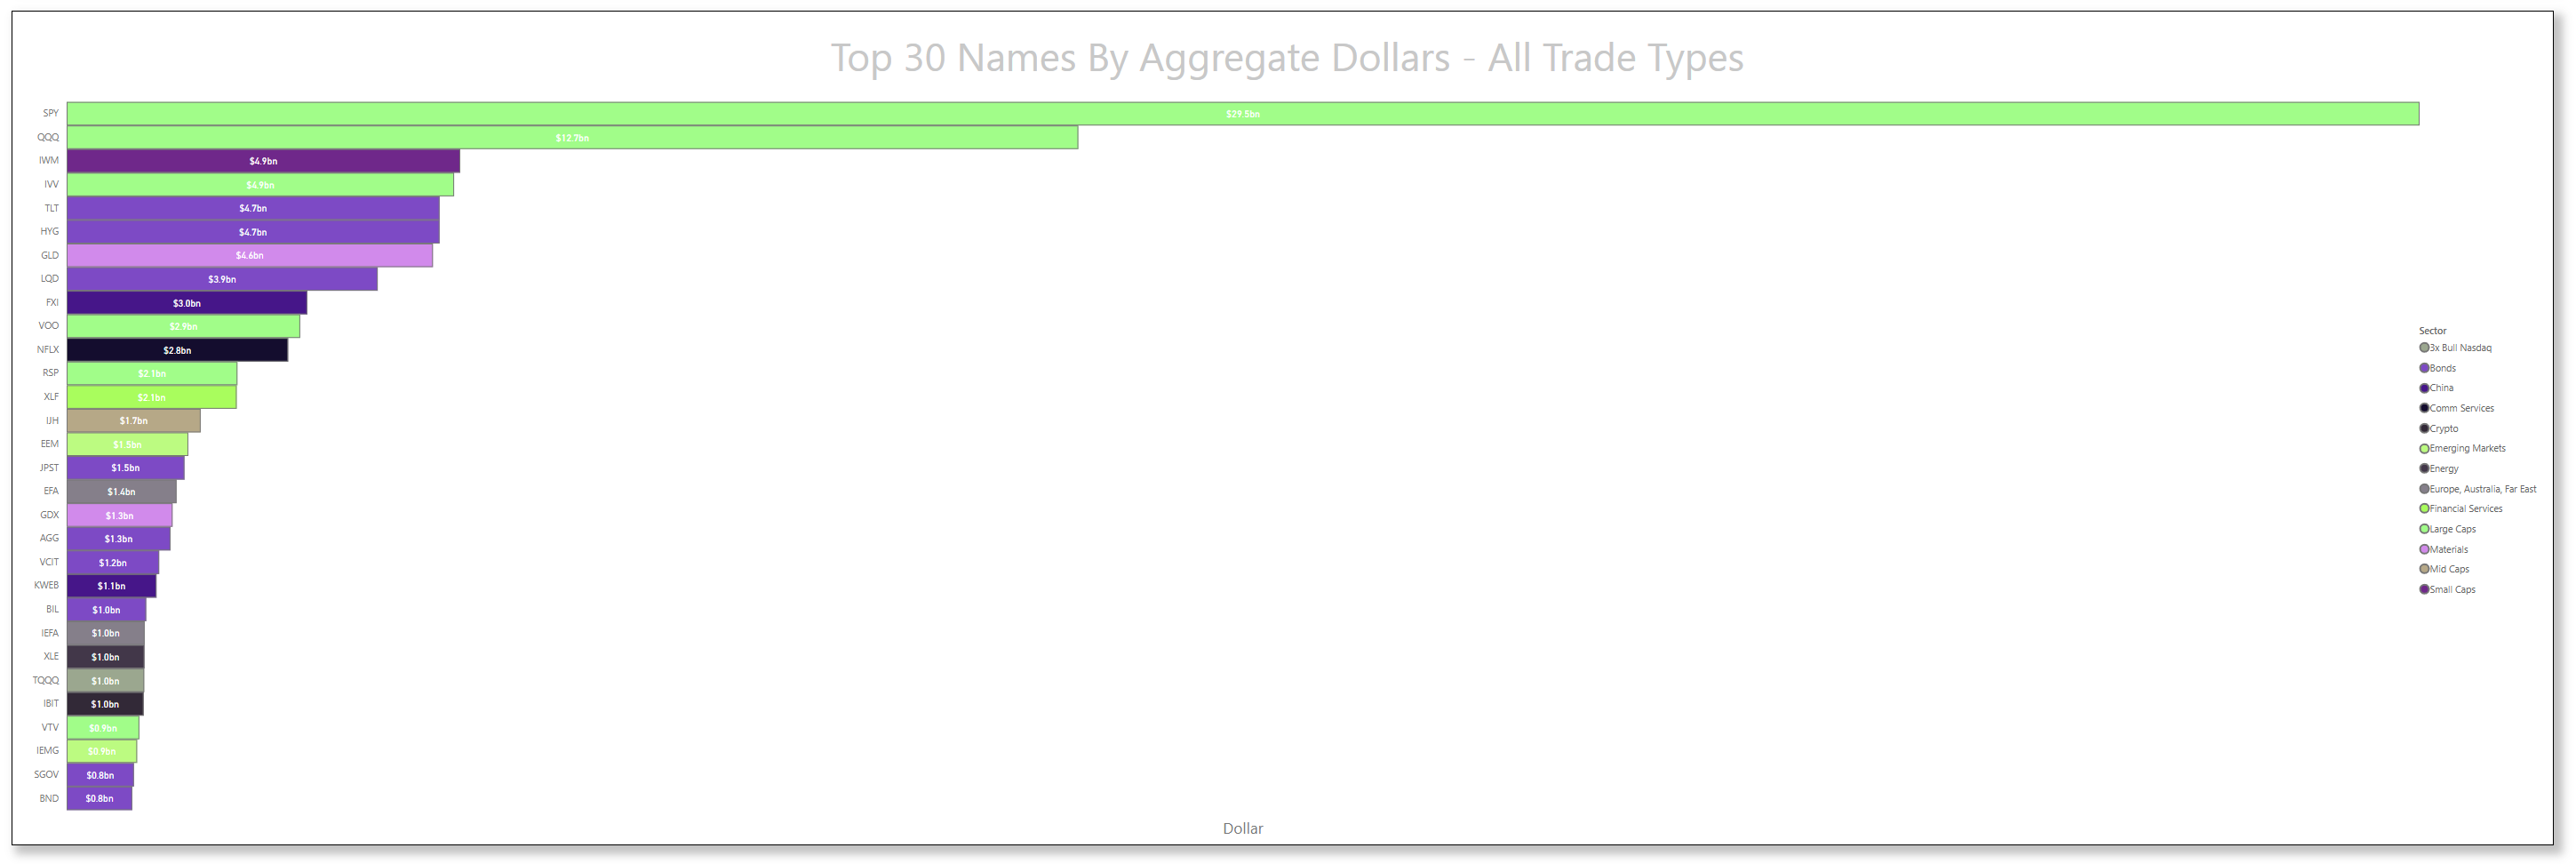
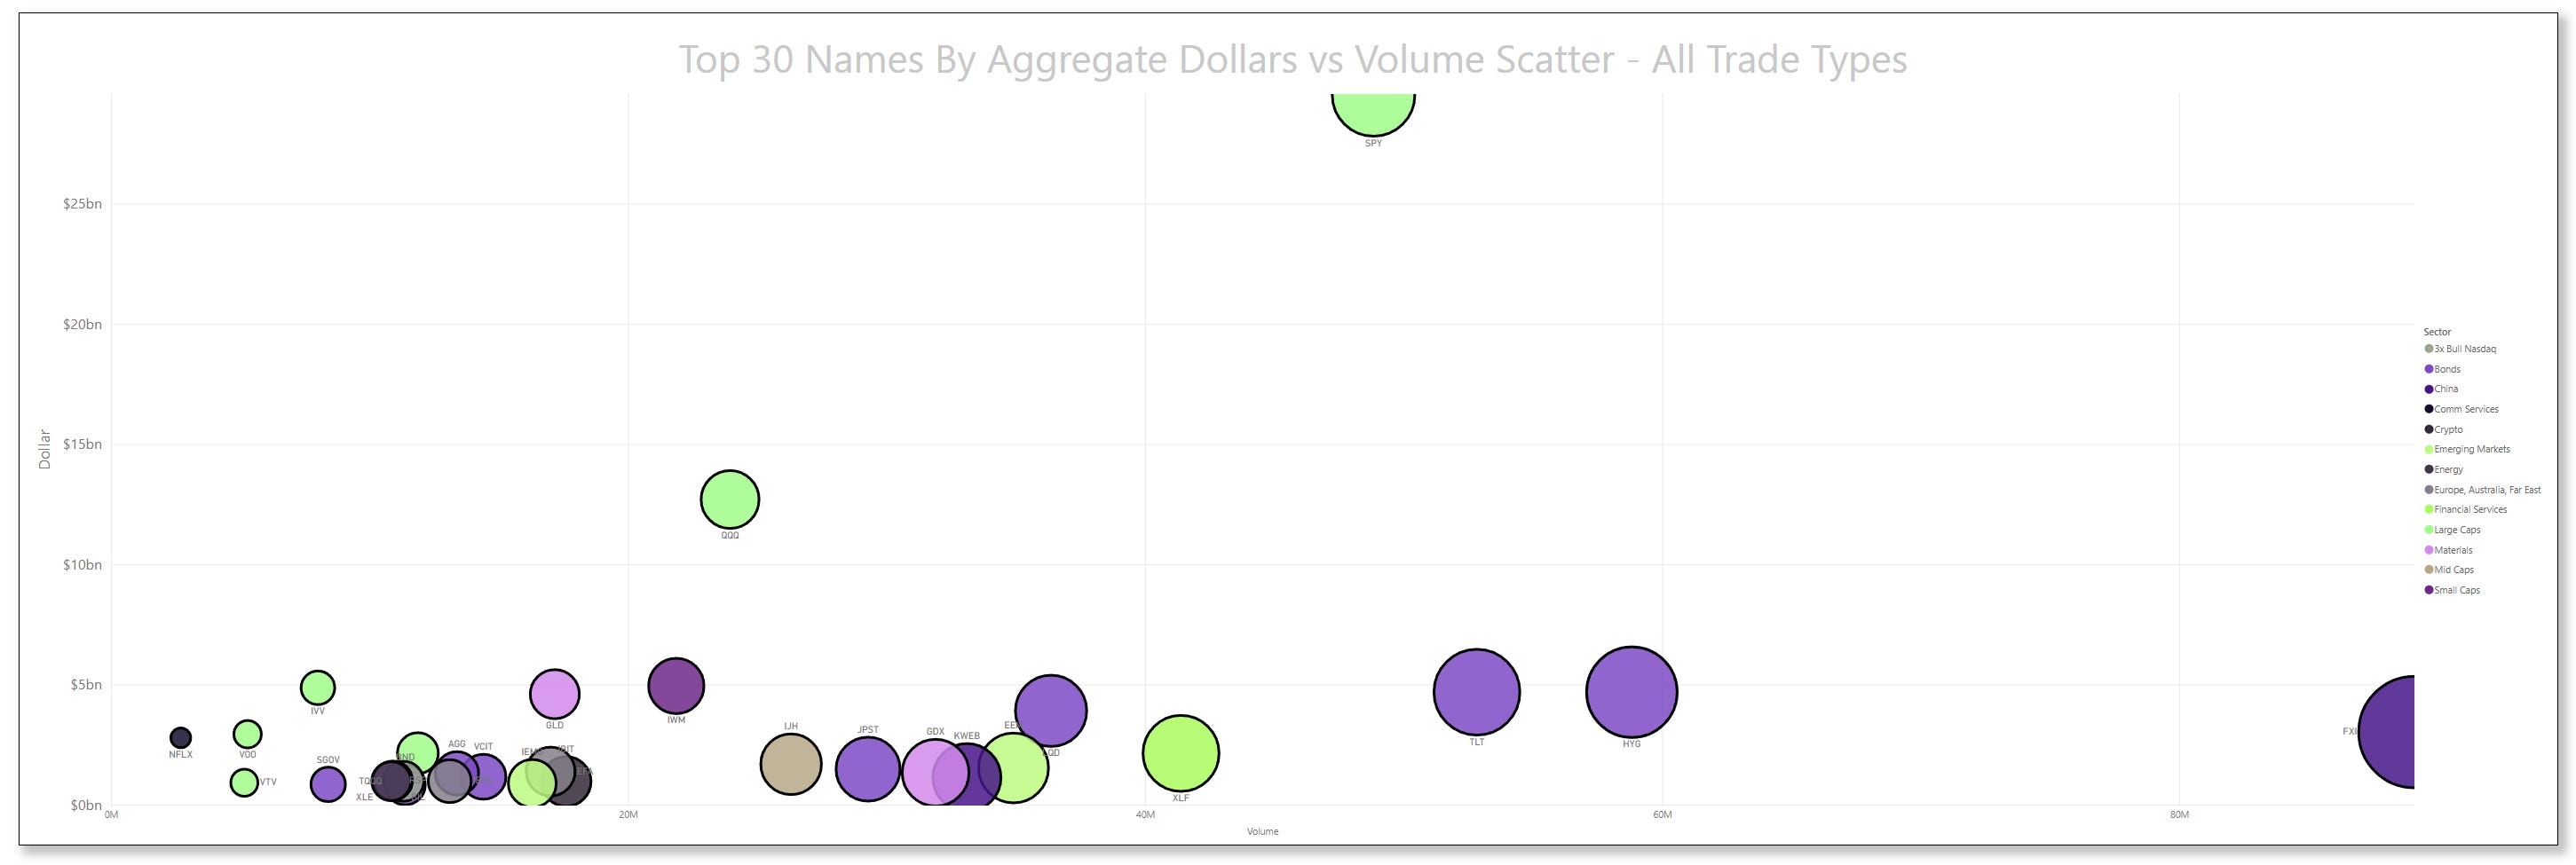
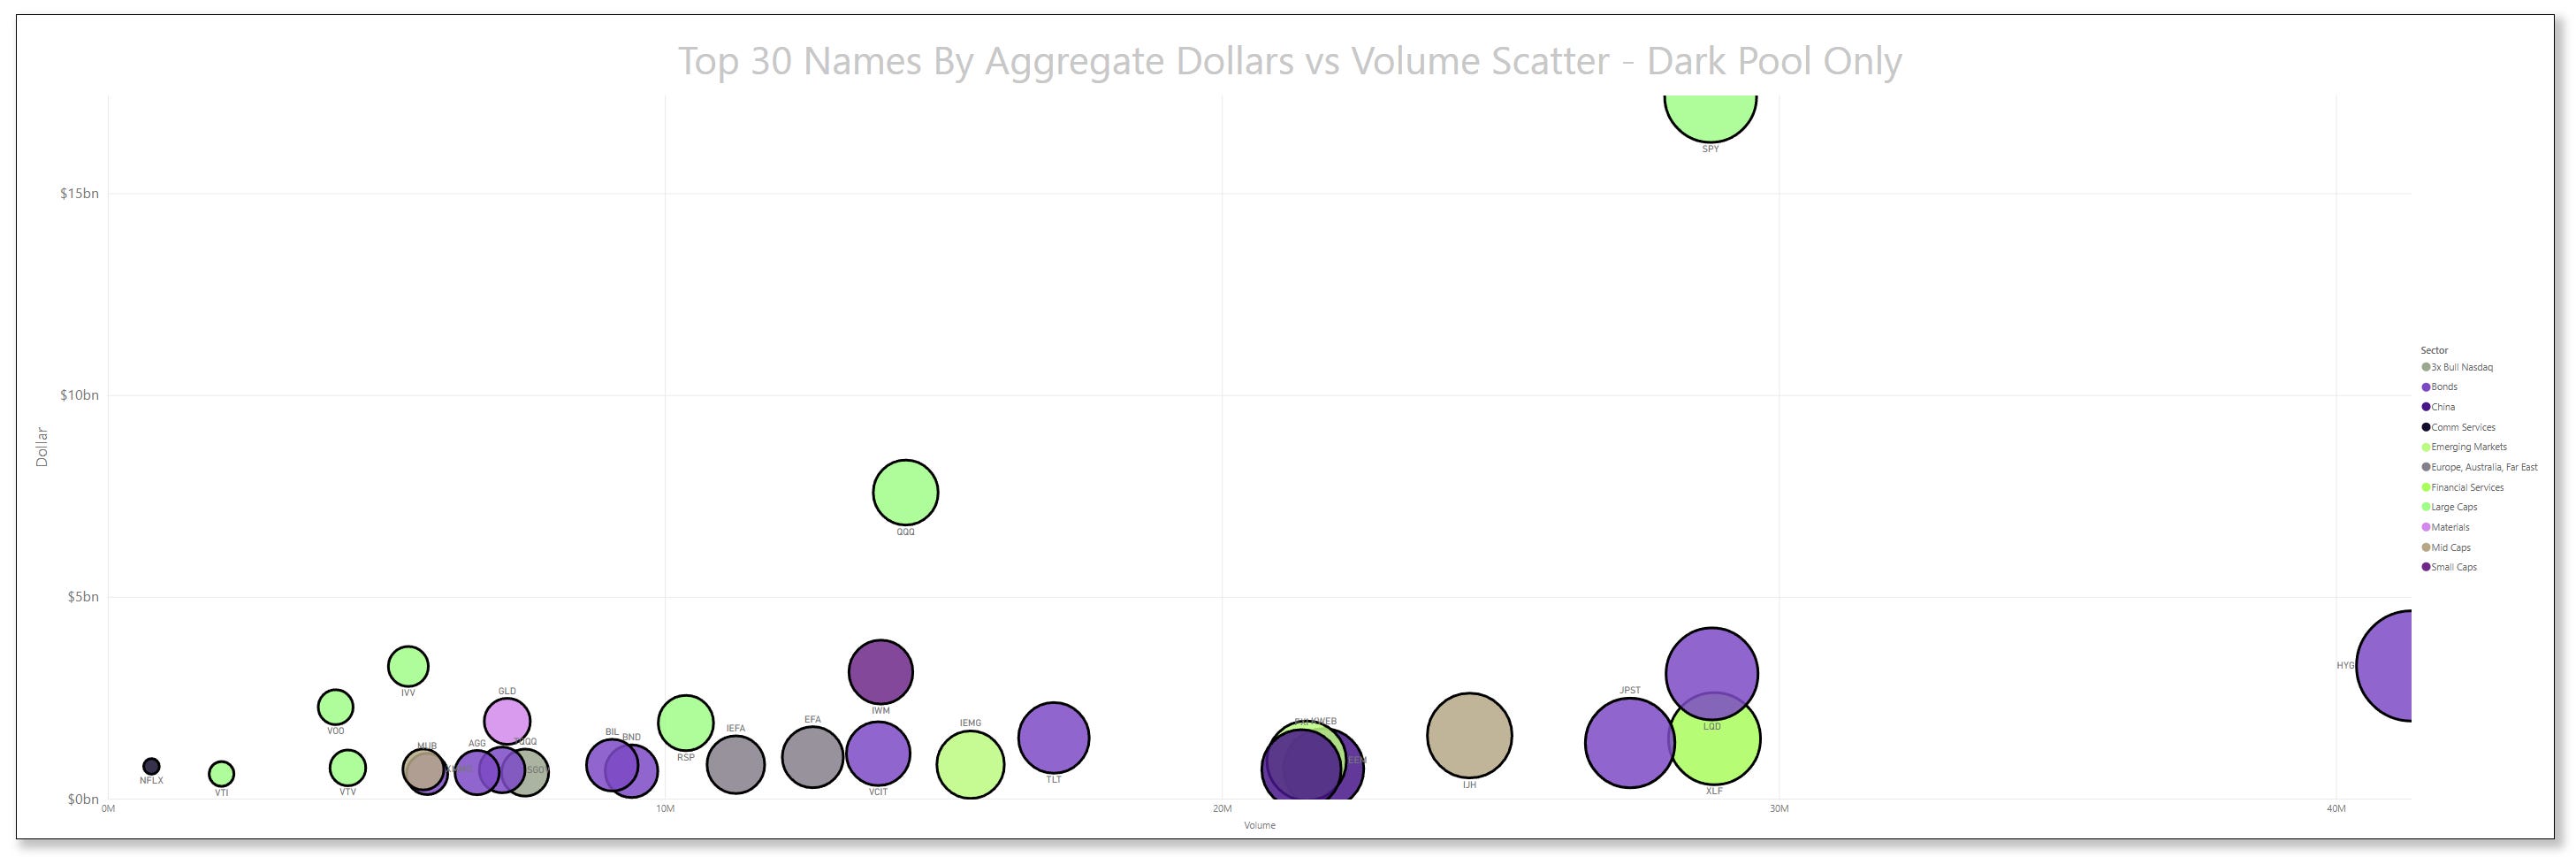
Top Institutional Order Flow In Equities
These are incredibly important charts to watch as they contains lots of nuanced suggestions at a thematic level. Watch these charts closely week-to-week to stay informed about where institutional money is flowing, adjust your strategies based on momentum, align your portfolio with macroeconomic and market trends, and manage risks more effectively by avoiding sectors losing institutional favor.
Sector Rotation Insights: The chart highlights which sectors are attracting institutional activity and which are losing favor. Institutions often lead market trends, so tracking shifts in their focus can indicate sector rotations.
Sentiment Analysis: The level of institutional activity reflects confidence in specific sectors. Rising activity in traditionally defensive sectors (e.g., healthcare, utilities) may indicate caution, while a surge in growth sectors (e.g., technology, consumer discretionary) could suggest optimism.
Emerging Trends: Sudden spikes in a previously overlooked sector, like industrials or consumer staples, might hint at emerging opportunities or structural shifts.
Macro Themes: Changes in sector activity often align with broader macroeconomic themes like inflation, interest rates, or geopolitical events. For instance:
Increased activity in energy might indicate concerns about oil supply or rising prices.
Growth in technology could align with innovations or favorable policies.
Risk Management: Declining institutional activity in a sector might signal weakening fundamentals or heightened risks.
Spotting Overcrowding: Excessive activity in a single sector over multiple weeks may suggest overcrowding, which could lead to heightened volatility if institutions begin to exit.

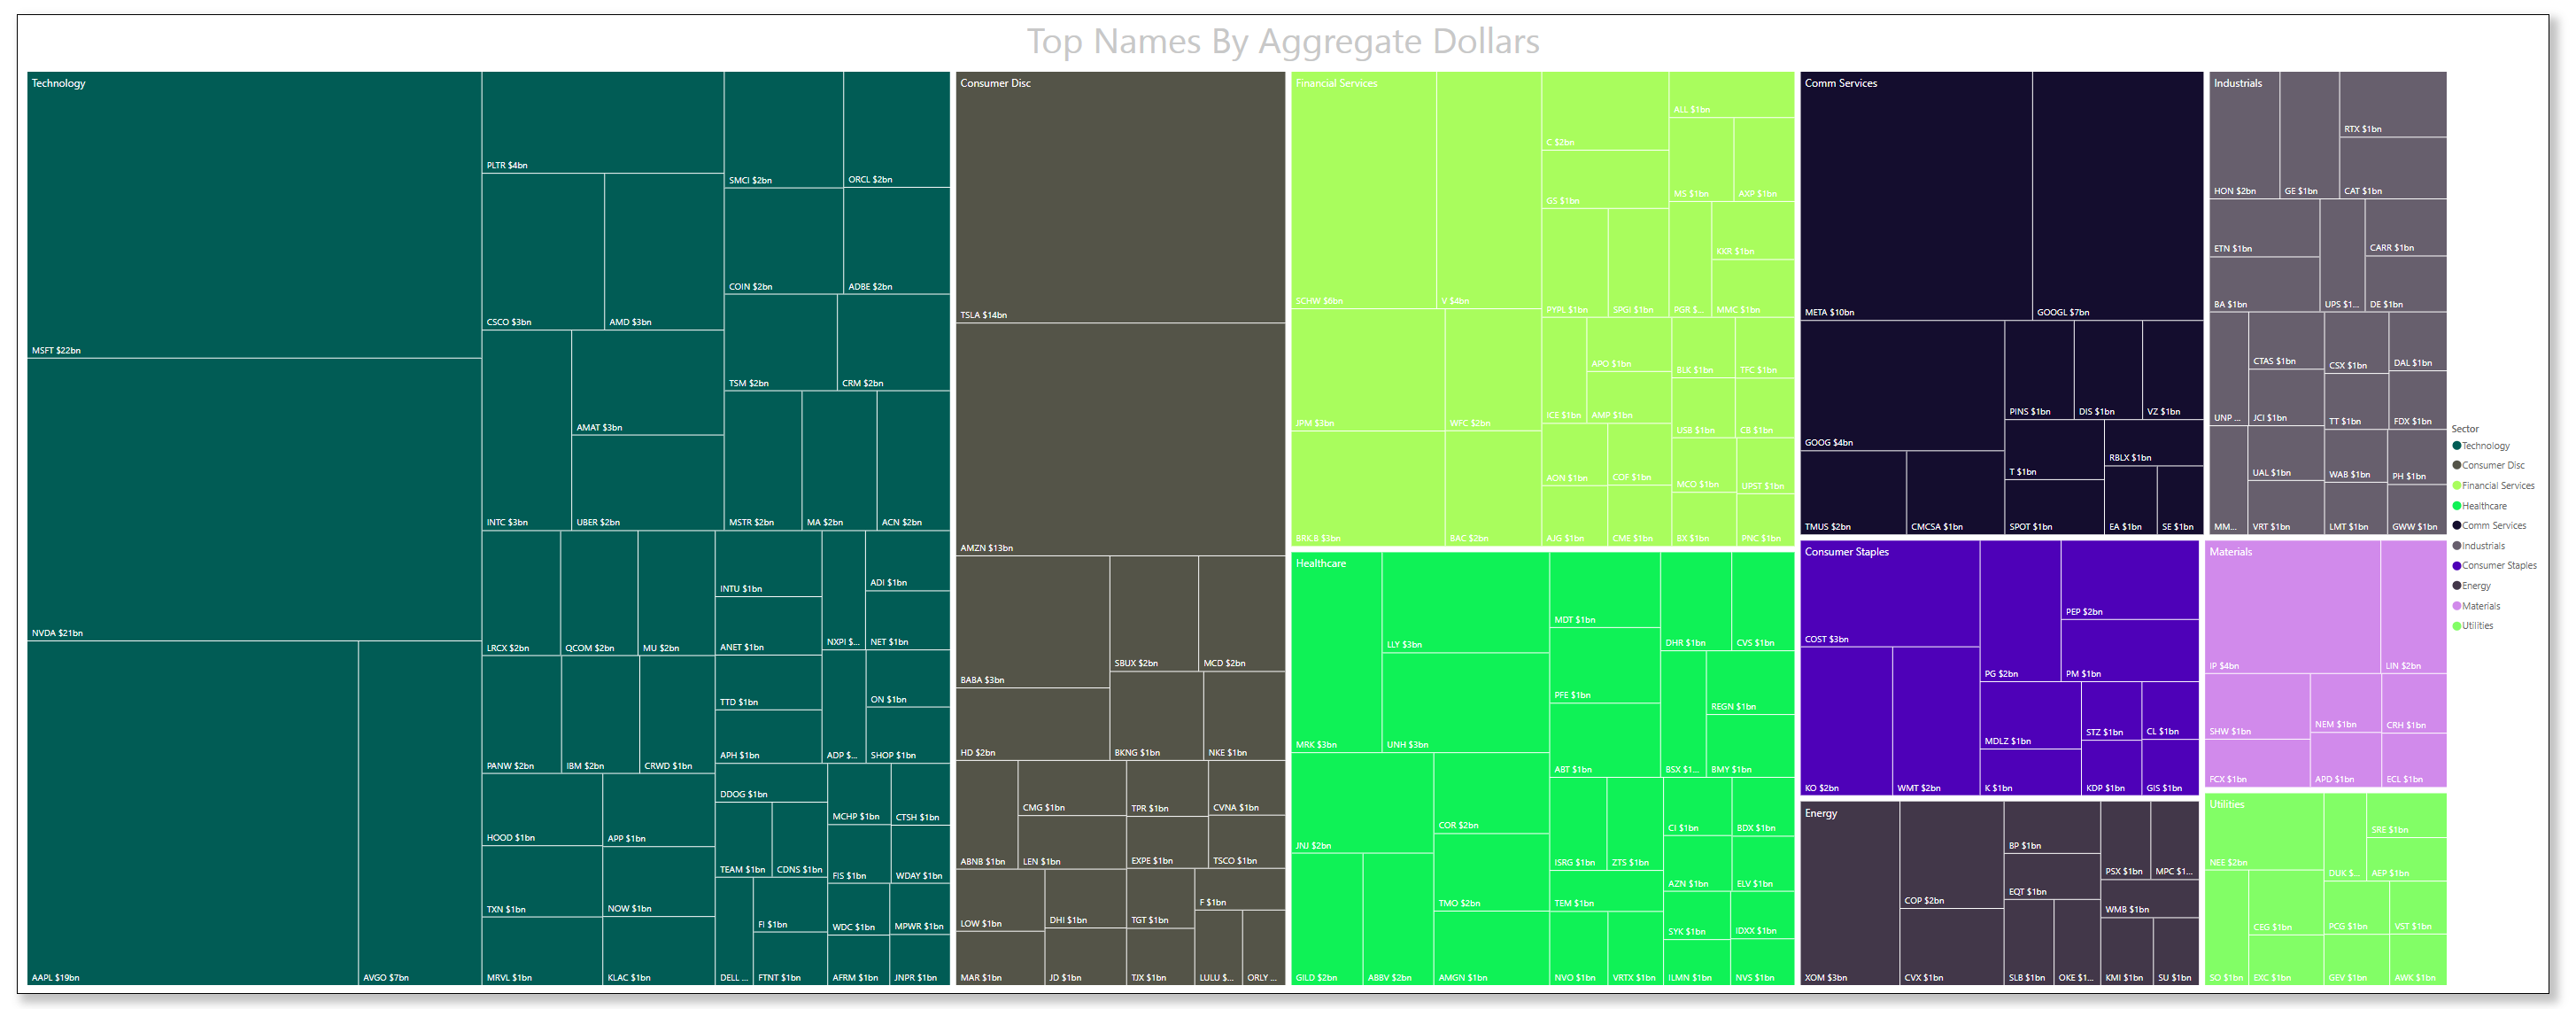
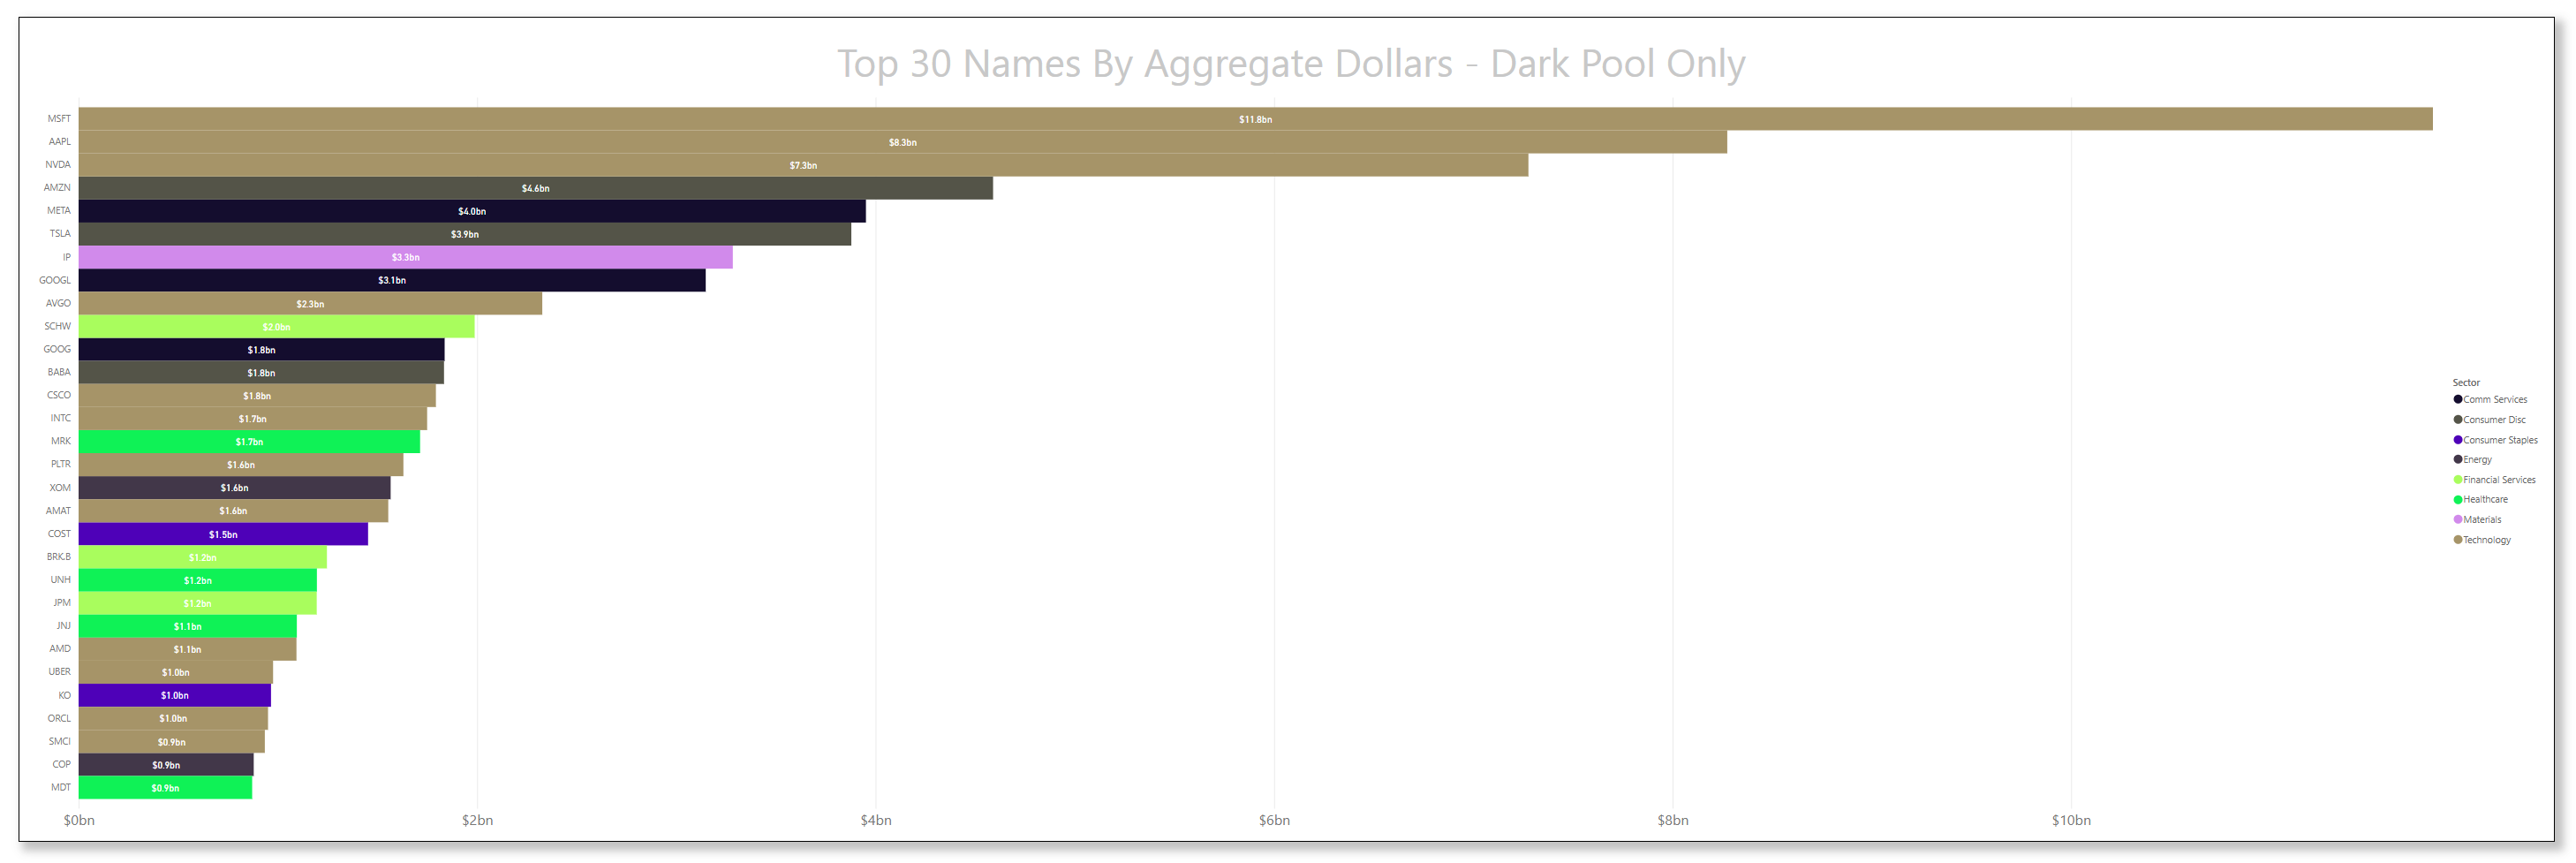
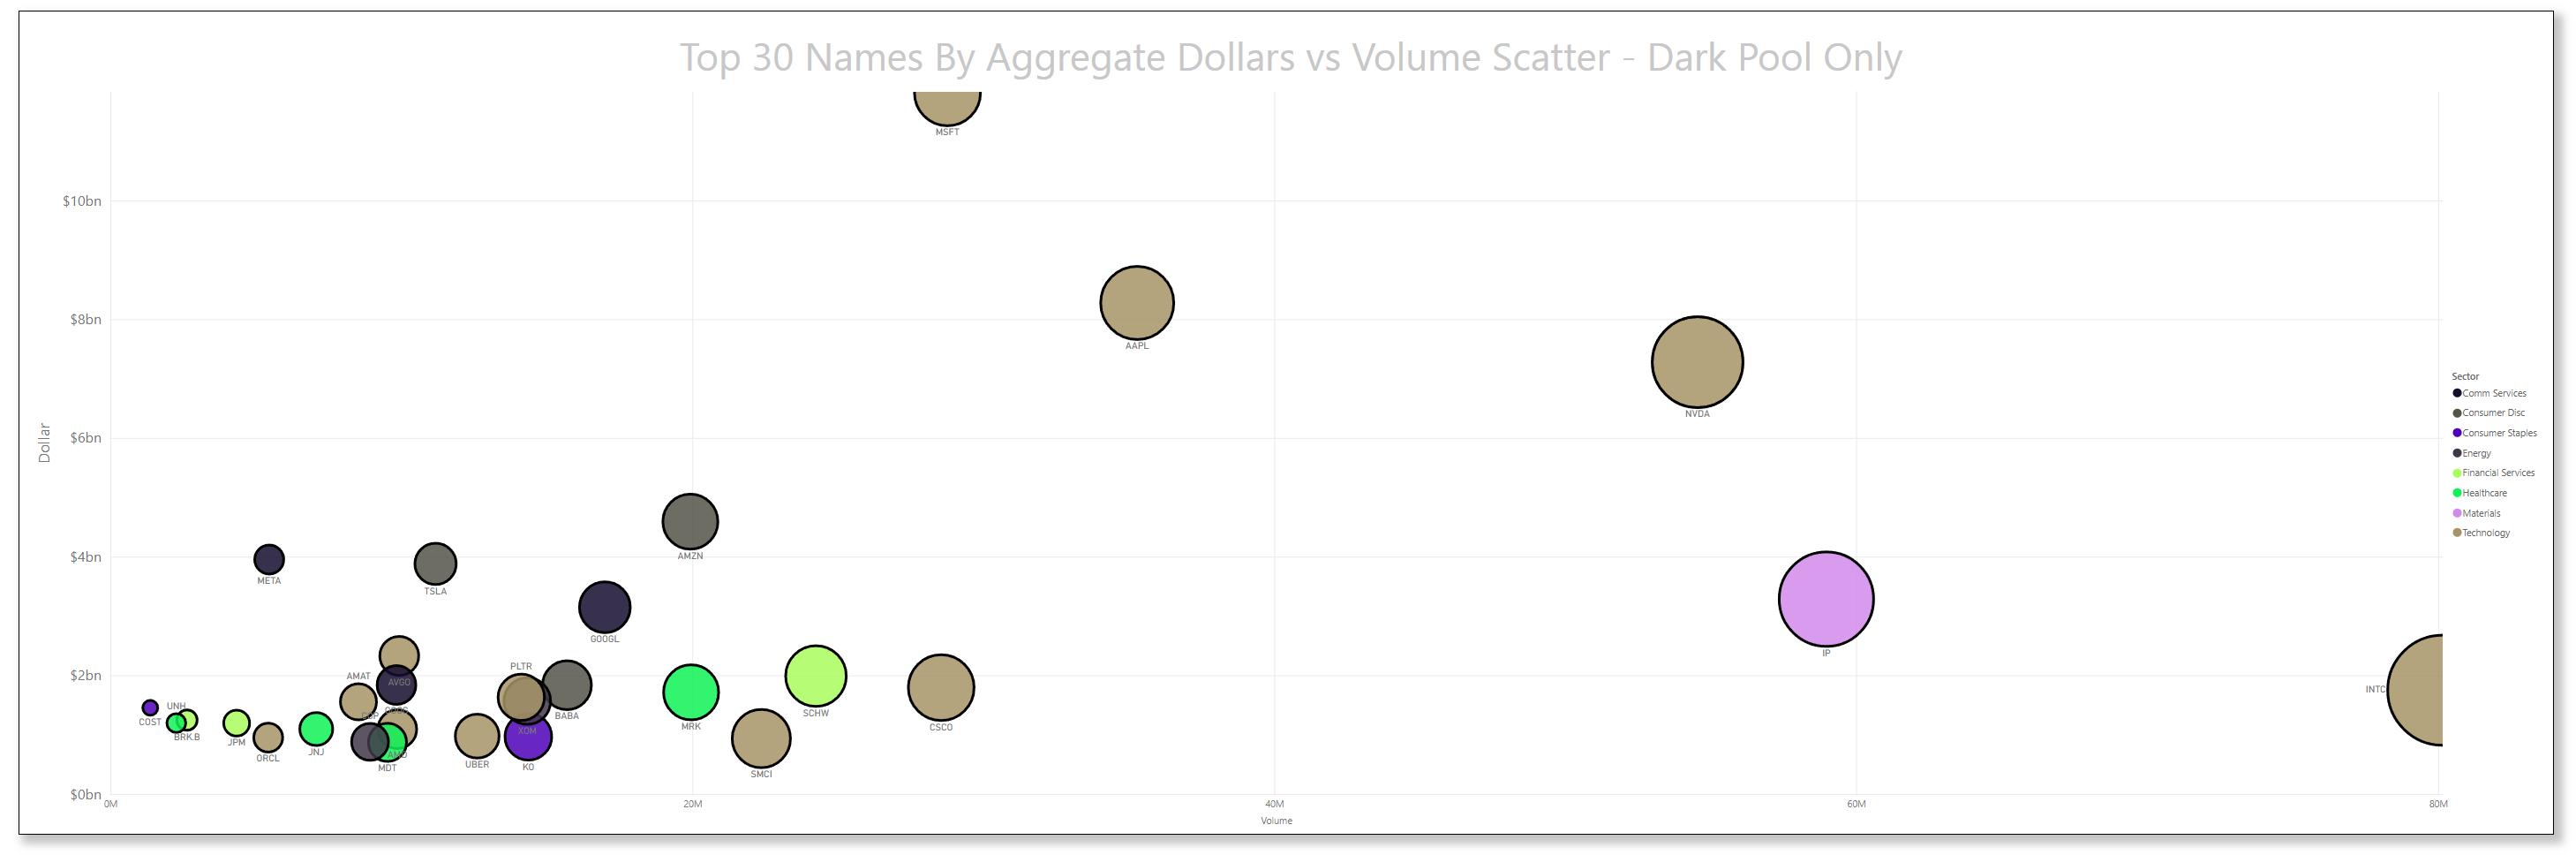
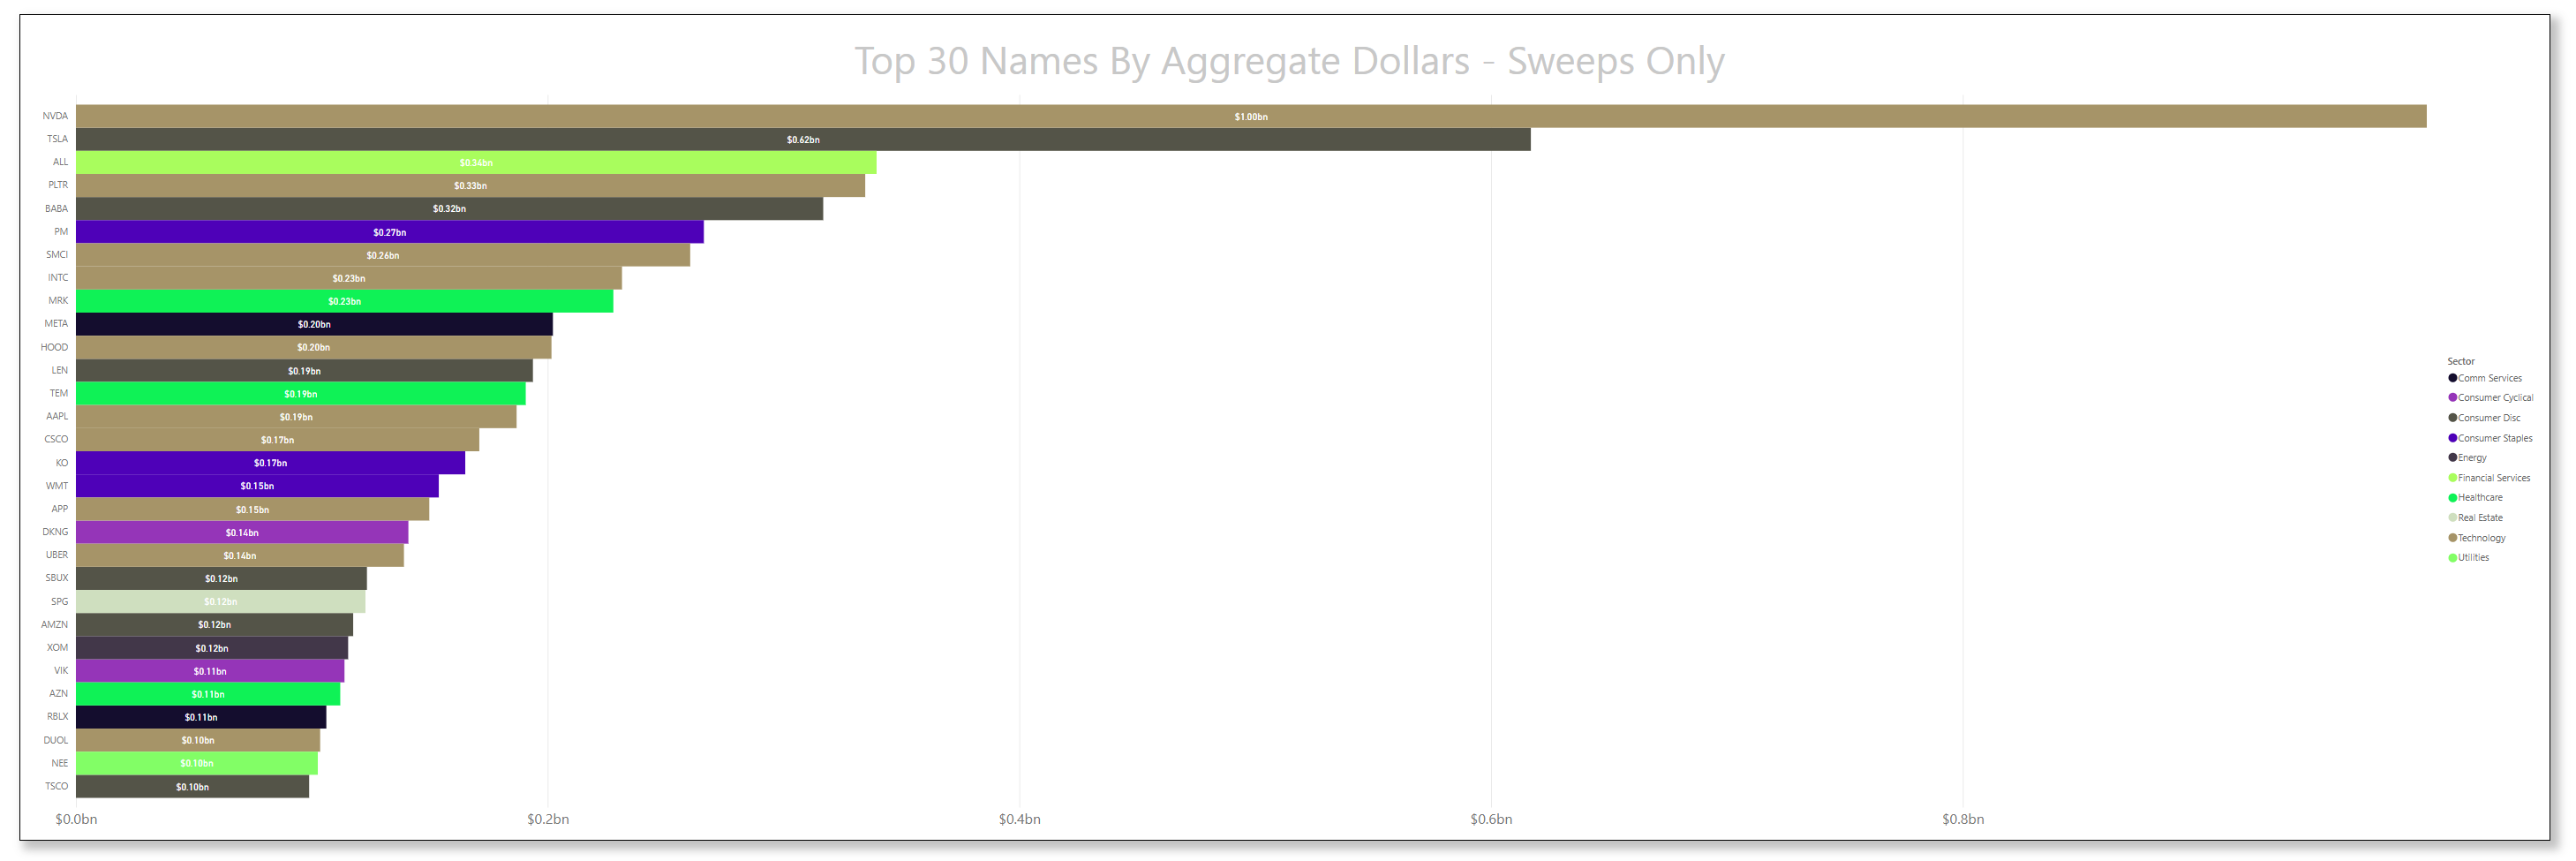
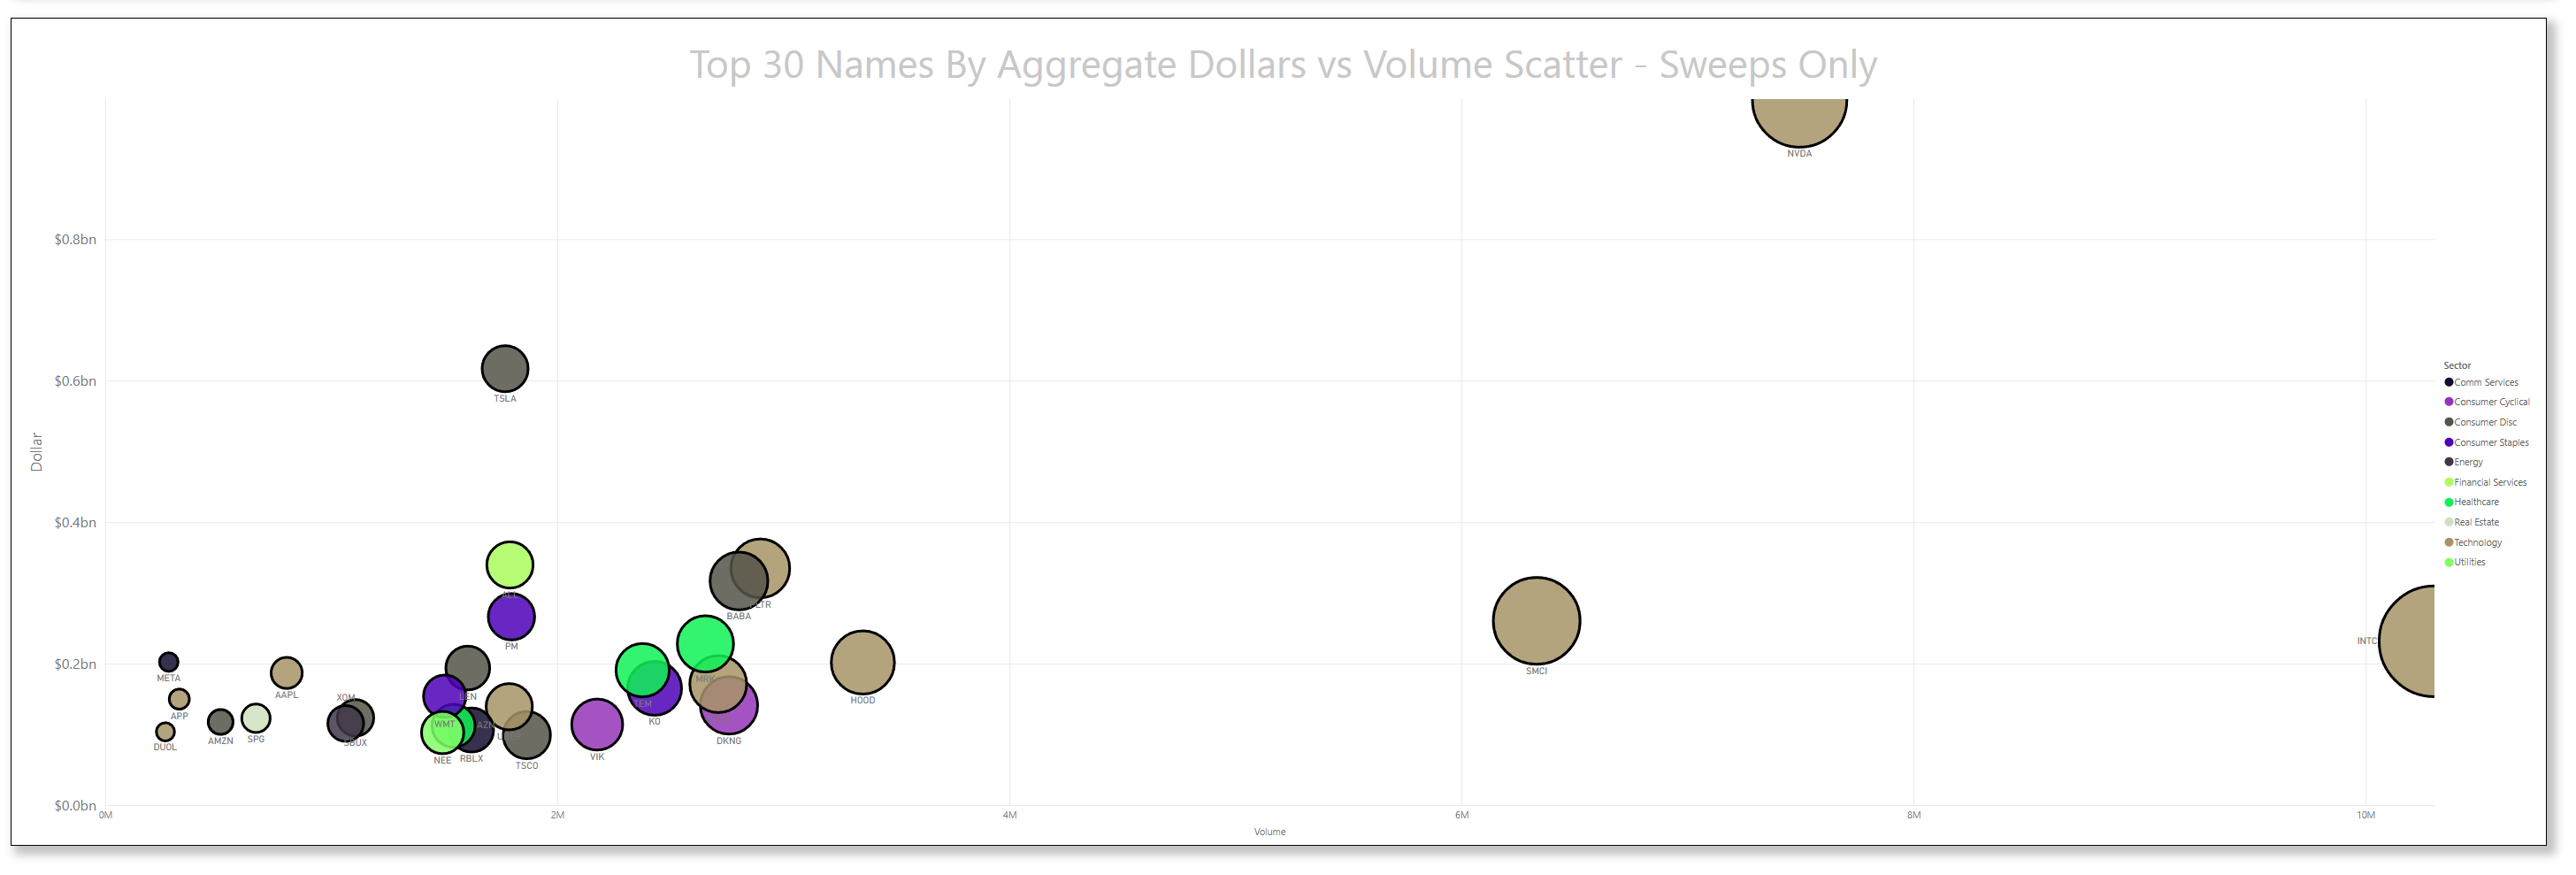
Many excellent trade ideas and sources of inspiration can be found in these prints below. While only the top 30 from each group are displayed, the complete results are accessible in VolumeLeaders.com for you to explore at your convenience any time. Remember to configure trade alerts within the platform to ensure institutional order flows that capture your interest or are significant to you aren’t missed. The blue charts encompass all types of trades, including blocks on lit exchanges; the purple charts exclusively depict dark pool trades; and the green charts represent sweeps only.
Top Institutional Order Flow In ETFs


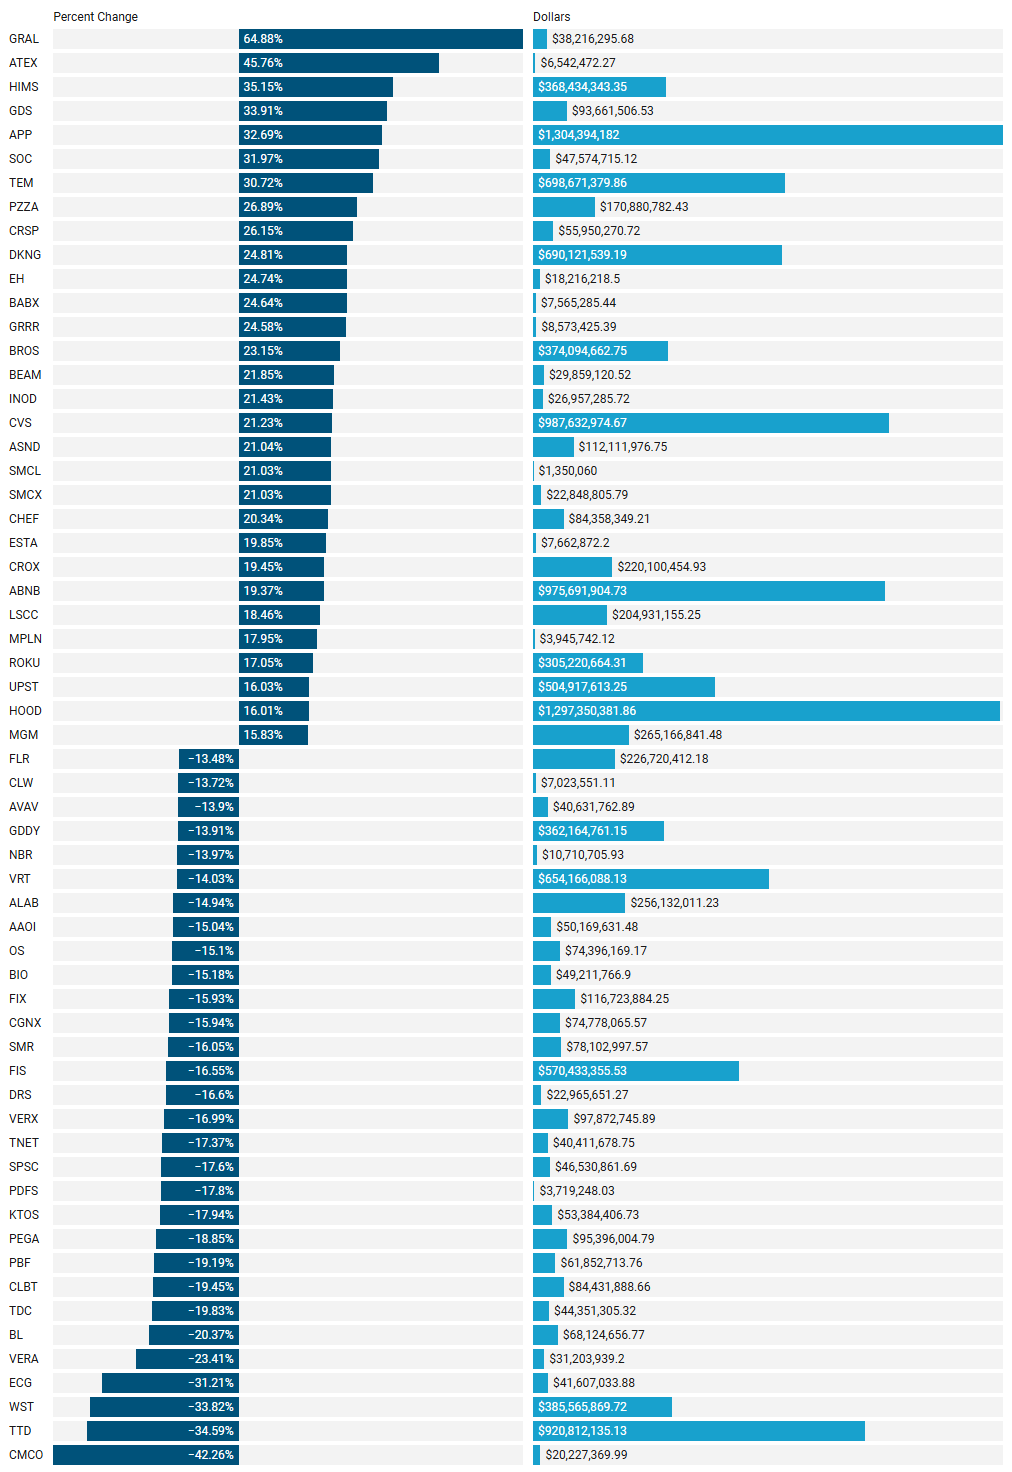
Last Week’s Institutionally-Backed Gainers & Losers
If you’re going to bet on a name, consider one that is officially endorsed by an institution! These are the top percent gainers (green) and percent losers (red) from this week’s open-to-close that had a trade price greater than $20 and institutional involvement. Continue watching tickers from this and prior stacks as these names frequently turn into multi-leg trades with a lot of movement!
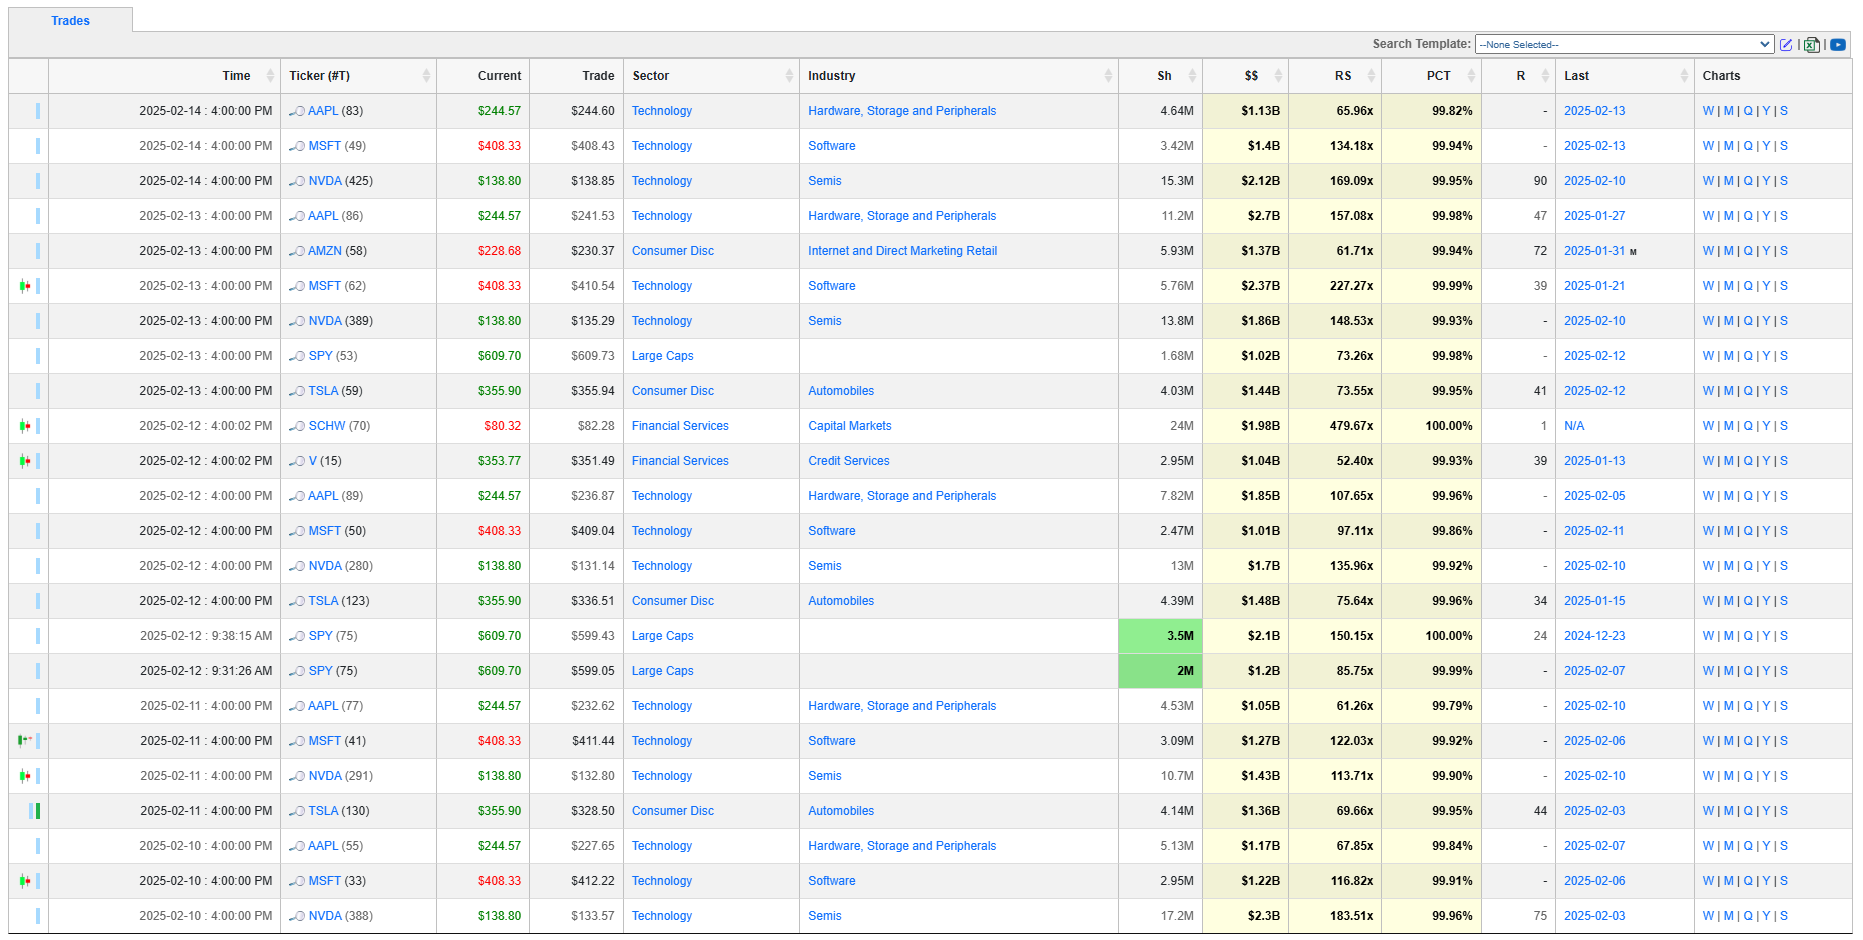
Last Week’s Billion-Dollar Prints
Tickers that printed a trade worth at least $1B last week get a special shout-out… Welcome to the club. These are massive commitments by institutions that should not be ignored.
Investments In Focus: Bull vs Bear Arguments
Institutions leave footprints that VolumeLeaders.com can illustrate for you while providing context to assess things like institutional conviction and urgency. Theses and data given below are not financial advice, just personal observations that may be wrong; consult a certified financial advisor before making any investment decisions.
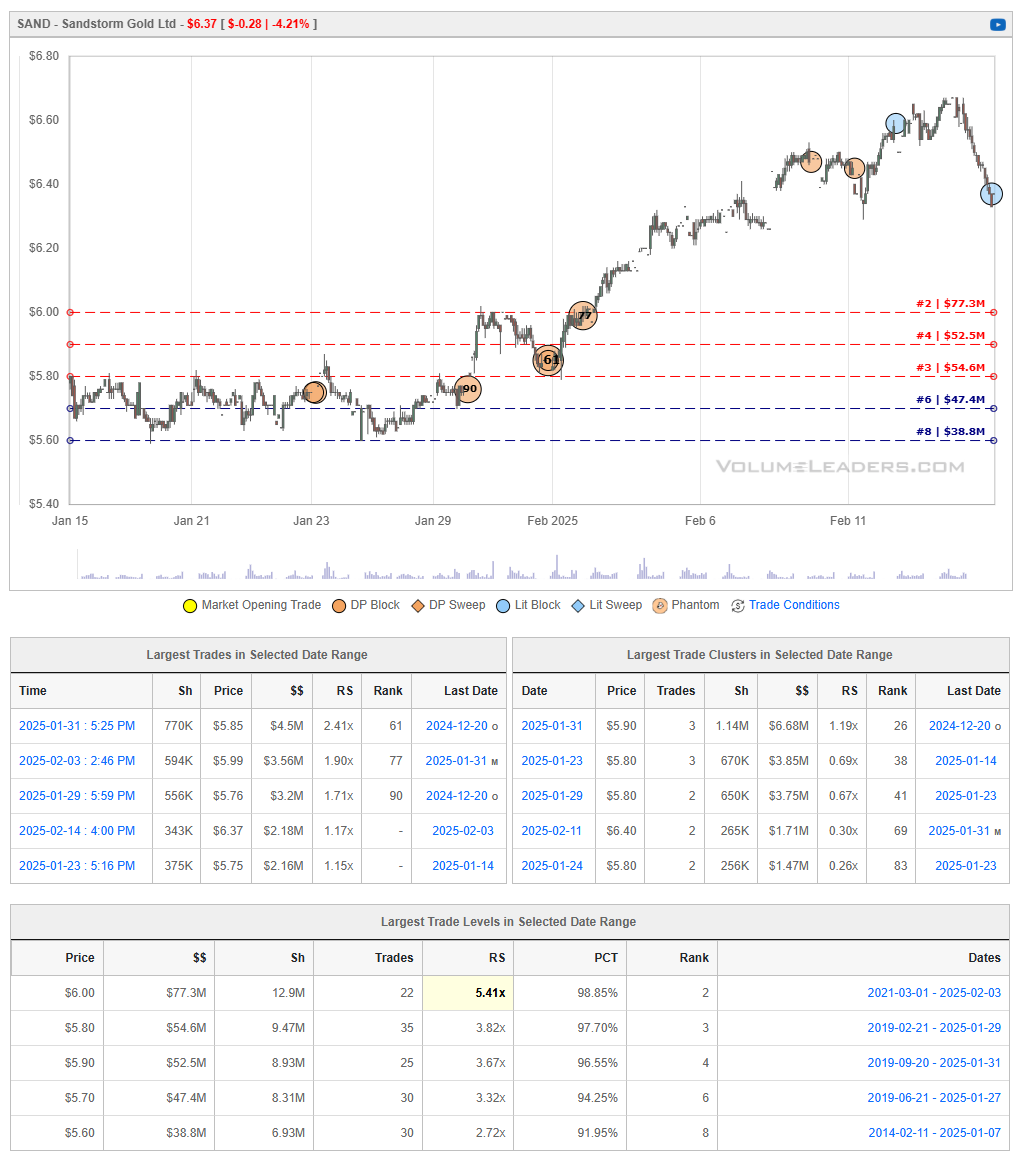
SAND 0.00%↑
Sandstorm Gold Ltd. (NYSE: SAND) is a Canadian-based gold royalty company that provides financing to gold mining companies in exchange for a percentage of the revenue or production from their mines. This business model offers investors exposure to gold prices without the operational risks associated with mining activities.
Bullish Perspective for Sandstorm Gold Ltd. (NYSE: SAND)
Diversified Gold Exposure Without Operational Risks
Sandstorm Gold operates a royalty and streaming model, allowing it to benefit from gold production and price appreciation without the risks and high costs associated with direct mining operations.
The company receives a percentage of mine revenues or gold production from multiple mines, providing diversified exposure across different projects.
Growing Portfolio and Future Expansion
Sandstorm has steadily expanded its royalty portfolio, with over 250 royalties and streaming agreements in place.
New project acquisitions, such as the development of advanced-stage mines, enhance long-term revenue potential.
Consistent Revenue Growth and Dividend Payments
Sandstorm has reported steady revenue growth due to rising gold prices and increased mine production from its partners.
The company pays a dividend (C$0.02 per share per quarter), making it an attractive option for income-focused investors.
Strong Balance Sheet and Capital Efficiency
The company maintains a healthy balance sheet with manageable debt levels, ensuring financial stability and the ability to pursue future acquisitions.
Unlike mining companies that require continuous reinvestment in operations and exploration, Sandstorm benefits from its passive royalty model, leading to more stable margins.
Gold Price Appreciation as a Catalyst
As a gold-focused company, Sandstorm benefits from higher gold prices, which tend to rise during inflationary periods and economic uncertainty.
If central banks continue their rate-cutting cycle, gold prices could see further upside, directly benefiting Sandstorm’s revenue.
Bearish Perspective for Sandstorm Gold Ltd. (NYSE: SAND)
Dependency on Mining Partners' Performance
Sandstorm does not control mining operations, meaning its revenue is dependent on the production efficiency and financial health of the miners it partners with.
If a mining project underperforms, gets delayed, or encounters technical/geopolitical issues, Sandstorm's revenue streams could be negatively impacted.
Stock Volatility and Sensitivity to Gold Prices
Sandstorm's stock price closely tracks gold prices, meaning any downturn in the gold market could weigh heavily on its valuation.
A prolonged period of lower gold prices could reduce profitability, especially since royalty income is directly tied to metal sales.
Higher Interest Rate Environment Could Dampen Gold Demand
If inflation subsides and central banks maintain or increase interest rates, gold prices could decline, affecting Sandstorm’s revenues.
Unlike dividend-paying stocks with strong cash flows, gold investments become less attractive when real yields rise.
Competition from Larger Royalty Companies
Sandstorm competes with bigger royalty and streaming companies like Franco-Nevada (FNV) and Wheaton Precious Metals (WPM), which have more extensive portfolios and greater financial flexibility.
Larger competitors have the capital to secure better royalty deals, potentially limiting Sandstorm’s ability to acquire lucrative new agreements.
Limited Organic Growth and Acquisition Risks
Unlike mining companies that can expand production, Sandstorm's growth is reliant on acquiring new royalties and its partners increasing output.
If Sandstorm overpays for acquisitions or takes on too much debt, its financial position could be weakened, limiting future growth opportunities.
Sandstorm Gold Ltd. offers an attractive investment opportunity for those seeking exposure to gold prices while avoiding direct mining risks. Its diversified royalty model, stable revenue stream, and dividend payments provide a compelling bullish case, especially in a rising gold price environment. However, the company's reliance on mining partners, sensitivity to gold prices, and competition from larger royalty firms pose notable risks. Investors should consider these factors when evaluating Sandstorm as a long-term gold investment.
NET 0.06%↑
Cloudflare, Inc. (NYSE: NET) is a global cloud services provider specializing in content delivery, internet security, and infrastructure solutions.
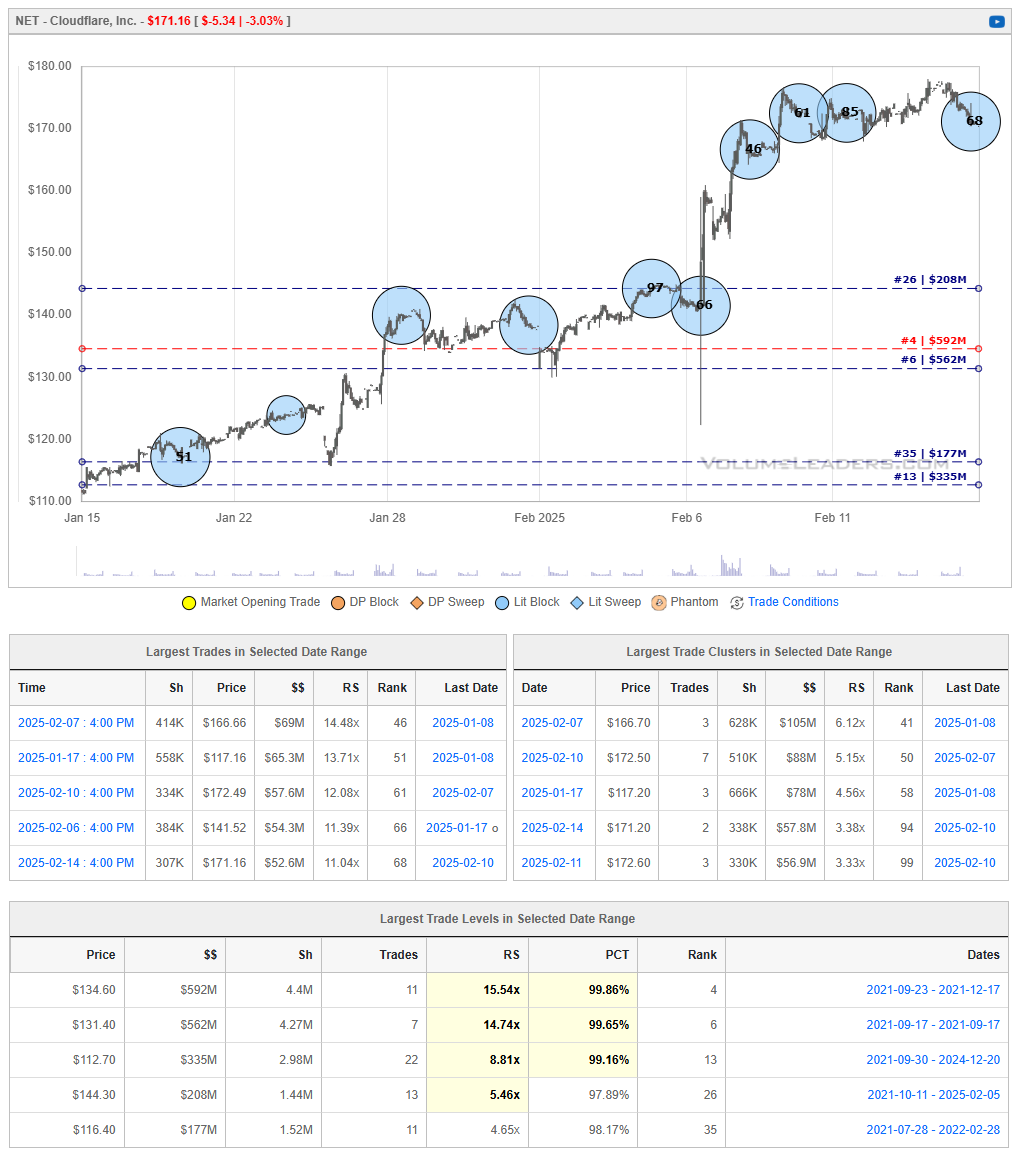
Recent Performance and Developments:
Stock Milestone: On February 14, 2025, Cloudflare's stock reached a 52-week high of $176.77, reflecting robust growth and positive investor sentiment.
Earnings Report: In the fourth quarter of 2024, the company reported earnings of $0.19 per share and revenue of $459.9 million, surpassing analyst expectations. Management highlighted significant opportunities in the AI sector, particularly in AI inference services.
Analyst Ratings: Argus raised its price target for Cloudflare to $205 from $108, maintaining a "Buy" rating. The average 12-month price target among analysts is $161.41, with forecasts ranging between $100 and $205.
Bullish Perspective:
AI Market Expansion: Cloudflare's focus on AI inference positions it to capitalize on the growing demand for AI-driven services, potentially leading to new revenue streams.
Developer Ecosystem Growth: The company's developer base expanded from 2 million to 3 million in 2024, indicating increased adoption of its platform and services.
Strong Financial Metrics: With a gross profit margin of 77.32% and consistent revenue growth, Cloudflare demonstrates solid financial health.
Bearish Perspective:
Valuation Concerns: Despite positive performance, the current stock price exceeds the average analyst price target, suggesting potential overvaluation.
Insider Selling: Recent insider transactions, including sales by CEO Matthew Prince and CFO Thomas Seifert, may raise questions about internal confidence in the stock's future performance.
Market Volatility: The technology sector's inherent volatility could impact Cloudflare's stock performance, especially amid broader economic fluctuations.
In summary, Cloudflare's advancements in AI services, expanding developer community, and strong financial metrics present a compelling growth narrative. However, potential investors should weigh valuation considerations, insider trading activities, and market volatility when evaluating the stock.
MAT 0.00%↑
Mattel, Inc. (NASDAQ: MAT) is a leading global toy company renowned for iconic brands such as Barbie, Hot Wheels, and Fisher-Price. As of February 15, 2025, the stock is trading at $21.94, with an intraday high of $22.06 and a low of $21.09.
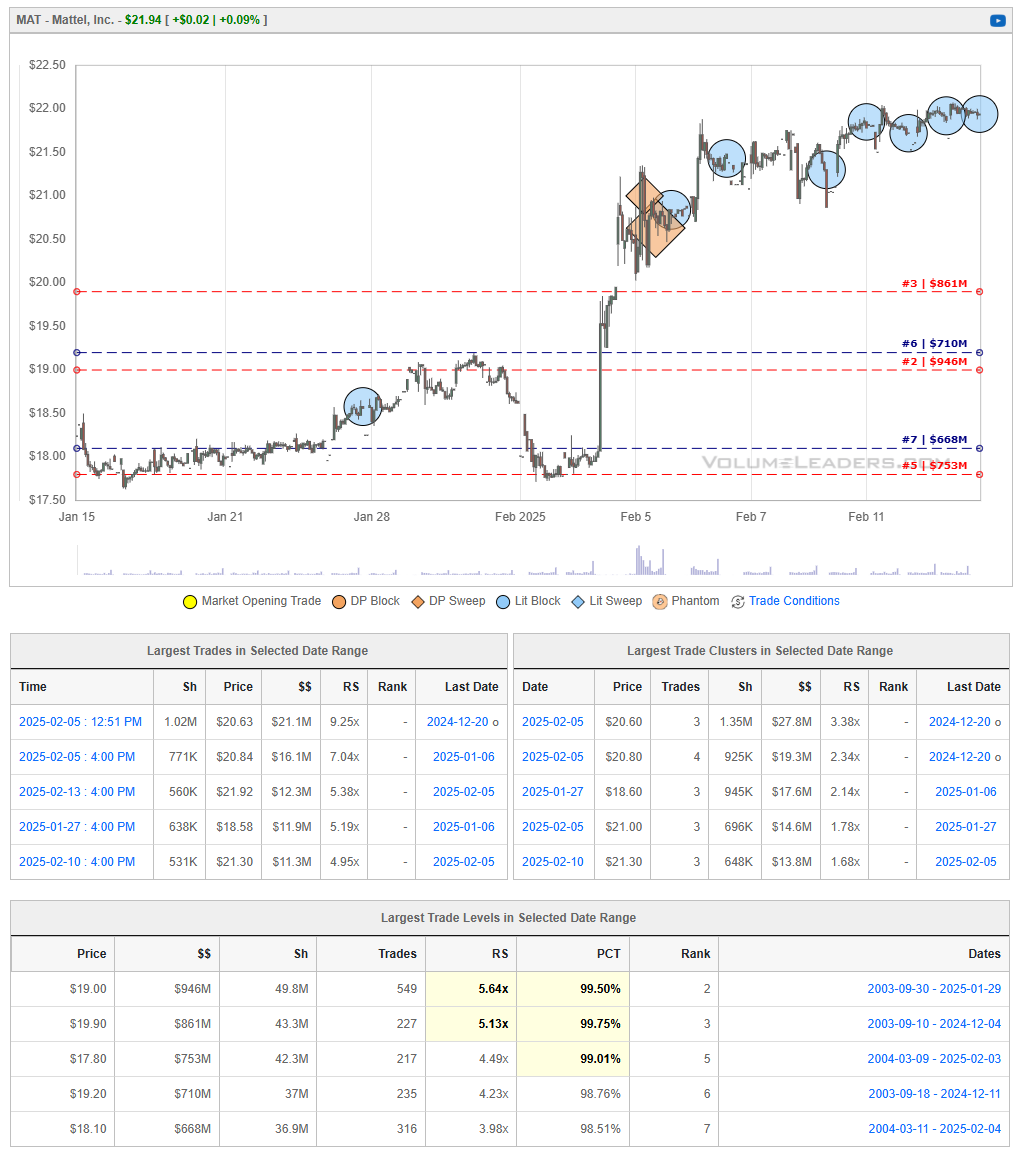
Recent Developments:
Financial Performance: In the fourth quarter of 2024, Mattel reported net sales of $1.646 billion, a 2% increase from the previous year, and a gross margin of 49.1%.
Share Buyback Program: The company announced a $600 million share repurchase plan for 2025, aiming to enhance shareholder value.
Product Innovations: Mattel introduced a Barbie doll honoring EGOT winner Rita Moreno, expanding its Tribute Collection.
Operational Adjustments: In response to tariffs on Chinese imports, Mattel is considering price adjustments for products like Barbie and Hot Wheels and plans to reduce manufacturing in China to below 40% by 2025.
Bullish Perspective:
Strong Brand Portfolio: Mattel's ownership of globally recognized brands provides a competitive advantage and consistent revenue streams.
Strategic Share Repurchase: The $600 million buyback plan reflects confidence in financial stability and is expected to boost earnings per share.
Innovative Product Launches: Introducing new products, such as the Rita Moreno Barbie, keeps the brand relevant and attracts diverse consumer demographics.
Operational Diversification: Reducing reliance on Chinese manufacturing mitigates geopolitical risks and potential tariff impacts.
Bearish Perspective:
Supply Chain Challenges: Tariffs and global supply chain disruptions may lead to increased production costs and potential price hikes, affecting demand.
Market Competition: The toy industry is highly competitive, with digital entertainment alternatives posing challenges to traditional toy sales.
Recent Controversies: Incidents like the misprinted website on "Wicked" dolls' packaging could impact brand reputation and consumer trust.
In summary, Mattel's robust brand portfolio, strategic financial decisions, and commitment to innovation position it well in the market. However, investors should consider supply chain issues, competitive pressures, and potential reputational risks when evaluating the company's prospects.
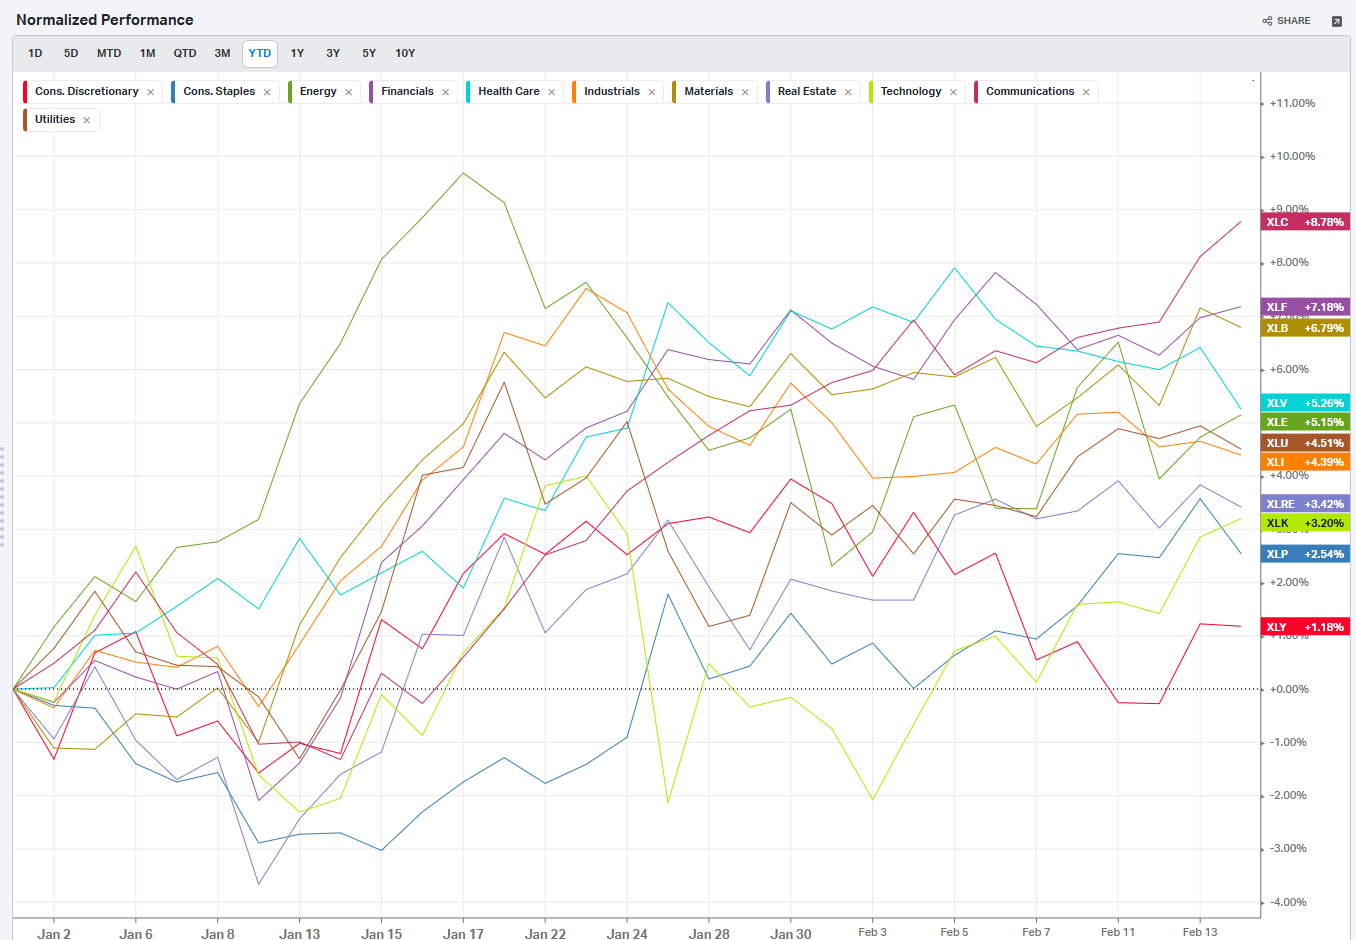
Summary Of Thematic Performance YTD
VolumeLeaders.com provides a lot of pre-built filters for thematics so that you can quickly dive into specific areas of the market. These performance overviews are provided here only for inspiration. Consider targeting leaders and/or laggards in the best and worst sectors, for example.
S&P By Sector
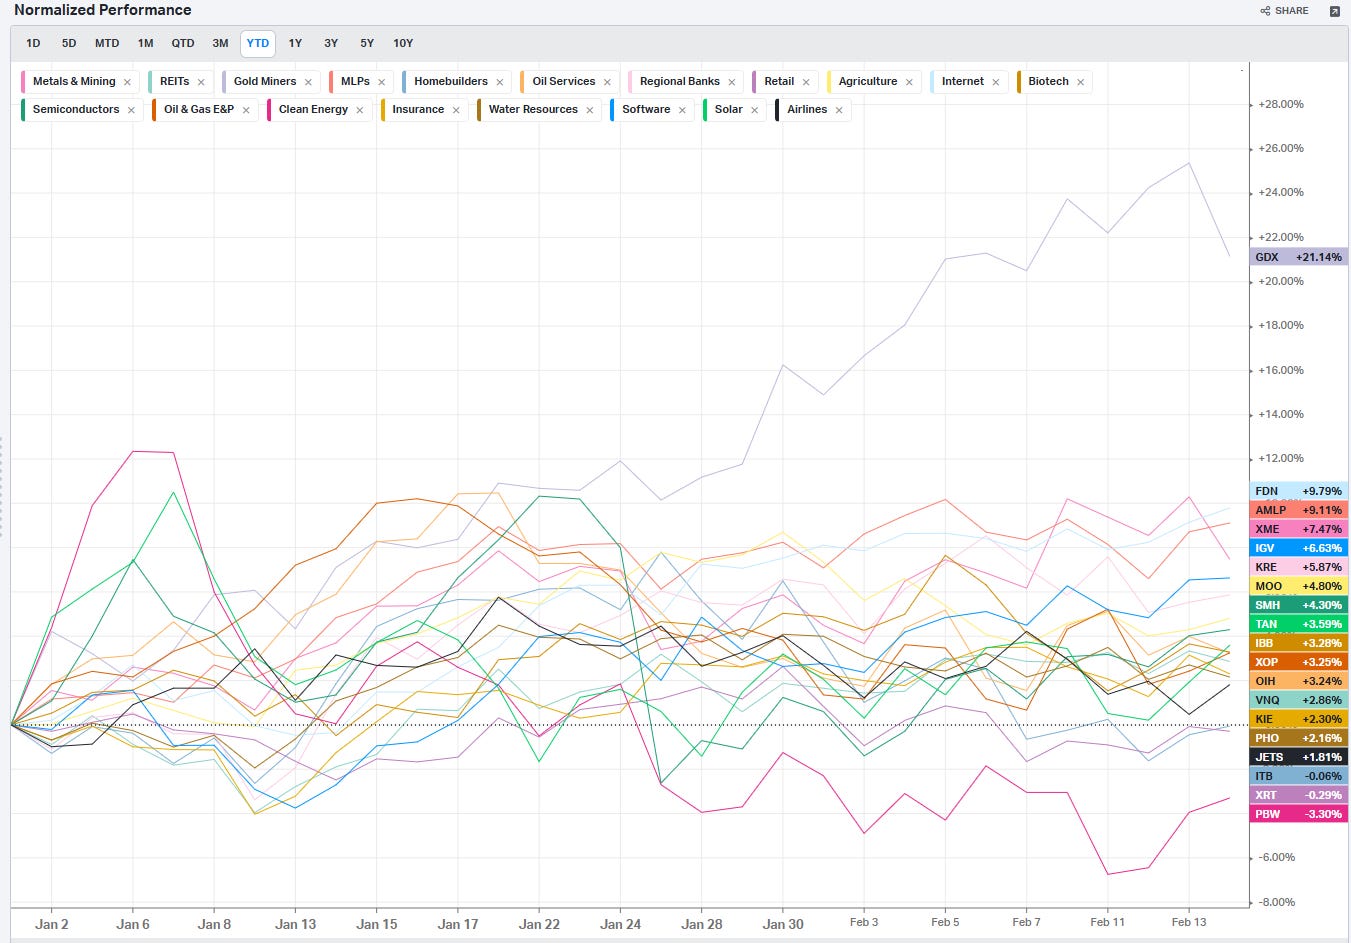
S&P By Industry
Commodities: Energy

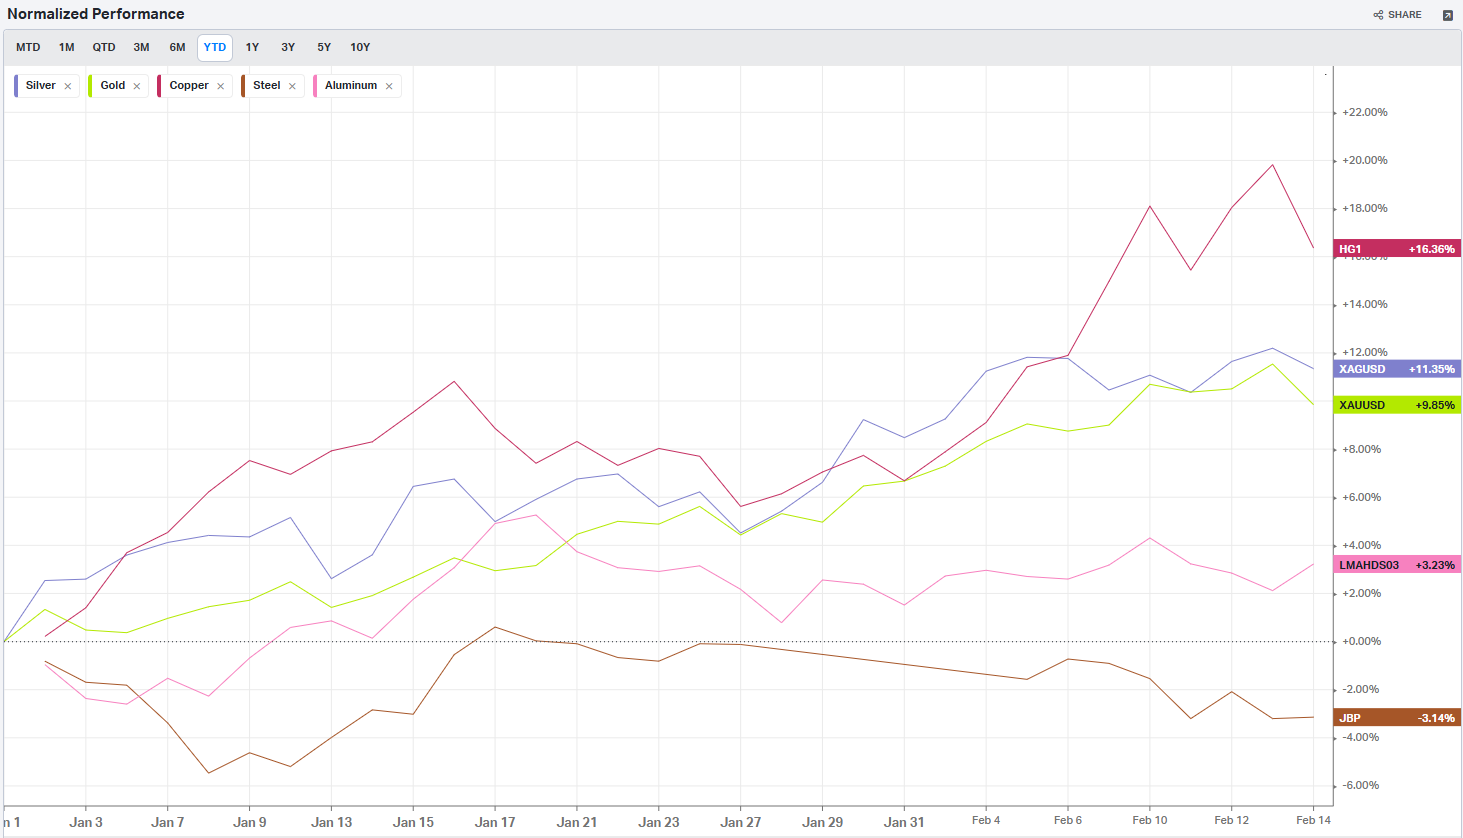
Commodities: Metals
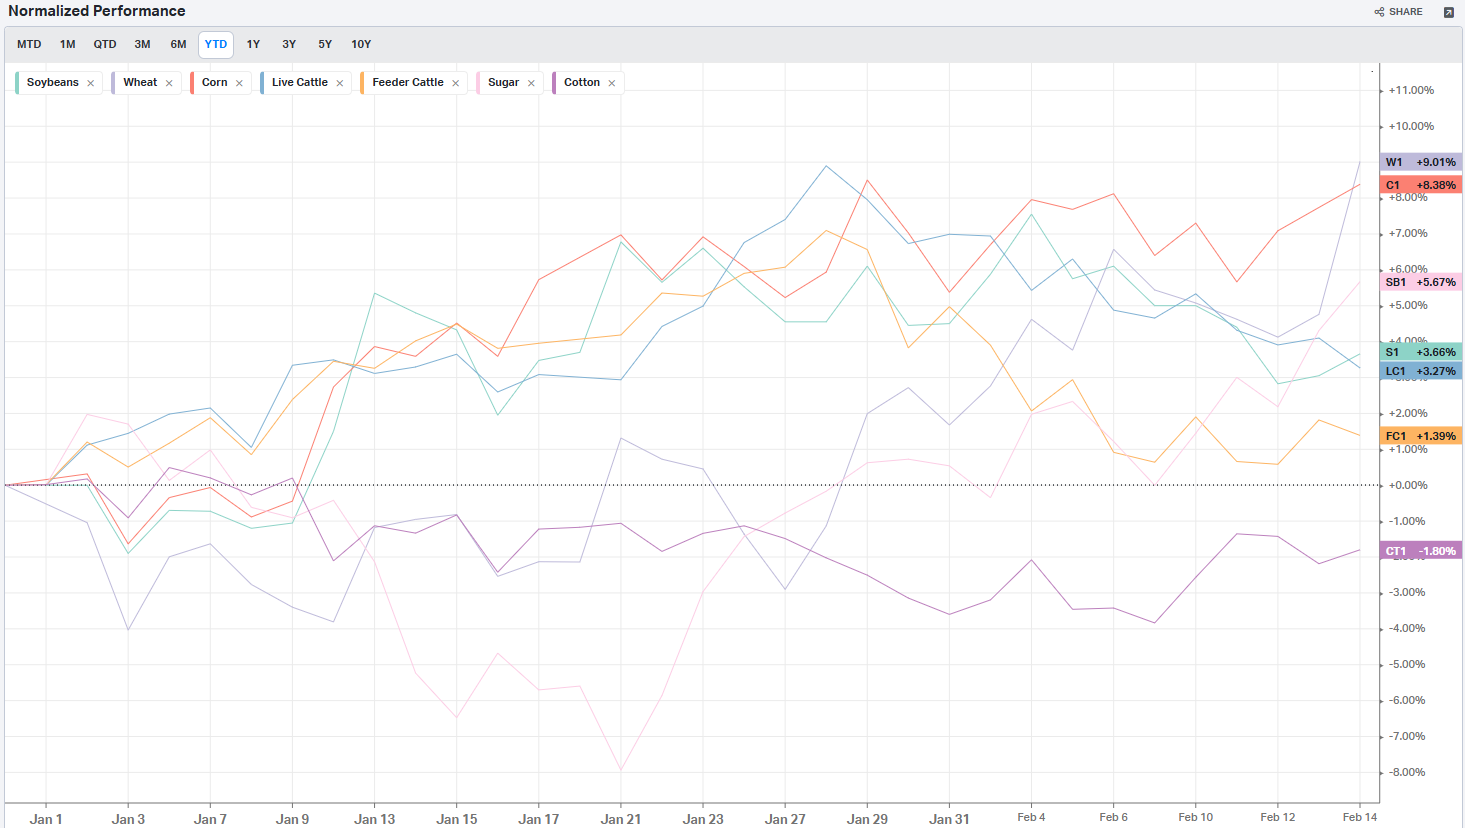
Commodities: Agriculture
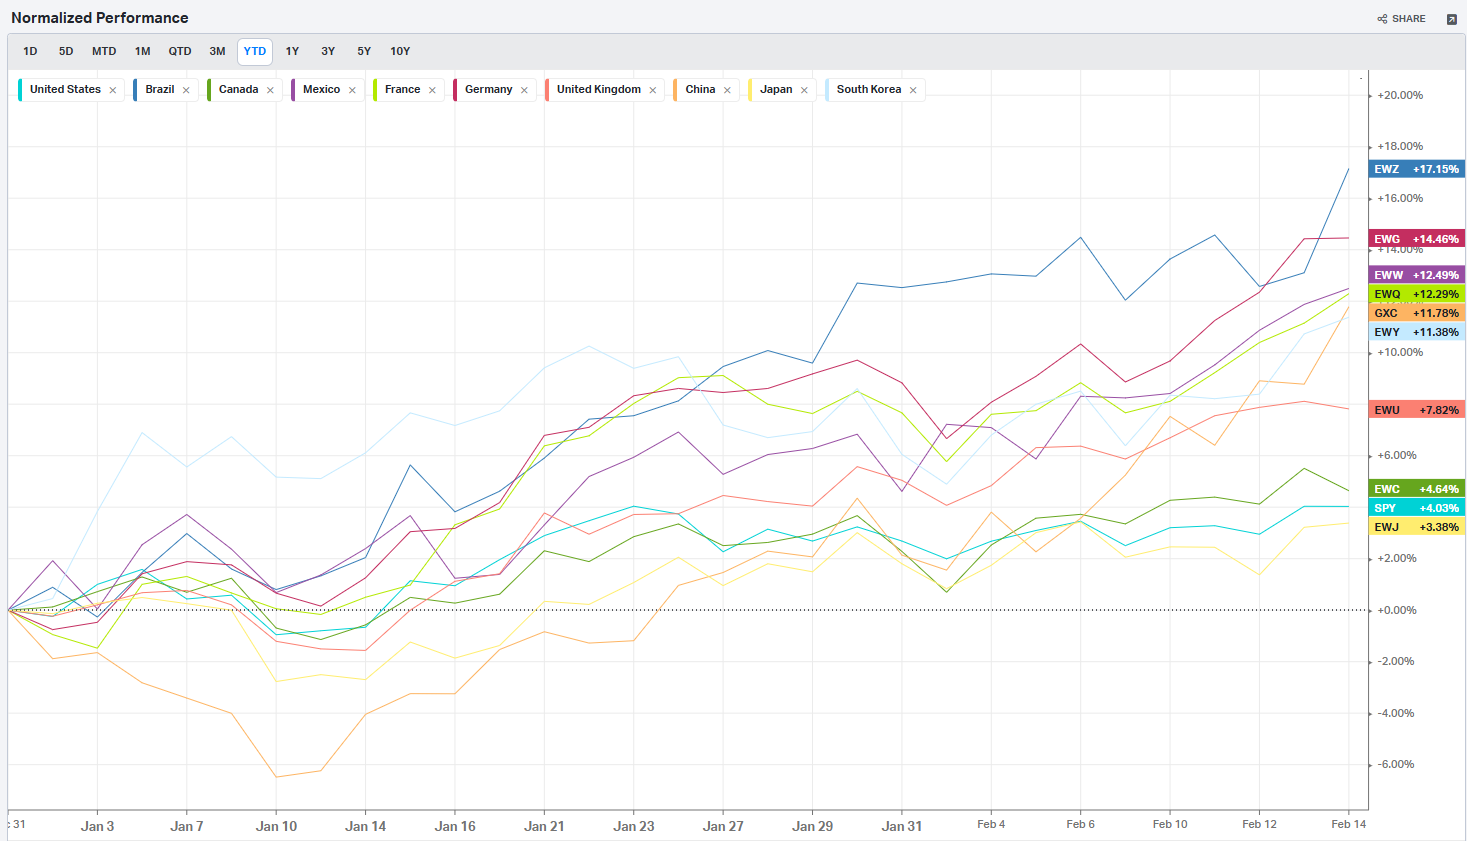
Country ETFs
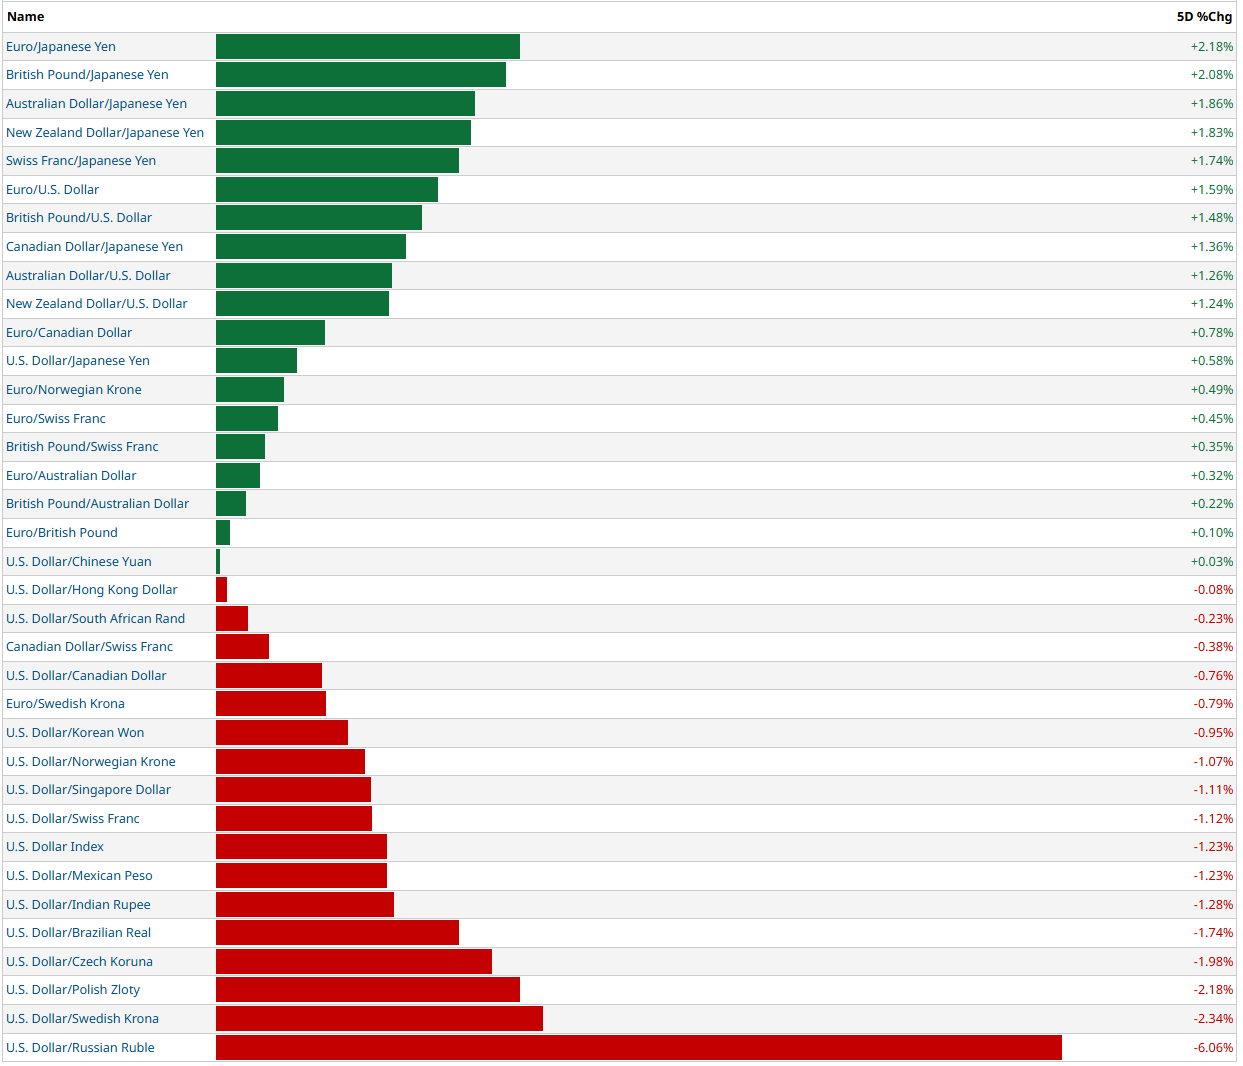
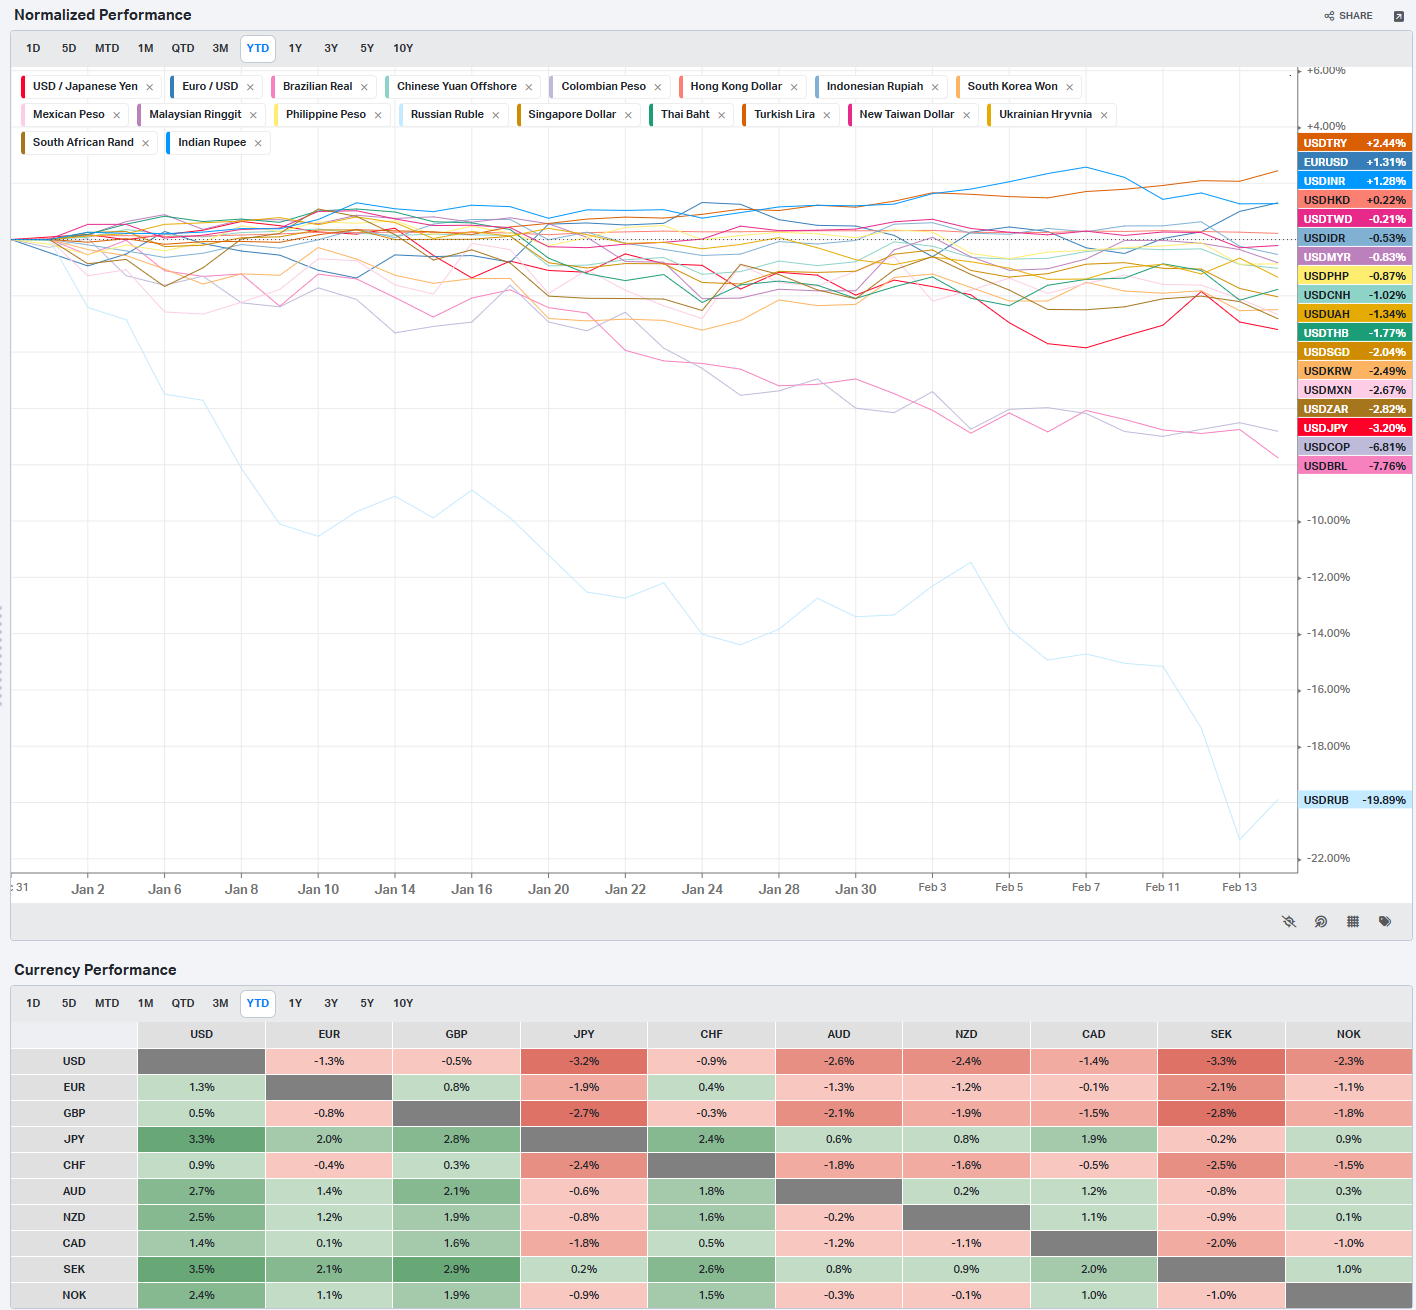
Currencies
Global Yields
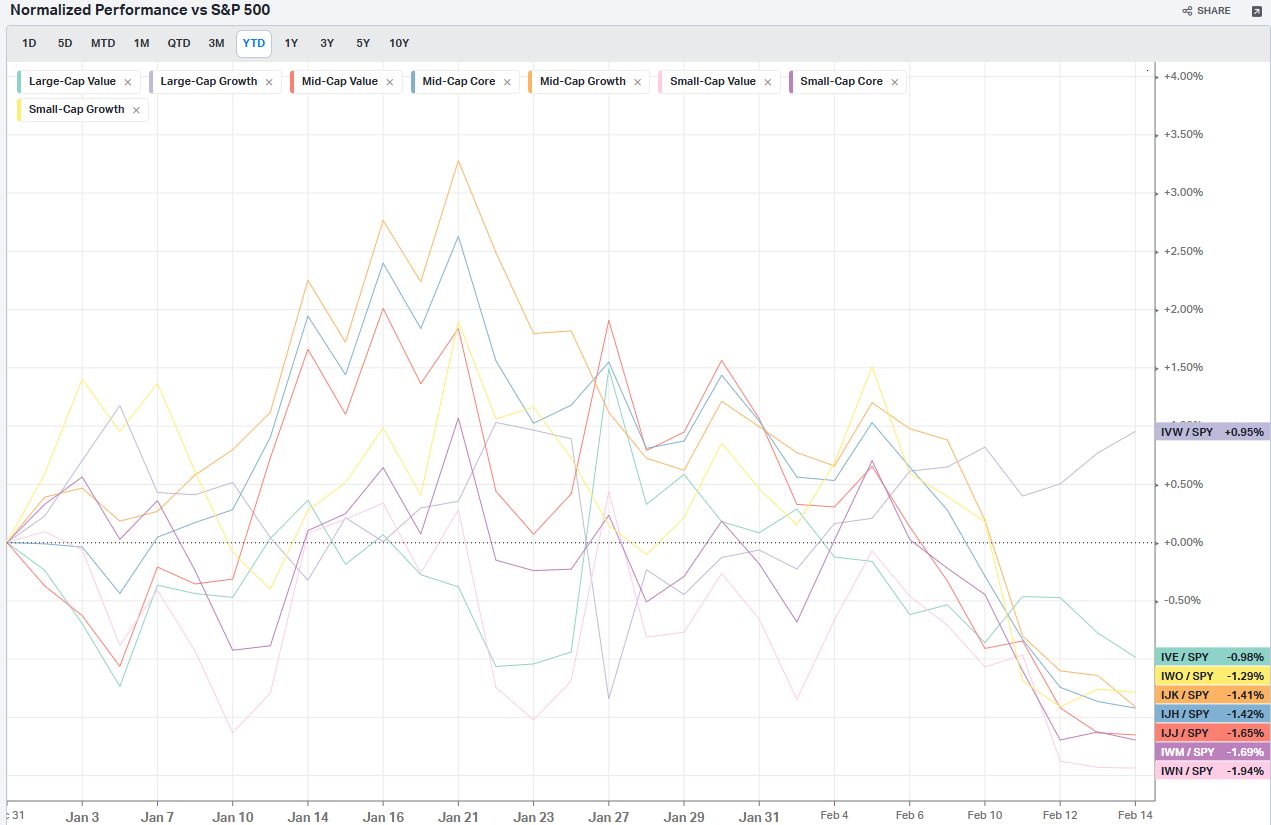
Factors: Style
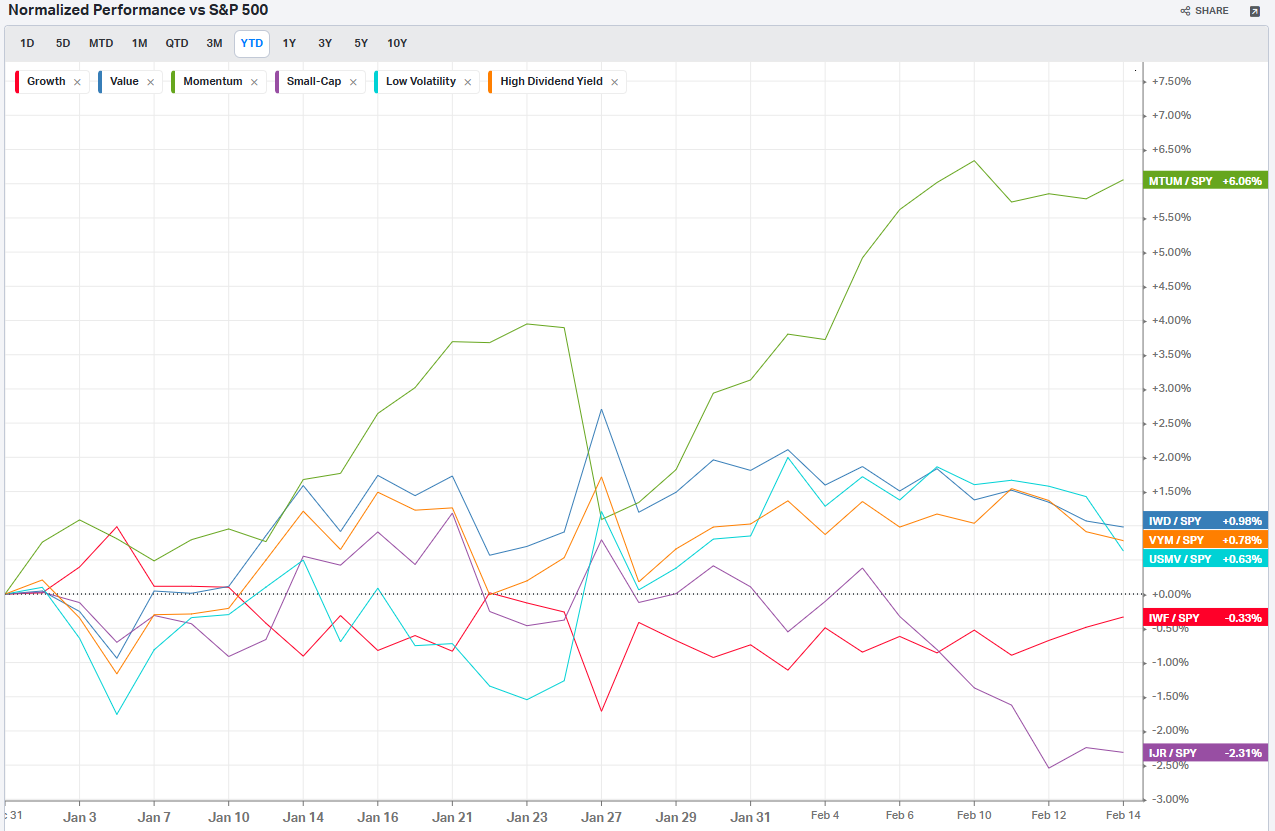
Factors: Size vs Value
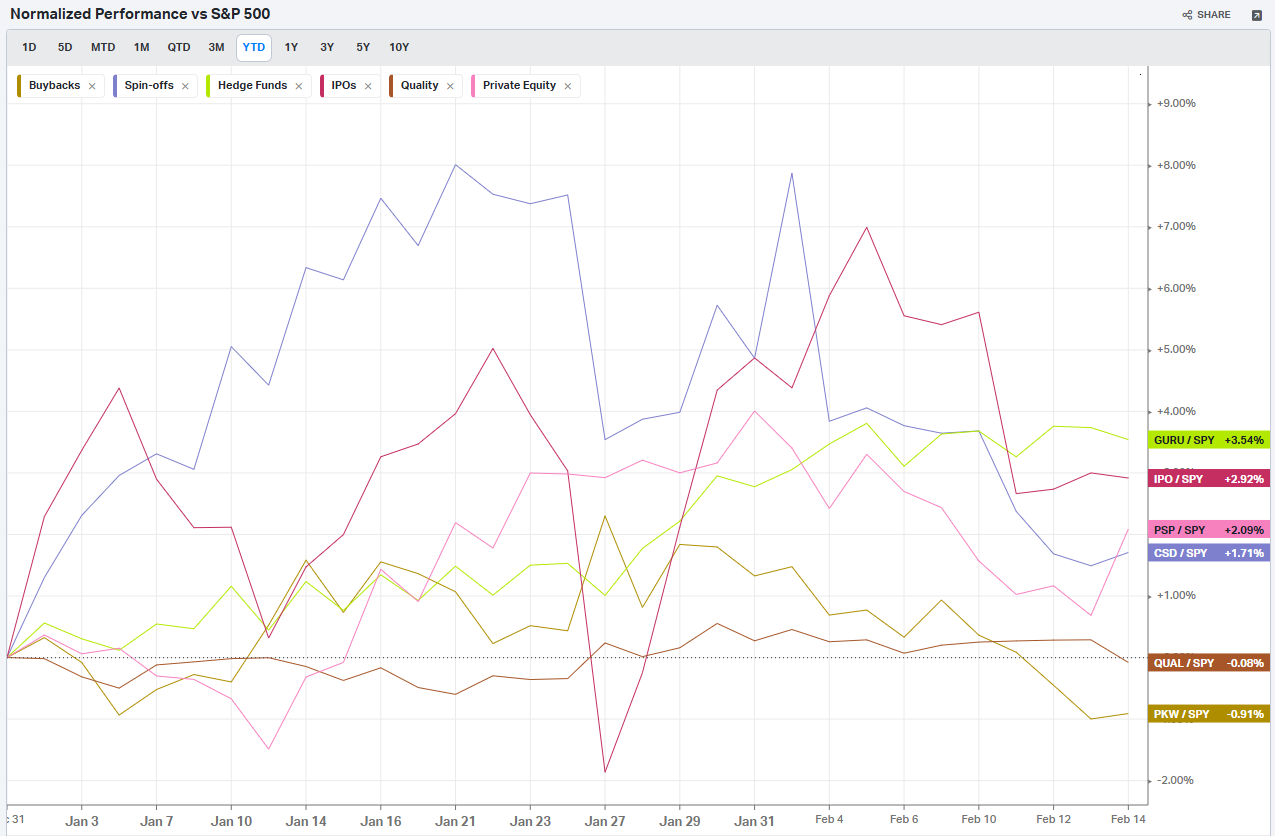
Factors: Qualitative
Social Media Favs
Analyzing social sentiment can provide valuable insights for investment strategies by offering a pulse on public perception, mood, and market sentiment that traditional financial indicators might not capture. Here’s how social sentiment analysis can enhance investment decisions:
Market Momentum: Positive or negative social sentiment can signal impending momentum shifts. When public opinion on a stock, sector, or asset class changes sharply, it can create buying or selling pressure, especially if that sentiment becomes widespread.
Early Detection of Trends: Social sentiment data can help investors spot trends before they show up in technical or fundamental data. For example, increased positive chatter around a particular company or sector might indicate growing interest or excitement, which could lead to price appreciation.
Gauge Retail Investor Impact: With the rise of retail investor platforms, collective sentiment on social media can lead to significant price movements (e.g., meme stocks). Understanding how retail investors view certain stocks can help in identifying high-volatility opportunities.
Event Reaction Monitoring: Social sentiment can provide real-time reactions to news events, product releases, or earnings reports. Investors can use this information to gauge market reaction quickly and adjust their strategies accordingly.
Complementing Quantitative Models: By adding a social sentiment layer to quantitative models, investors can enhance predictions. For example, a model that tracks historical price and volume data might perform even better when factoring in sentiment trends as a measure of market psychology.
Risk Management: Negative sentiment spikes can be a signal of potential downturns or increased volatility. By monitoring sentiment, investors might avoid or hedge against investments in companies experiencing a public relations crisis or facing negative perceptions.
Long-Term Sentiment Trends: Sustained sentiment trends, whether positive or negative, often mirror longer-term market cycles. Tracking sentiment trends over time can help identify shifts in investor psychology that could affect longer-term investments or sector rotations.
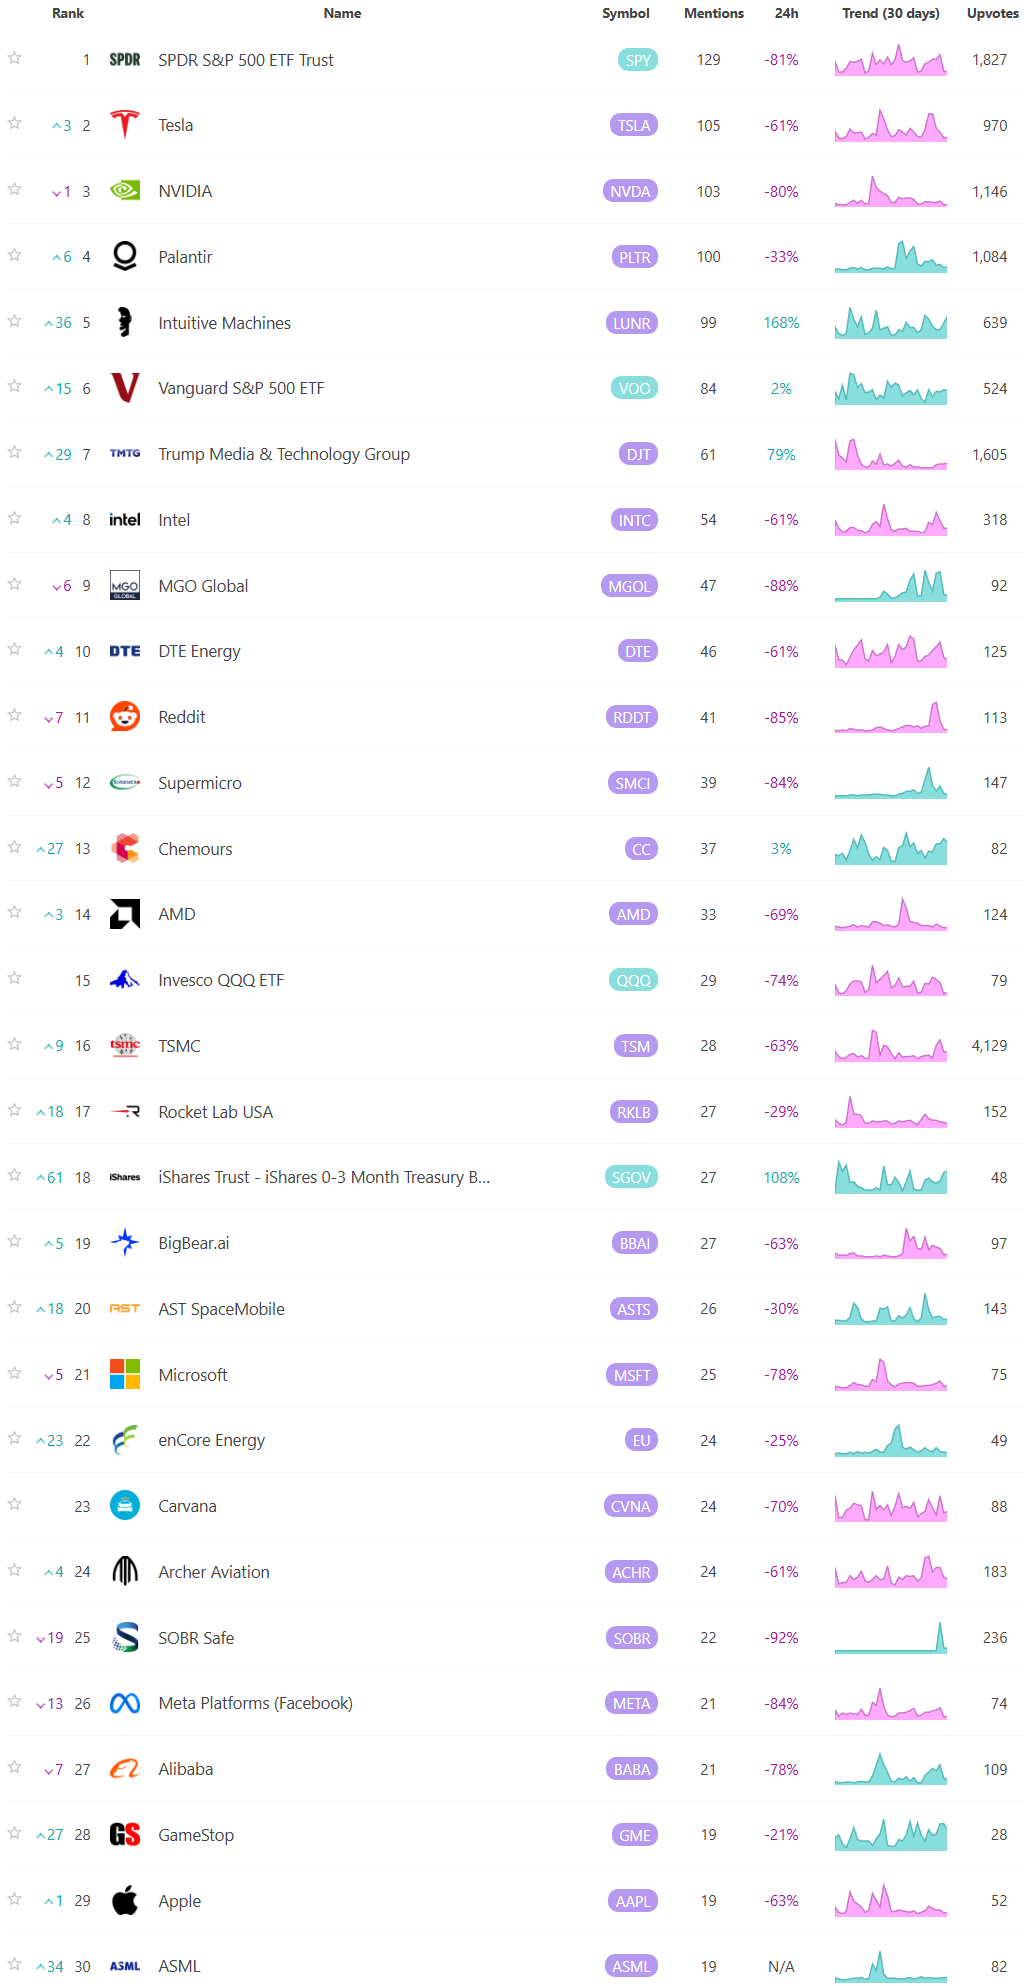
For these reasons, sentiment analysis, when combined with other tools, can provide a comprehensive view of both immediate market reactions and underlying investor attitudes, helping investors position themselves strategically across various time frames. Here are the most mentioned/discussed tickers on Reddit from some of the most active Subreddits for trading:
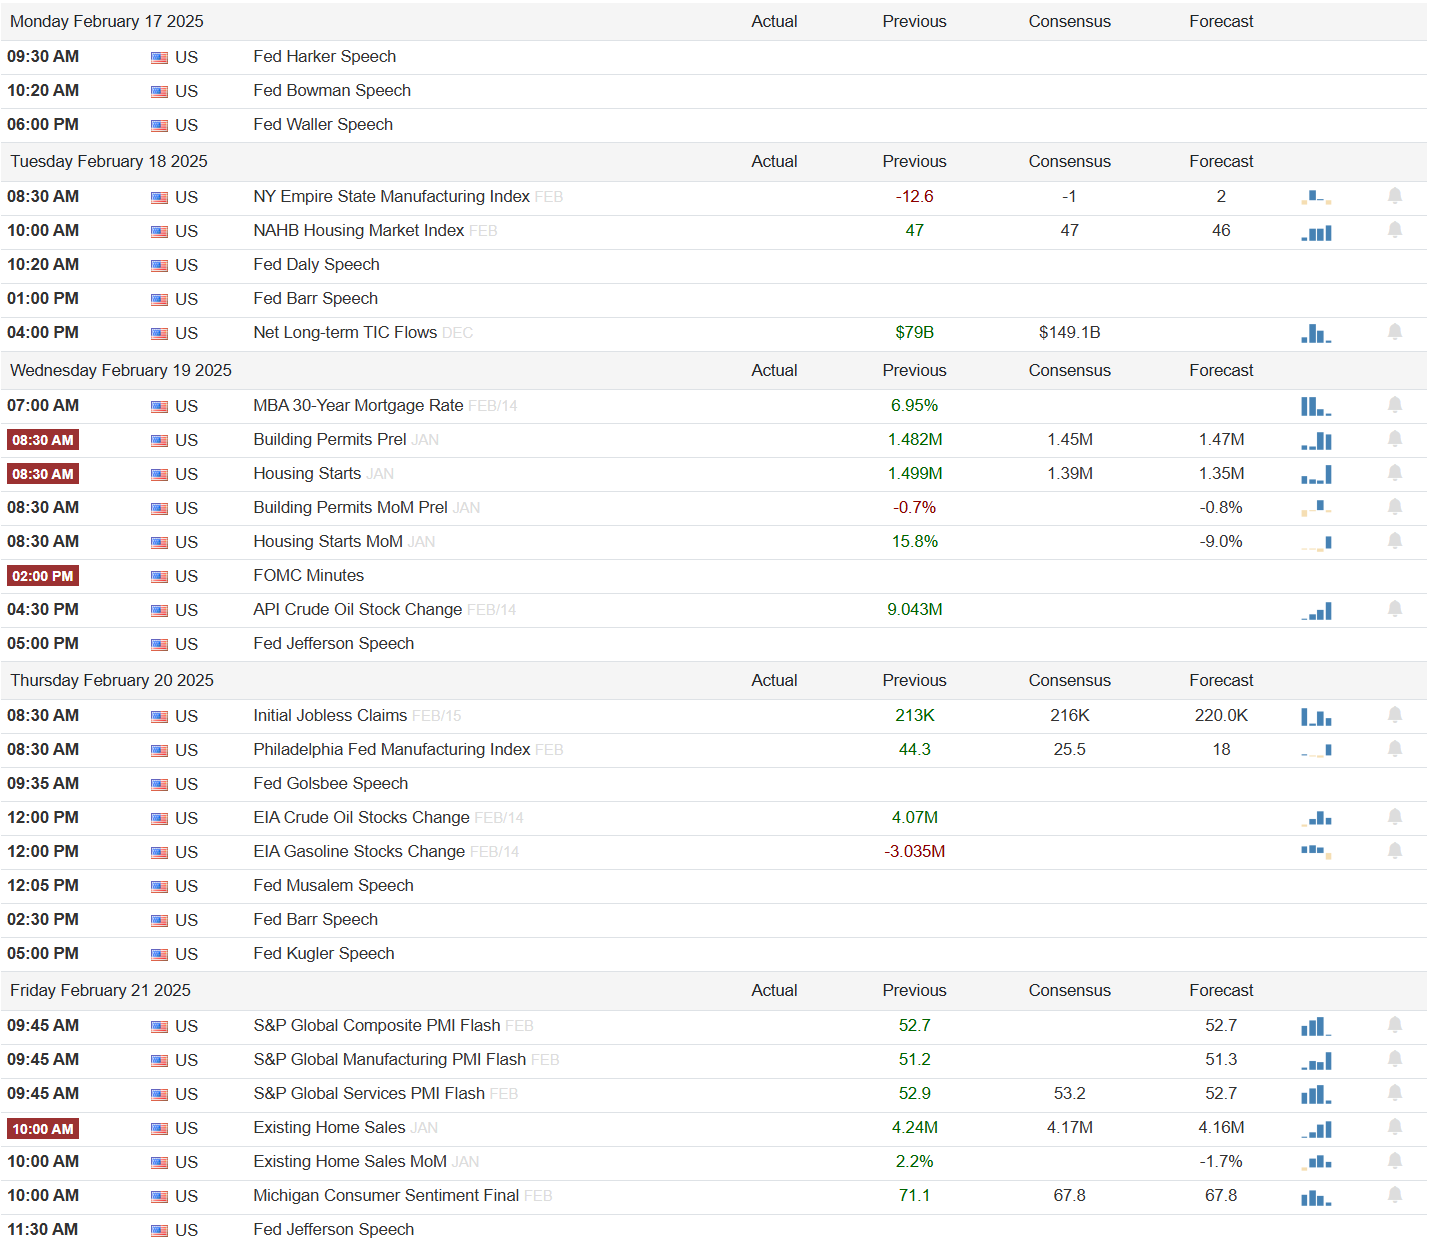
Events On Deck This Week
Here are key events happening this week that have the potential to cause outsized moves in the market or heightened short-term volatility.
Econ Events By Day of Week
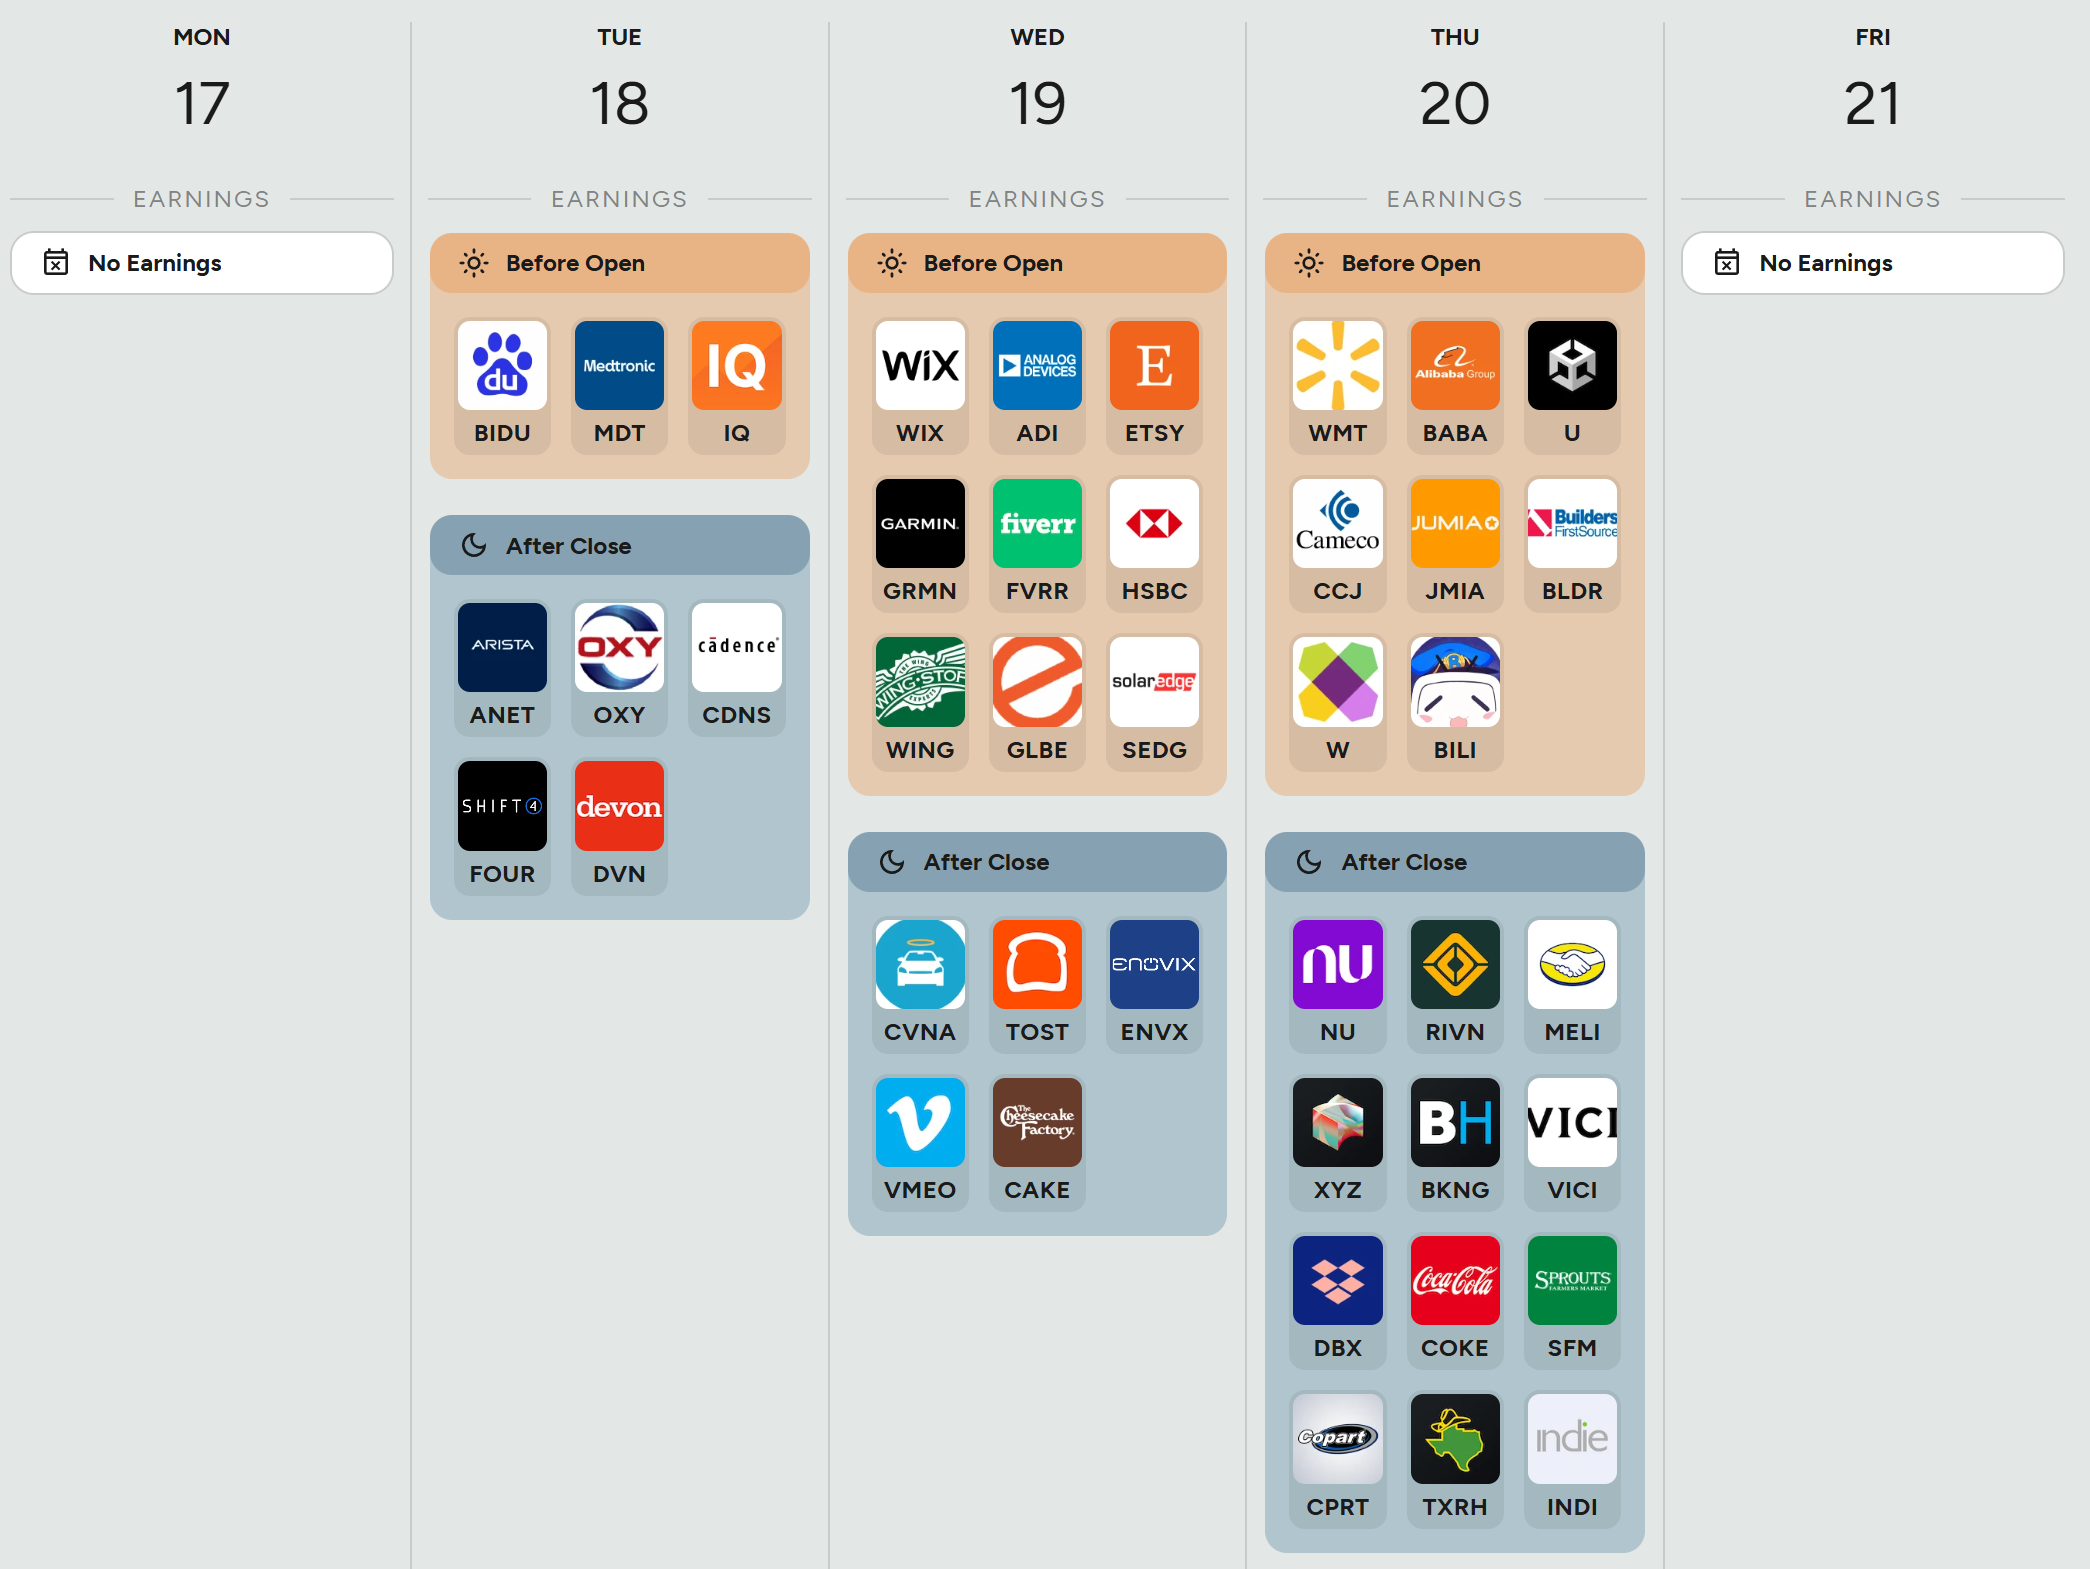
Anticipated Earnings By Day of Week
Thank you for being part of our community and for taking the time to read this publication. Your engagement and insights mean a great deal to all of us, and we're genuinely grateful to share this space with such dedicated and thoughtful readers. Wishing you a productive and successful week ahead in the markets. May the coming days bring clarity and great opportunities. Happy trading!