Market Momentum: Your Weekly Financial Forecast & Market Prep
Issue 34 / What to expect Feb 24, 2025 thru Feb 28, 2025
In This Issue
Market-On-Close: All of last week’s market-moving news and macro context in under 5 minutes + futures-snapshots
The Latest Investor Sentiment Readings
Institutional Support & Resistance Levels For Major Indices: Exactly where to look for support and resistance this week in SPY, QQQ, IWM & DIA
Institutional Activity By Sector: Institutional order flow by sector including the top institutionally-backed names in those sectors. We break it all down and provide the key insights and take-aways you need to navigate institutional positioning this week.
Top Institutional Order Flow In Individual Names: All of the largest sweeps and blocks on lit exchanges and hidden dark pools
Investments In Focus: Bull vs Bear arguments for BEKE, DELL, SCHW
Top Institutionally-Backed Gainers & Losers: An explosive watchlist for day traders seeking high-volatility
Normalized Performance By Thematics YTD (Sector, Industry, Factor, Energy, Metals, Currencies, and more): which corners of the markets are beating benchmarks, which ones are overlooked and which ones are over-crowded
Key Econ Events and Earnings On-Deck For This Week

Market-On-Close
The past week in the U.S. financial markets was marked by volatility, sharp sell-offs, and concerns over economic indicators. Major indices experienced steep declines, reflecting investor anxiety over inflation expectations, corporate earnings, and regulatory developments. Global markets presented a mixed picture, while bond yields fluctuated in response to economic data and Federal Reserve expectations. With nearly two months of 2025 behind us, key market trends have begun to emerge, shaping the trajectory of equities, fixed income, and macroeconomic conditions for the months ahead.
Market Performance Overview
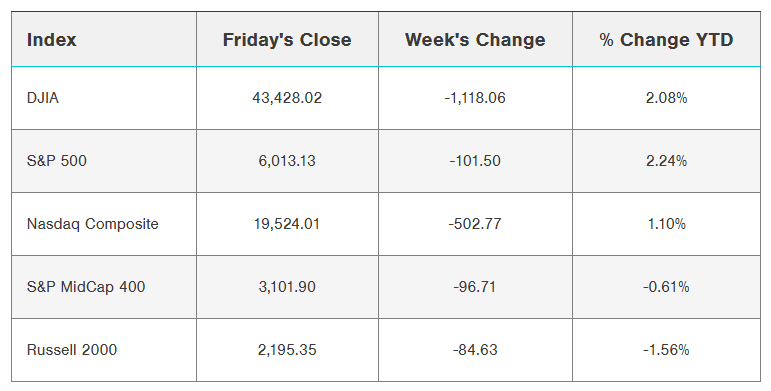
On Friday, the S&P 500 Index ($SPX) dropped -1.71%, the Dow Jones Industrial Average ($DOWI) fell -1.69%, and the Nasdaq 100 Index ($IUXX) plunged -2.06%. Futures contracts reflected similar declines, with March E-mini S&P futures (ESH25) down -1.70% and March E-mini Nasdaq futures (NQH25) down -2.07%. This sharp downturn was driven by a combination of corporate earnings disappointments, economic data misses, and growing inflation concerns.
The sell-off pushed the S&P 500 and Nasdaq 100 to one-week lows and the Dow Jones to a one-month low. Investors reacted negatively to earnings reports, particularly from Akamai Technologies, which tumbled more than -21% after issuing weaker-than-expected revenue guidance. Additionally, UnitedHealth Group fell more than -7% following reports that the U.S. Department of Justice had launched an investigation into its Medicare billing practices. A weaker-than-expected consumer sentiment report further weighed on investor confidence, reflecting growing economic concerns.
Key Economic Indicators and Their Market Impact
Several economic indicators released during the week contributed to the market's volatility:
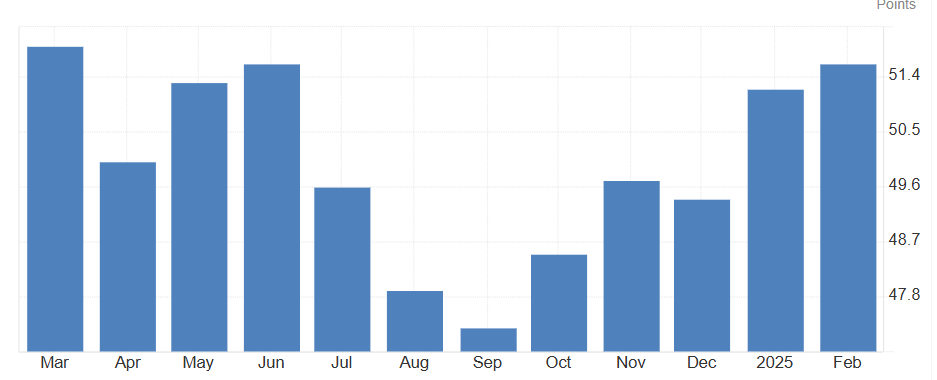
Manufacturing and Services Activity: The U.S. February S&P Global Manufacturing PMI rose slightly to 51.6, an 8-month high, indicating modest expansion in the sector. However, the Services PMI unexpectedly fell to 49.7, marking the steepest contraction in two years.

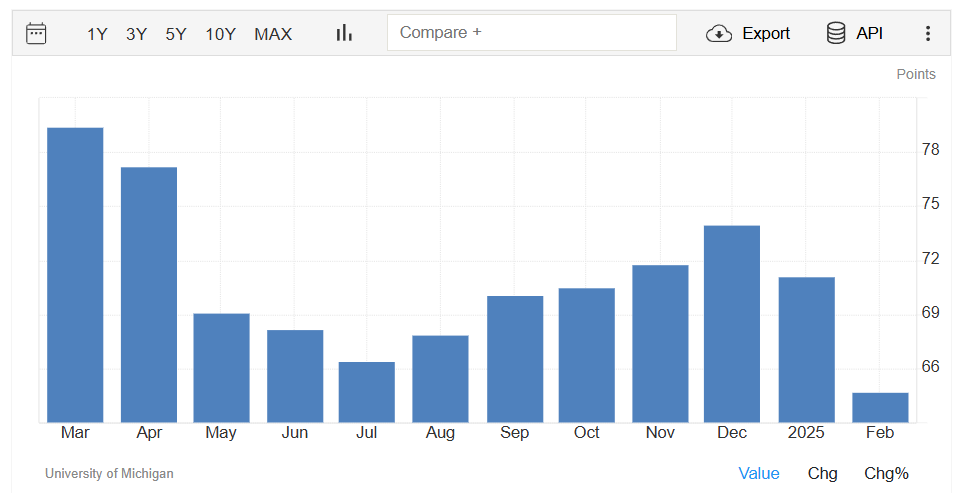
Consumer Sentiment: The University of Michigan’s Consumer Sentiment Index for February was revised lower to 64.7, a 15-month low. Notably, long-term inflation expectations surged to a 29-year high of 3.5%, exacerbating fears of persistent inflation.

Housing Market Weakness: January existing home sales declined -4.9% month-over-month to 4.08 million, well below expectations of a -2.6% decline. High mortgage rates and affordability challenges continued to weigh on the housing market.
Interest Rates and Bond Market Movements
U.S. Treasury yields saw sharp declines as investors sought safe-haven assets amid equity market turmoil. March 10-year Treasury notes (ZNH25) closed up, with the yield falling by -9.1 basis points to 4.414%. European bond markets also saw declines in yields, with the 10-year German bund yield falling -6.4 basis points to 2.470% and the UK gilt yield dropping -3.6 basis points to 4.571%.
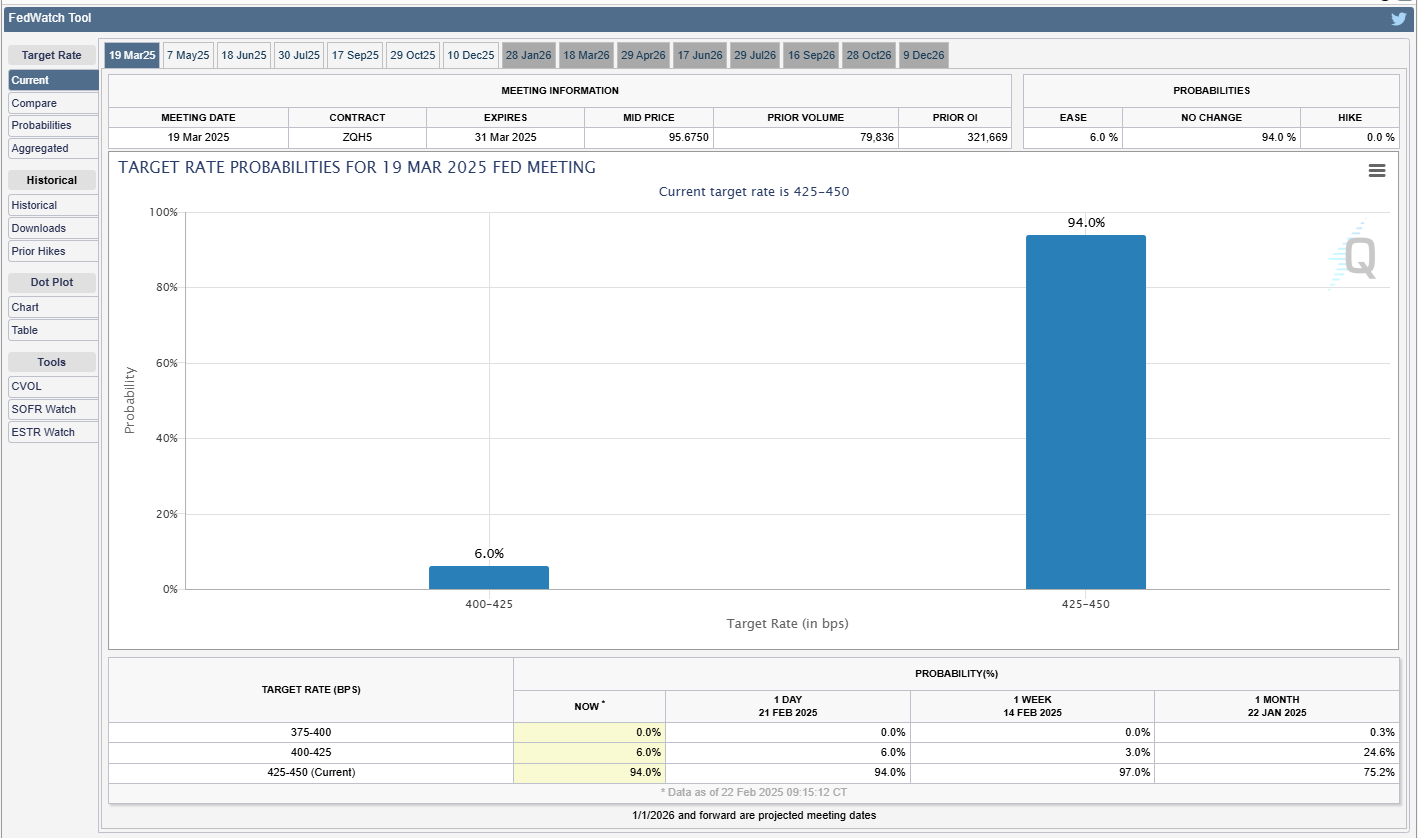
Expectations for a Federal Reserve rate cut in March remained low, with market pricing reflecting only a 6% probability of a -25 basis point cut at the next FOMC meeting on March 18-19. However, softening economic data and persistent inflation fears have raised speculation about potential policy adjustments later in the year.
Global Market Performance
Overseas markets provided a more optimistic picture. The Euro Stoxx 50 closed up +0.25%, while China’s Shanghai Composite climbed to a 7-week high, closing up +0.85%. Japan’s Nikkei 225 rebounded from a 2-1/2 week low to finish up +0.26%. These gains contrast with the struggles in U.S. equities and suggest that international markets may be benefiting from different macroeconomic dynamics and policy expectations.
Three Key Market Trends Emerging in 2025
1) Mega-Cap Technology Stocks Lagging
In contrast to their leadership in 2024, mega-cap technology stocks have underperformed broader markets in 2025. The "Magnificent 7" stocks—Apple, Amazon, Google, Meta, Microsoft, Nvidia, and Tesla—drove over 50% of the S&P 500’s returns last year, but only two of them have outperformed the index this year. This shift reflects stretched valuations, trade uncertainties, and a more balanced earnings outlook across sectors.


2) Stabilization of Treasury Yields
After surging to nearly 4.8% in early January, the U.S. 10-year Treasury yield has stabilized around 4.5%. The recent moderation has been driven by contained inflation data, expectations of potential Fed rate cuts, and concerns over slowing economic growth. Retail sales weakness, cautious corporate guidance, and growing layoffs could prompt policymakers to reconsider their stance later in the year.

3) Global Markets & European Equities Outperforming
European stock markets have outpaced U.S. markets in early 2025, with the Euro Stoxx 50 rising approximately 13% year-to-date. This performance has been driven by a weaker U.S. dollar, improving economic data in the Eurozone, and hopes of geopolitical stability in the region. However, sustainability remains uncertain, and investors are watching developments closely.

Investor Sentiment and Market Outlook
Despite recent market turbulence, the broader trend has been one of resilience. The S&P 500 remains up approximately 4% for the year, and the MSCI World Index has gained around 5%. Diversification remains a critical theme for investors in 2025, with opportunities emerging in mid-cap stocks, fixed income, and international equities. However, potential risks from inflation, tariffs, and economic slowdowns warrant careful portfolio positioning.

The upcoming weeks will be pivotal, with major data releases—including the January Personal Consumption Expenditures (PCE) Price Index and earnings from Nvidia—set to influence market direction. While the Federal Reserve appears committed to holding rates steady for now, shifts in inflation expectations or economic growth could alter the policy outlook in the months ahead.
Conclusion
The past week has underscored the complexity of navigating financial markets in 2025. While the equity markets have faced short-term headwinds, underlying trends suggest a broadening of market leadership beyond mega-cap technology, a potential stabilization in interest rates, and renewed strength in international equities. As investors digest economic data, corporate earnings, and policy signals, maintaining a diversified and balanced approach remains the best strategy for weathering market fluctuations in the months to come.
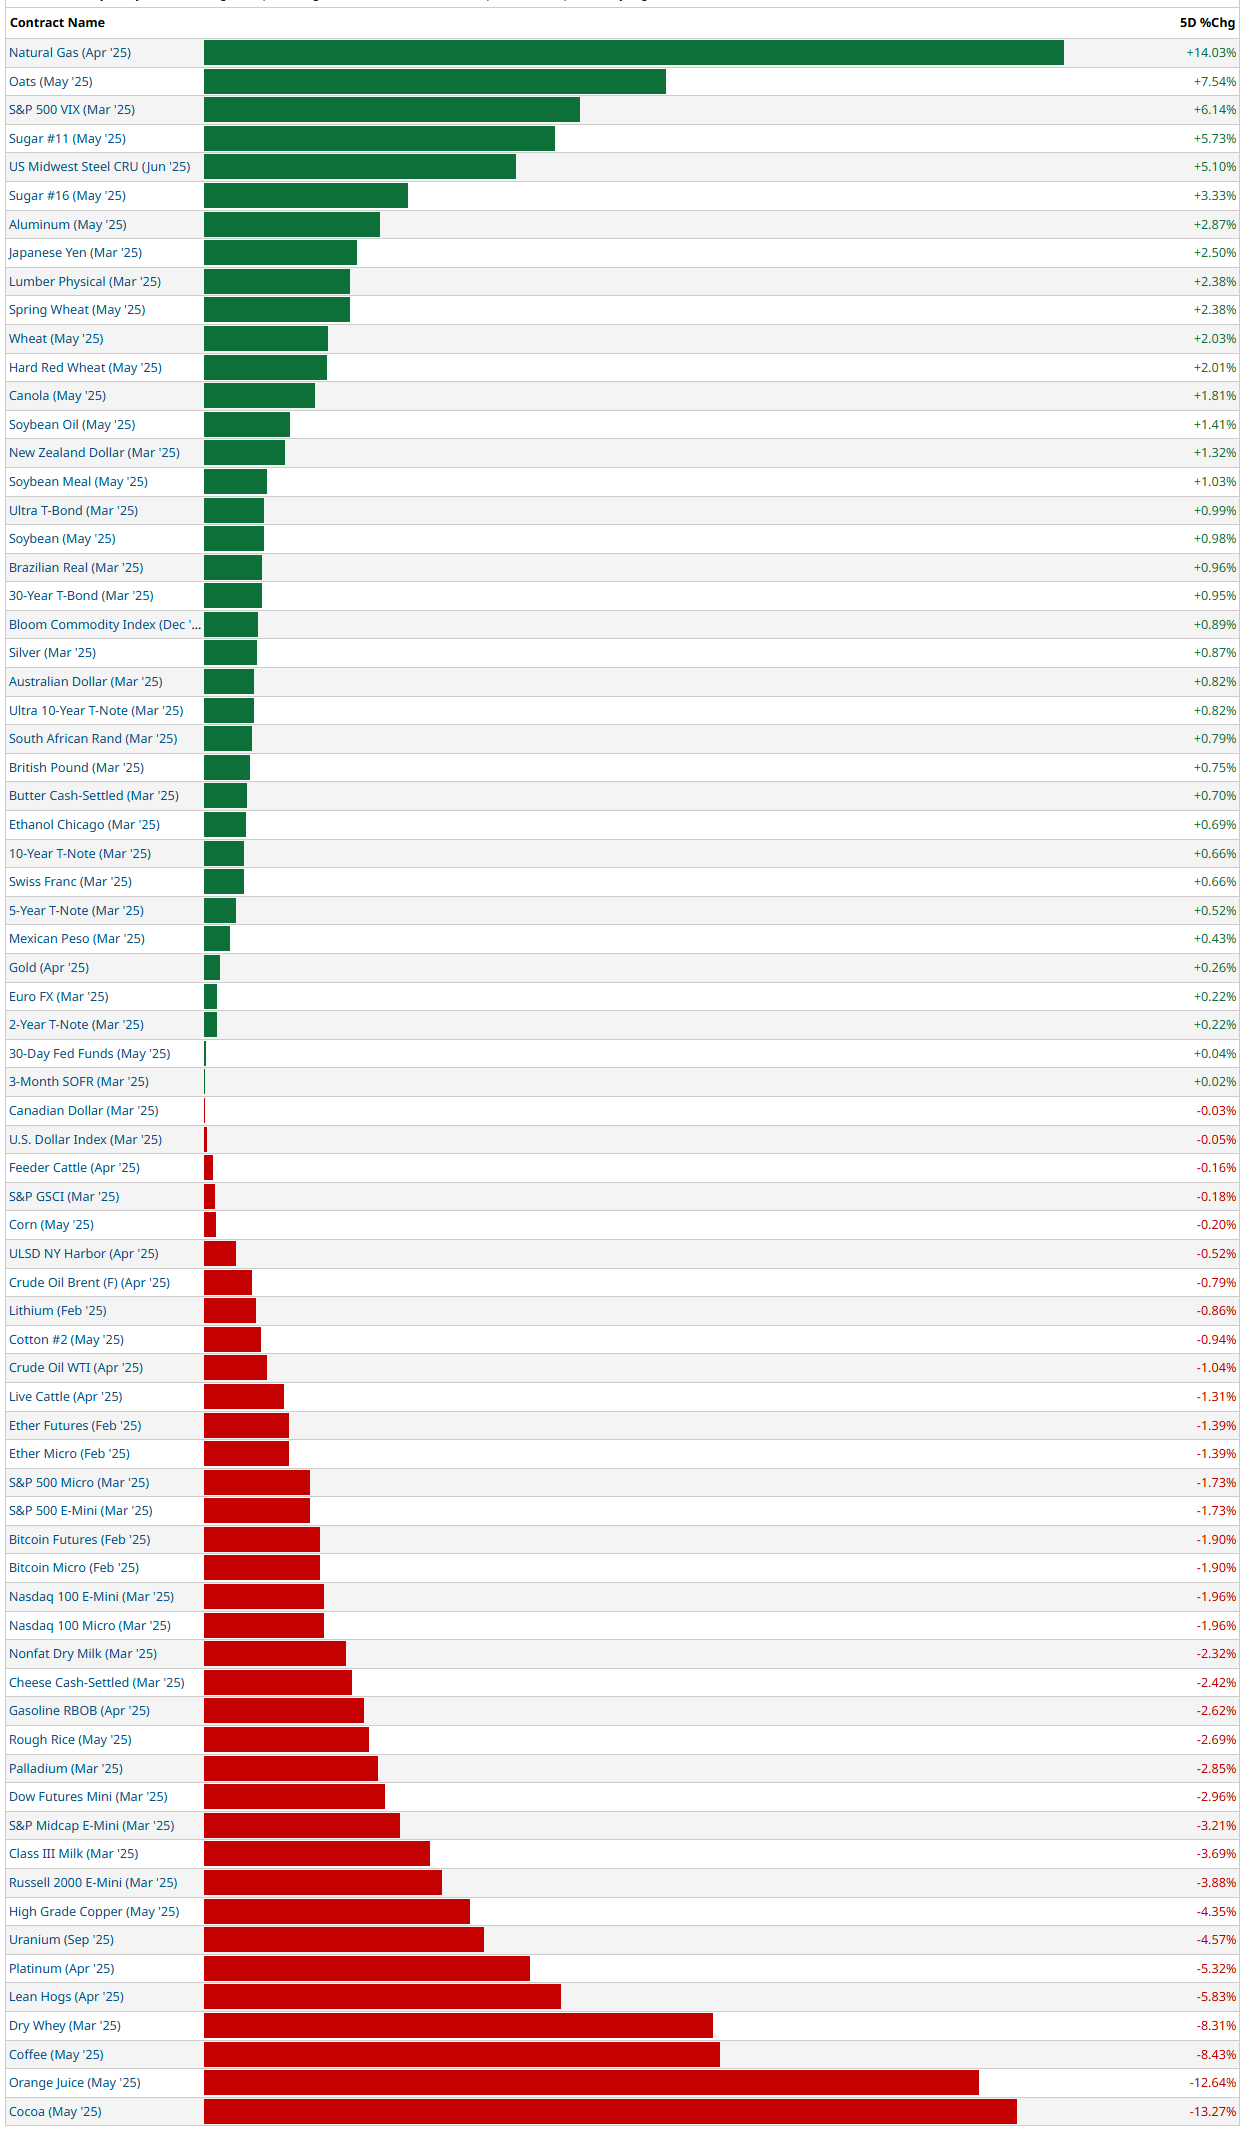
5-Day Futures Performance Leaders
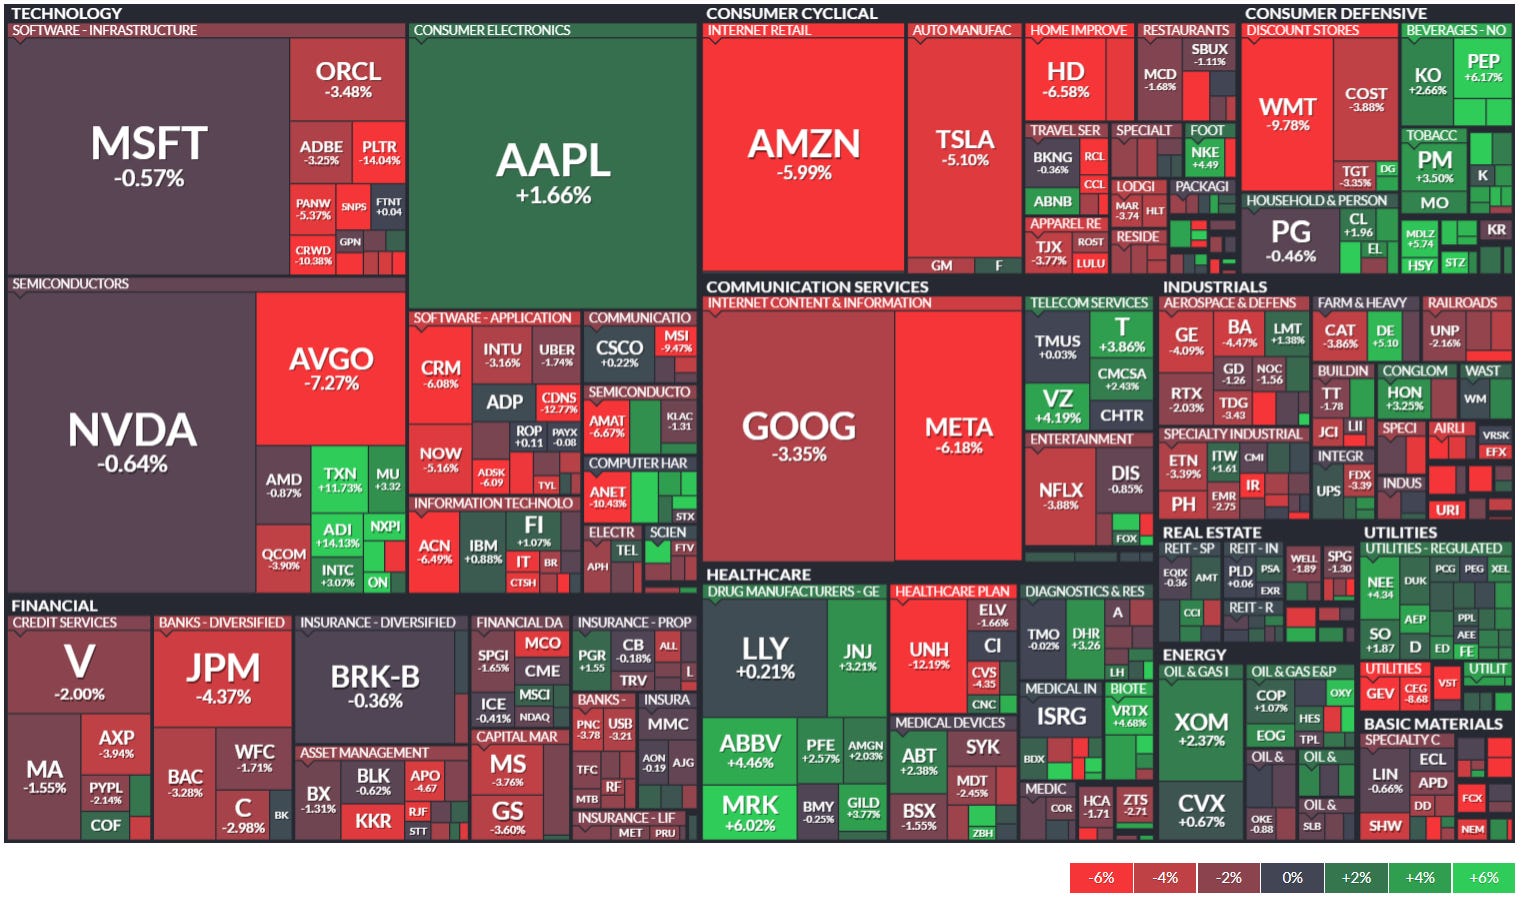
S&P 500 Sector Insights
Sector Overview With Individual Names By Market Cap
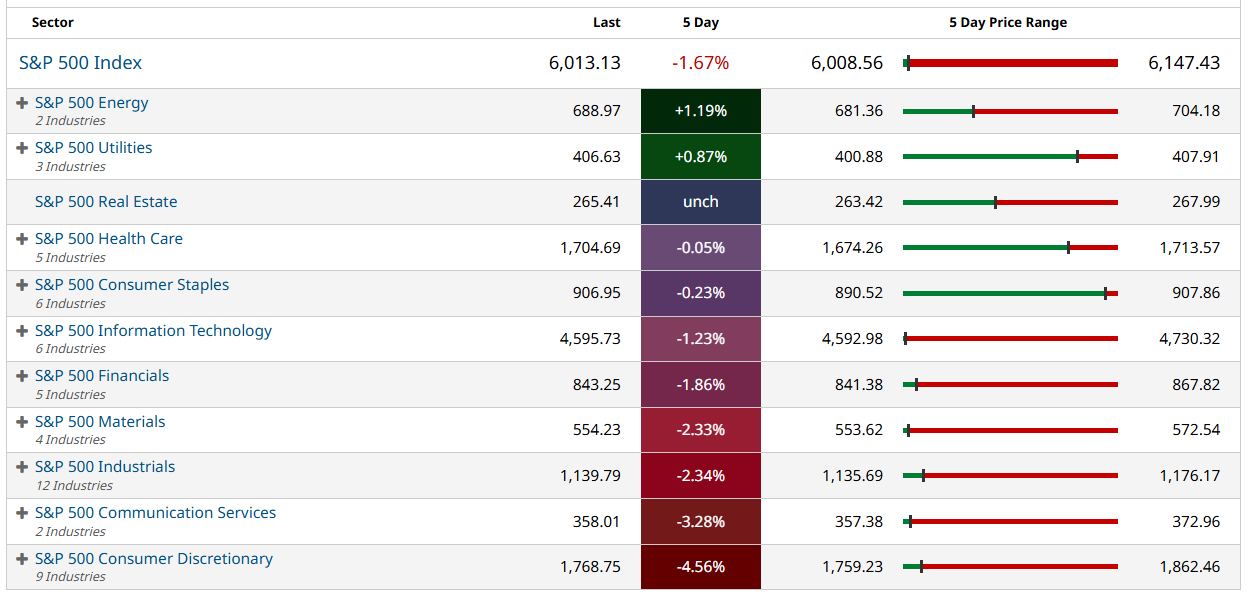
5-Day Sector Leaderboard
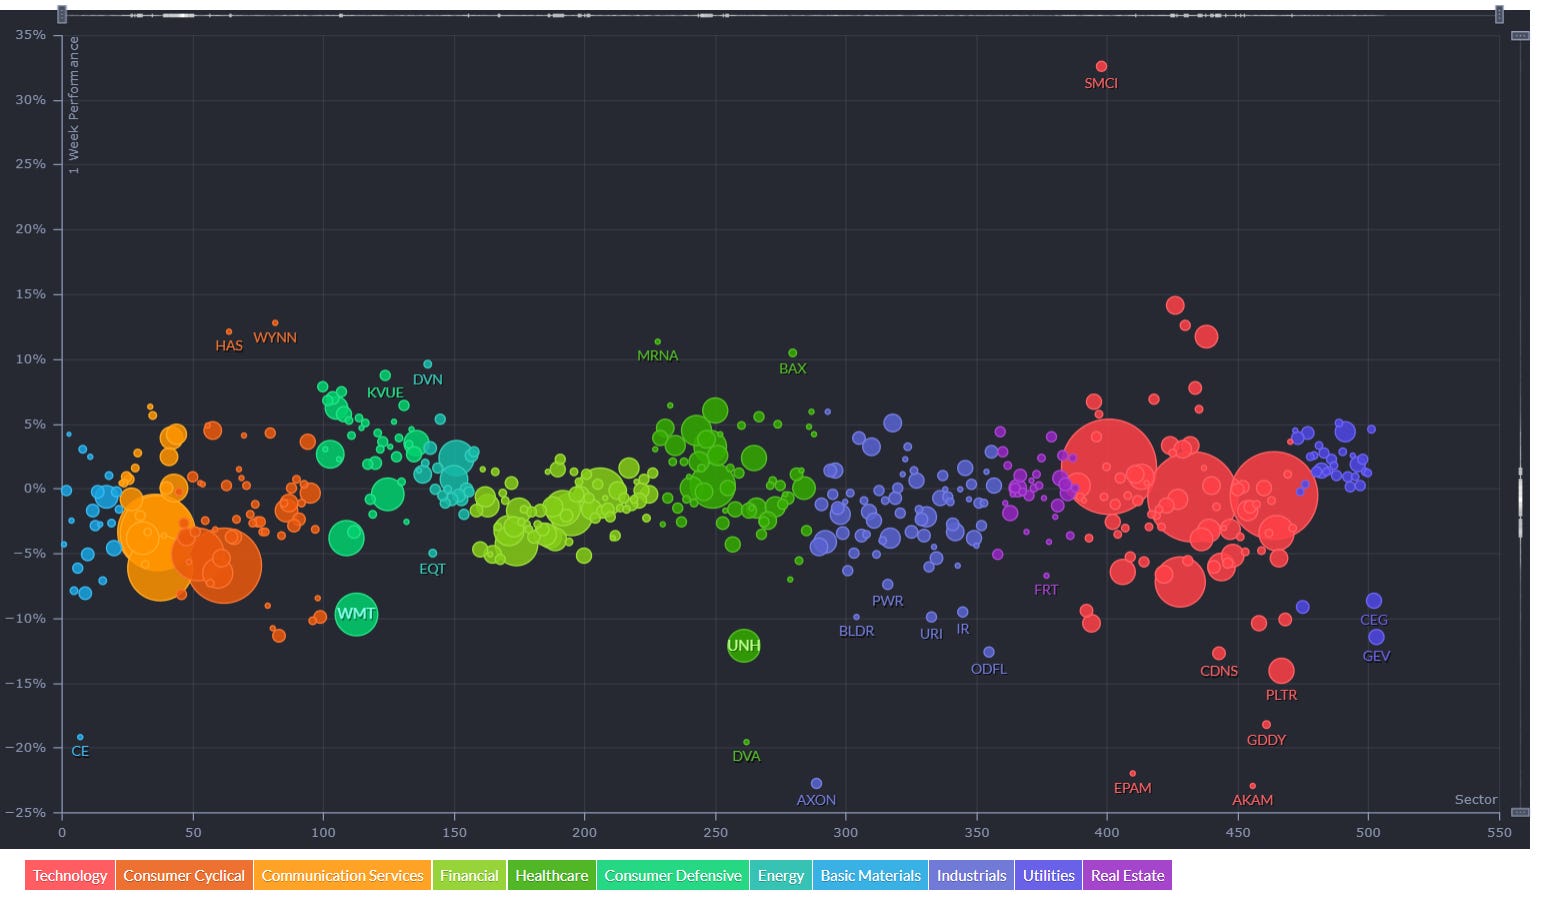
5-Day Individual Performance Grouped By Sector (Size By Market Cap)
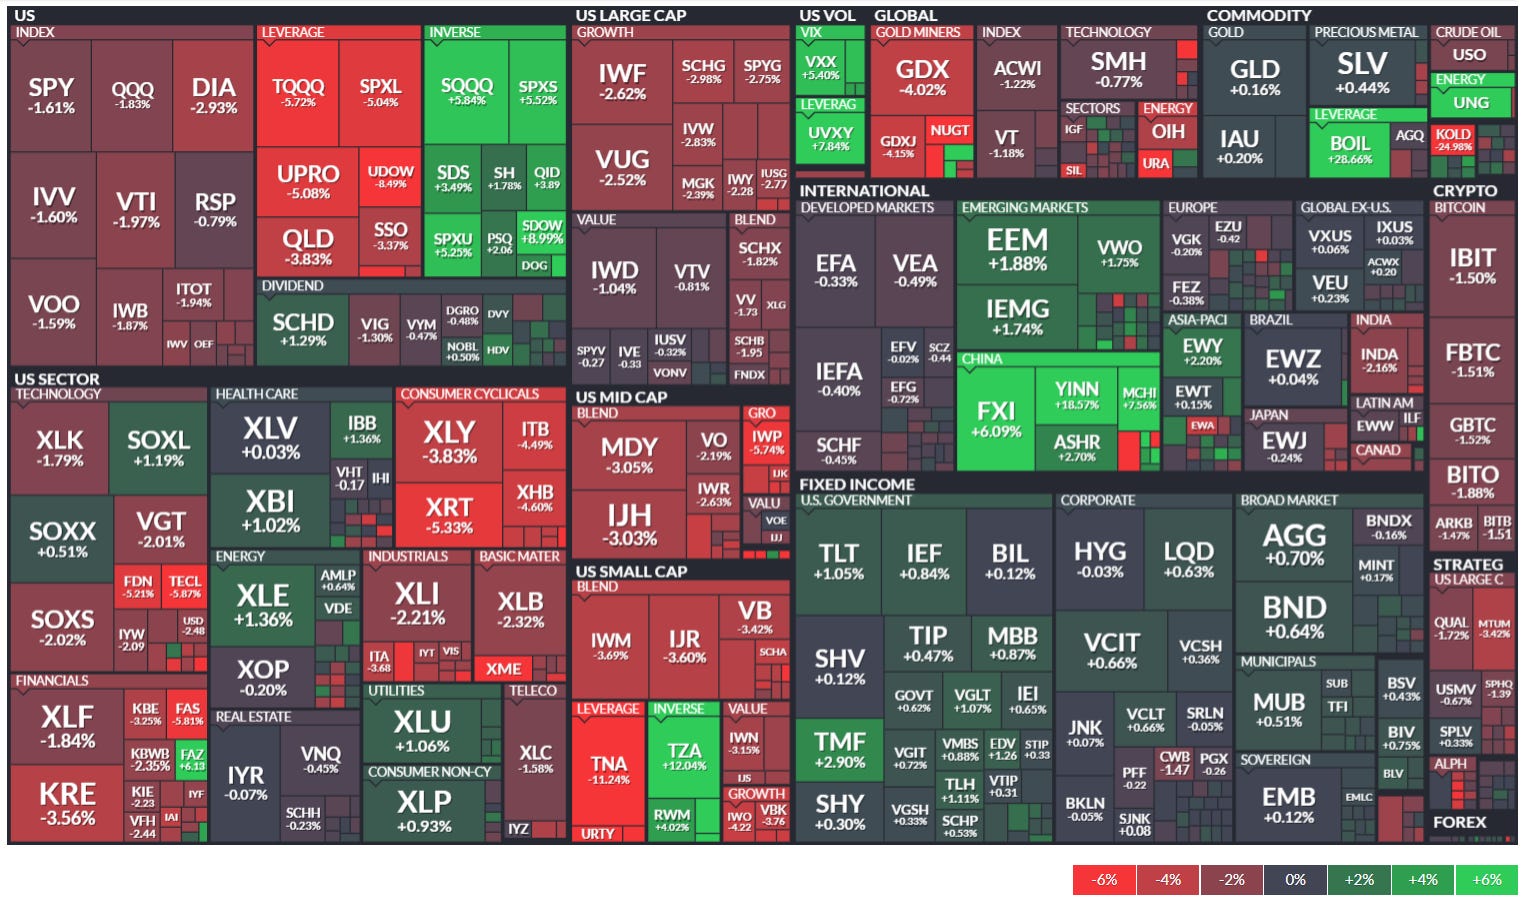
ETF Insights
Reviewing a heatmap like this weekly can be incredibly helpful for investors as it provides a quick and visual summary of market performance across various sectors, asset classes, and geographies.
1. Sector and Asset Class Trends
Identify Strong and Weak Sectors: Investors can quickly spot which sectors (e.g., technology, energy, healthcare) are performing well or underperforming.
Asset Class Diversification: Seeing how commodities, fixed income, equities, and cryptocurrencies performed helps assess diversification.
2. Market Sentiment
Risk-On or Risk-Off: A green-dominated map suggests bullish sentiment, while red indicates bearish sentiment. Investors can align their strategies accordingly.
Volatility Indicators: Observing movements in volatility indices (e.g., VIX) can highlight changing market dynamics.
3. Regional Analysis
Global Insights: Performance in developed and emerging markets (e.g., Europe, China, Asia-Pacific) helps in gauging international investment opportunities or risks.
Currency Impacts: Movements in forex or country-specific ETFs can indicate currency-driven market trends.
4. Thematic Trends
Growth vs. Value: Comparing the performance of growth ETFs (e.g., VUG) versus value ETFs (e.g., VTV) reveals the prevailing market preference.
Industry Leadership: Highlighting leadership within industries (e.g., gold miners, semiconductors) can inform thematic plays.
5. Monitoring Investments
Portfolio Alignment: Investors can track how their existing investments or watchlist align with broader market trends.
Rotation Signals: Seeing week-over-week changes in sector dominance may signal sector rotation opportunities.
6. Risk Management
Recognizing Overbought/Oversold Conditions: Consistent underperformance or overperformance in specific areas may indicate potential mean-reversion trades.
Correlation Awareness: By observing how different asset classes move, investors can manage portfolio correlation and risk.
7. Decision Support
Identify Outperformers/Underperformers: ETFs, sectors, or indices that repeatedly outperform or underperform can help refine trading or investment strategies.
Macro Perspective: Weekly trends highlight macroeconomic or geopolitical influences affecting markets.
Regularly reviewing a heatmap like this is a strategic practice that supports data-driven decision-making while fostering a holistic understanding of market dynamics.
Global Overview
Foreign ADR stocks listed on NYSE, NASDAQ & AMEX categorized by geographic location. Reviewing a global heatmap like this weekly is valuable for investors because it offers insights into international markets, helping to:
Identify Global Trends: Spot which regions or countries are performing well or underperforming.
Assess Sector and Regional Performance: Understand how industries are faring across different regions.
Diversify Portfolios: Uncover opportunities in emerging or developed markets for greater diversification.
Gauge Global Sentiment: Recognize the impact of macroeconomic events on specific regions.
Align with Global Strategies: Refine investment strategies based on regional strengths or weaknesses.
This overview ensures investors stay informed about global opportunities and risks, complementing their domestic market analysis.


US Investor Sentiment
Insider Trading
Insider trading occurs when a company’s leaders or major shareholders trade stock based on non-public information. Tracking these trades can reveal insider expectations about the company’s future. For example, large purchases before an earnings report or drug trial results might indicate confidence in upcoming good news.

%Bull-Bear Spread
The %Bull-Bear Spread chart is a sentiment indicator that shows the difference between the percentage of bullish and bearish investors, often derived from surveys or sentiment data, such as the AAII (American Association of Individual Investors) sentiment survey. This spread tells investors about the prevailing mood in the market and can provide insights into market extremes and potential turning points.
Bullish or Bearish Sentiment:
When the spread is positive, it means more investors are bullish than bearish, indicating optimism about the market’s direction.
A negative spread indicates more bearish sentiment, meaning more investors expect the market to decline.
Contrarian Indicator:
The %Bull-Bear Spread is often used as a contrarian indicator. For example, extremely high levels of bullish sentiment might suggest that the market is overly optimistic and could be due for a correction.
Similarly, when bearish sentiment is extremely high, it might indicate that the market is overly pessimistic, and a rally could be on the horizon.
Market Extremes and Reversals:
Historically, extreme values of the spread (both positive and negative) can signal turning points in the market. A very high positive spread can signal market exuberance, while a very low or negative spread may indicate fear or capitulation.
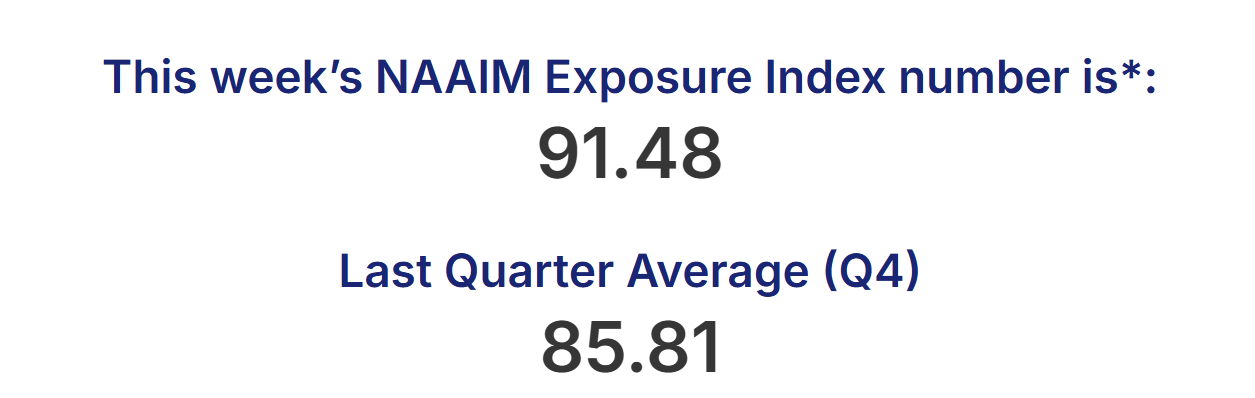
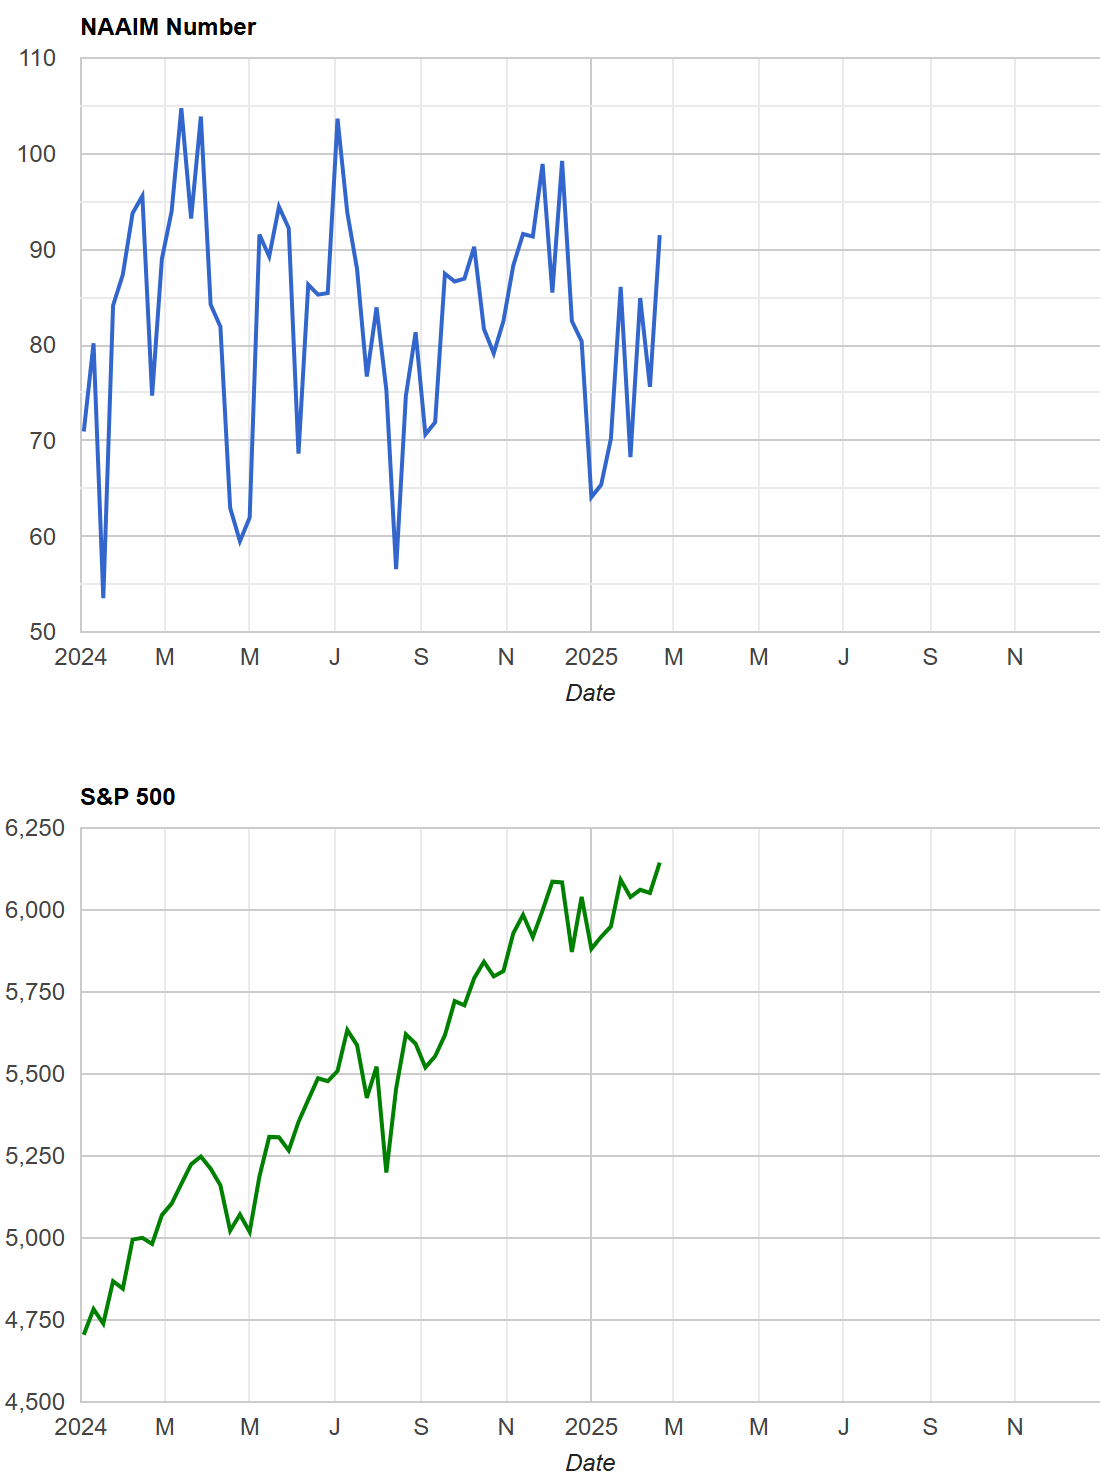
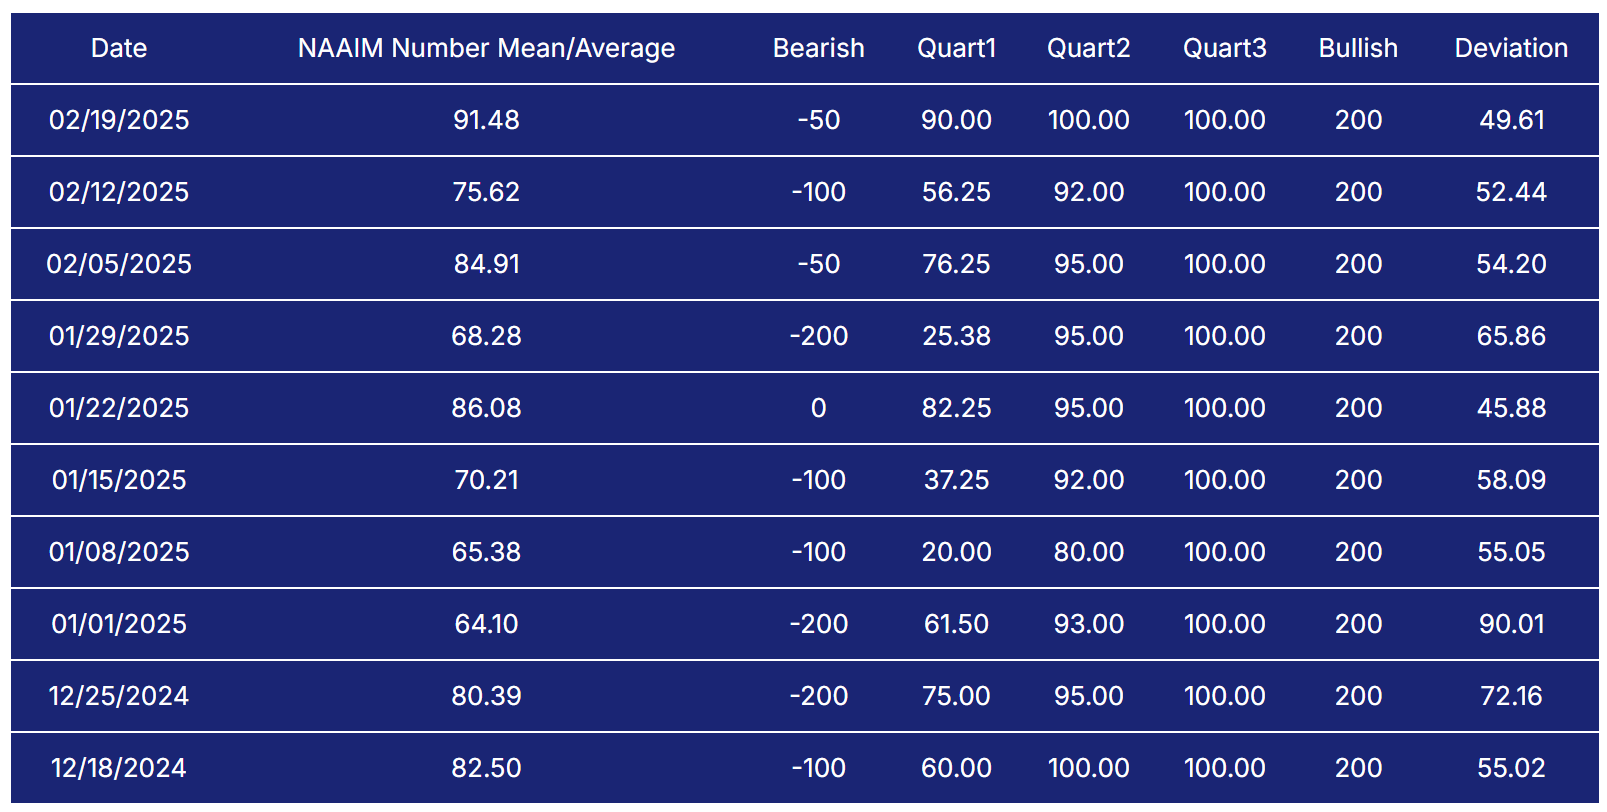
NAAIM Exposure Index
The NAAIM Exposure Index (National Association of Active Investment Managers Exposure Index) measures the average exposure to U.S. equity markets as reported by its member firms. These are typically active money managers who provide their equity exposure levels weekly. The index offers insight into how much these managers are investing in equities at any given time, ranging from being fully short (-100%) to leveraged long (up to +200%).
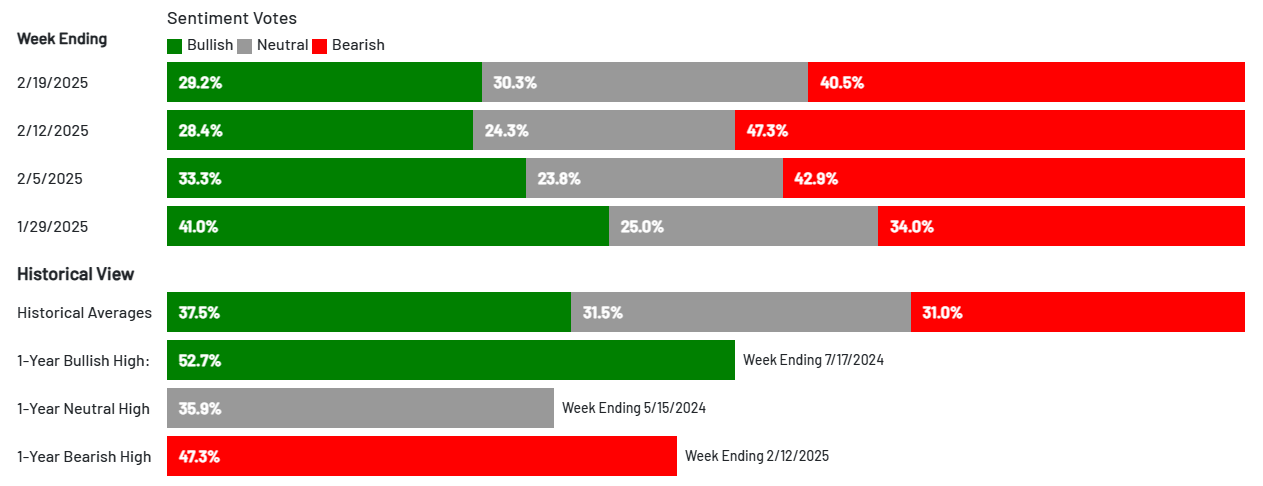
AAII Investor Sentiment Survey
The AAII Investor Sentiment Survey is a weekly survey conducted by the American Association of Individual Investors (AAII) to gauge the mood of individual investors regarding the direction of the stock market over the next six months. It provides insights into whether investors are feeling bullish (expecting the market to rise), bearish (expecting the market to fall), or neutral (expecting the market to stay about the same).
Key Points:
Bullish Sentiment: Reflects the percentage of investors who believe the stock market will rise in the next six months.
Bearish Sentiment: Represents those who expect a decline.
Neutral Sentiment: Reflects investors who anticipate little to no market movement.
The survey is widely followed as a contrarian indicator, meaning that extreme levels of bullishness or bearishness can sometimes signal market turning points. For example, when a large number of investors are overly optimistic (high bullish sentiment), it could suggest a market top, while excessive pessimism (high bearish sentiment) may indicate a market bottom is near.
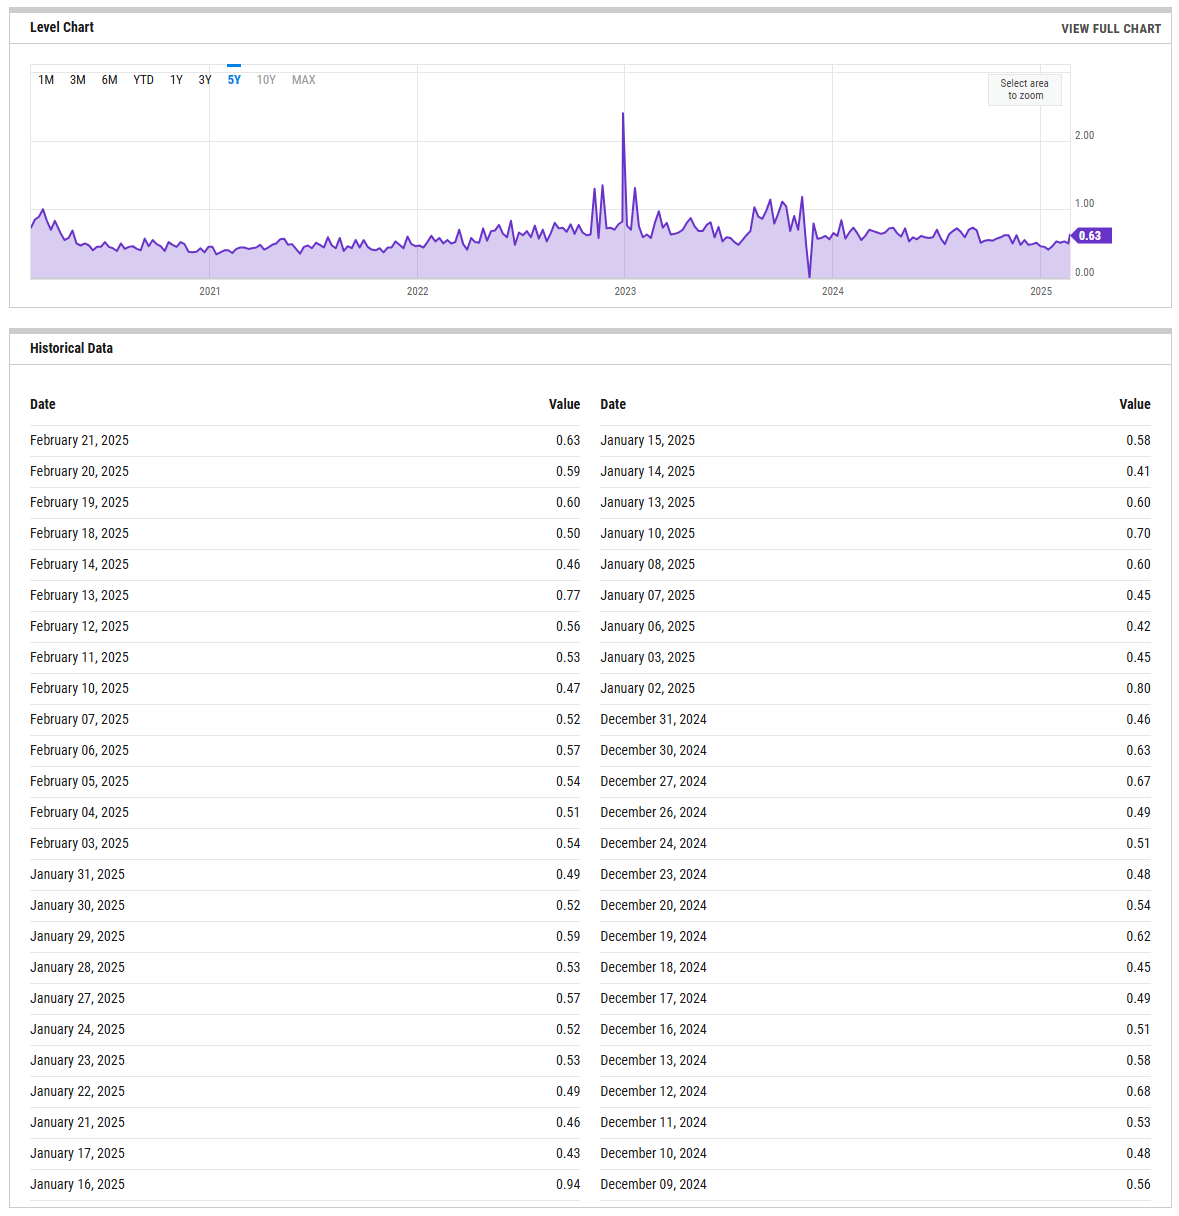
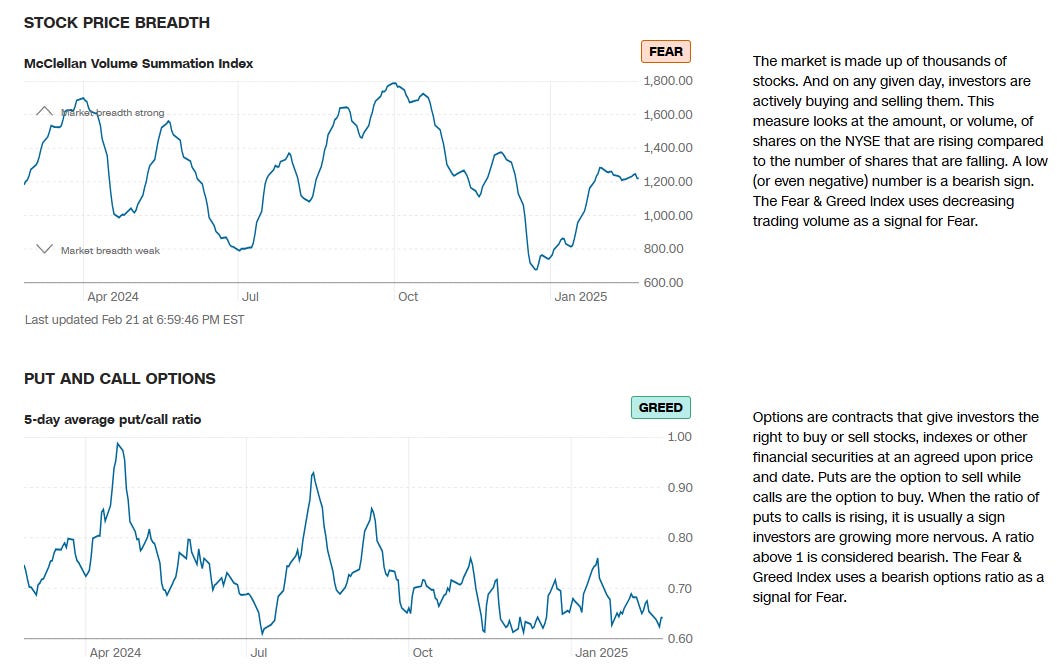
SPX Put/Call Ratio
The SPX Put/Call Ratio is an indicator that is used to gauge market sentiment. This is calculated as the ratio between trading S&P 500 put options and S&P call options. A high put/call ratio can indicate fear in the markets, while a low ratio indicates confidence. For example, in 2015, the Put-Call ratio was as high as 3.77 because of market fears stemming from various global economic issues like a GDP growth slowdown in China and a Greek debt default.
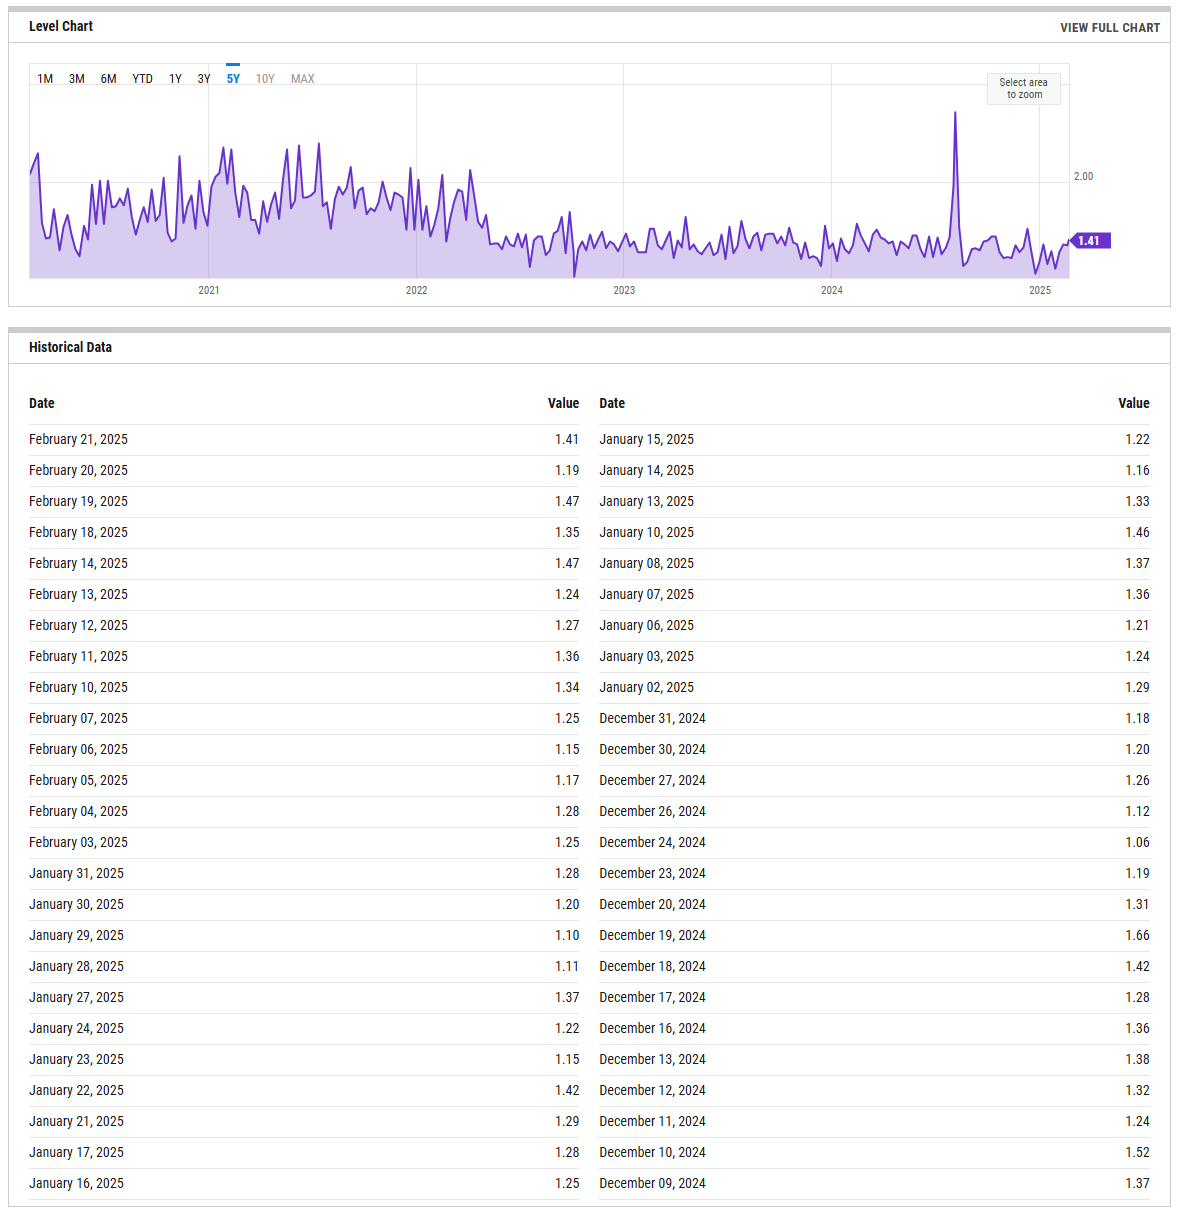
CBOE Equity Put/Call Ratio
The CBOE (Chicago Board Options Exchange) equity put/call ratio is a sentiment indicator used by traders and analysts to gauge market sentiment and potential shifts in investor behavior. It is calculated by dividing the volume of put options by the volume of call options on equities. Here’s what it reveals and how it is generally interpreted:
High Put/Call Ratio: When the put/call ratio is high (above 1.0), it suggests that there is more demand for put options than call options. This typically reflects a more bearish sentiment, as investors may be hedging against potential declines or expecting the market to fall.
Low Put/Call Ratio: Conversely, a low put/call ratio (below 0.7) indicates a higher volume of call options compared to puts, reflecting bullish sentiment. Investors may be expecting upward momentum and are positioning themselves to profit from price gains
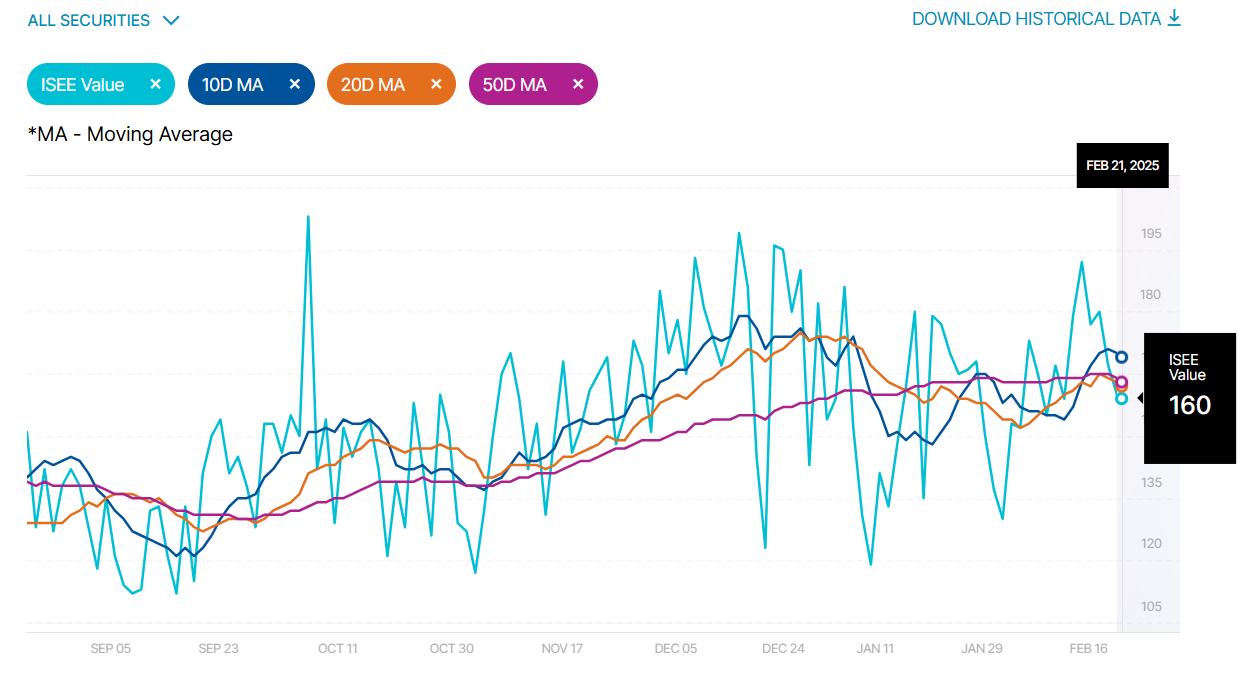
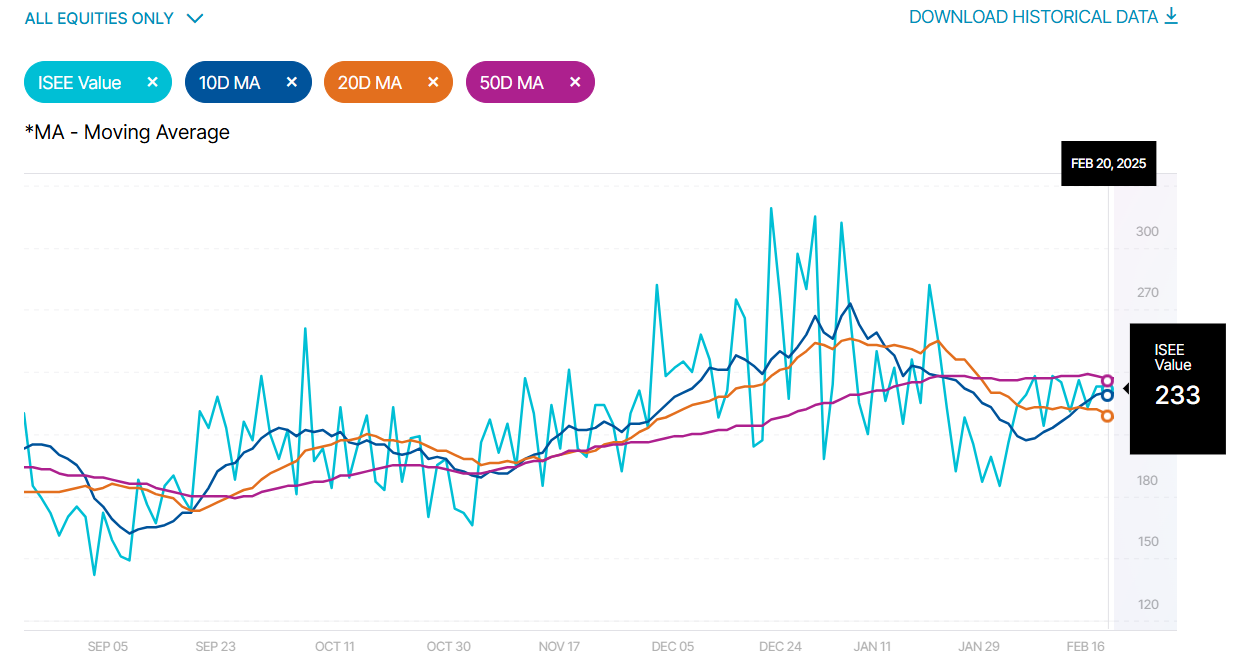
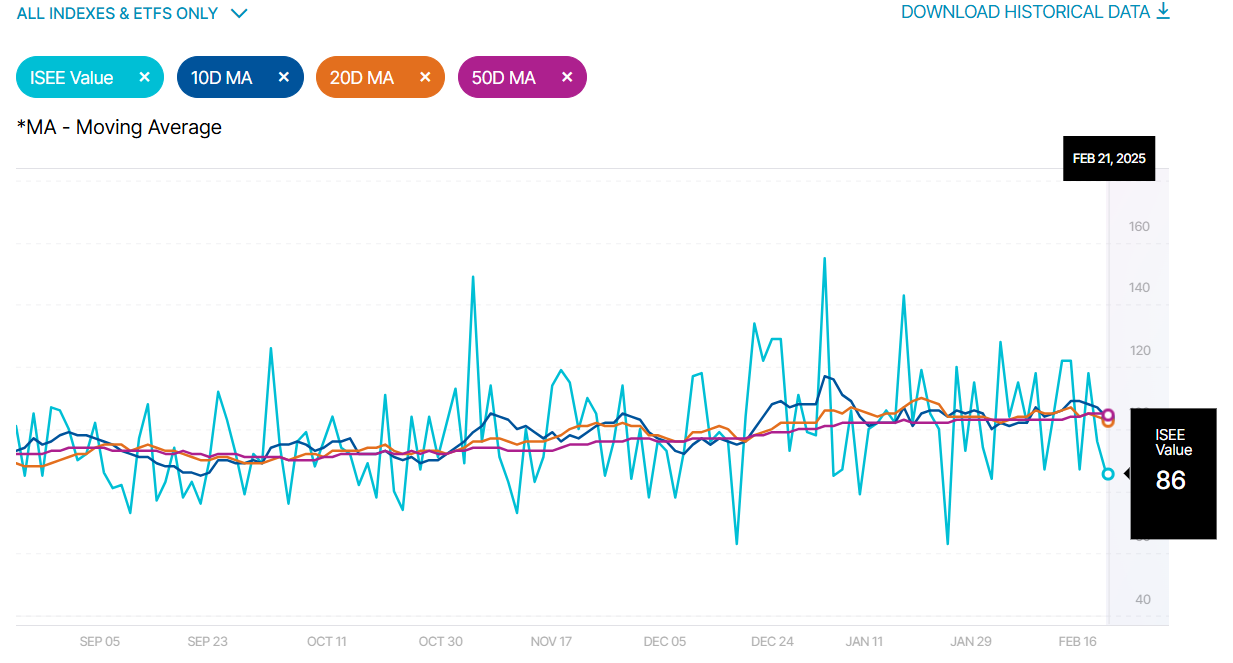
ISEE Sentiment Index
The ISEE (International Securities Exchange Sentiment) Index is a measure of investor sentiment derived from options trading. Unlike traditional put/call ratios, the ISEE Index focuses only on opening long customer transactions and is adjusted to remove market-maker and firm trades, providing a purer sentiment reading.
The ISEE Index typically ranges from 0 to 200, with readings above 100 indicating more call options being bought relative to put options, suggesting bullish sentiment. Conversely, readings below 100 suggest bearish sentiment, with more puts being purchased relative to calls.
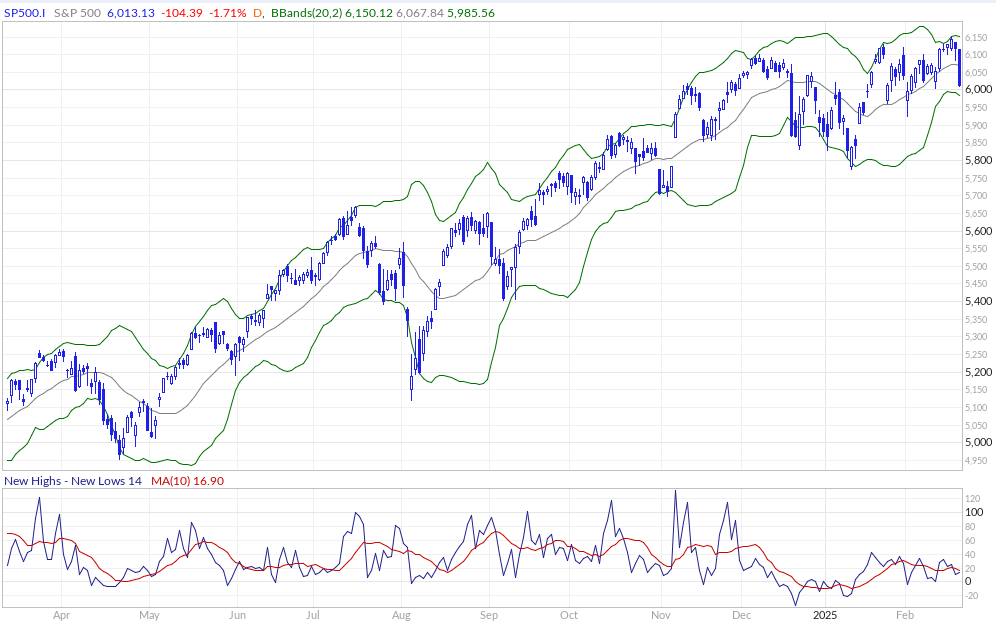
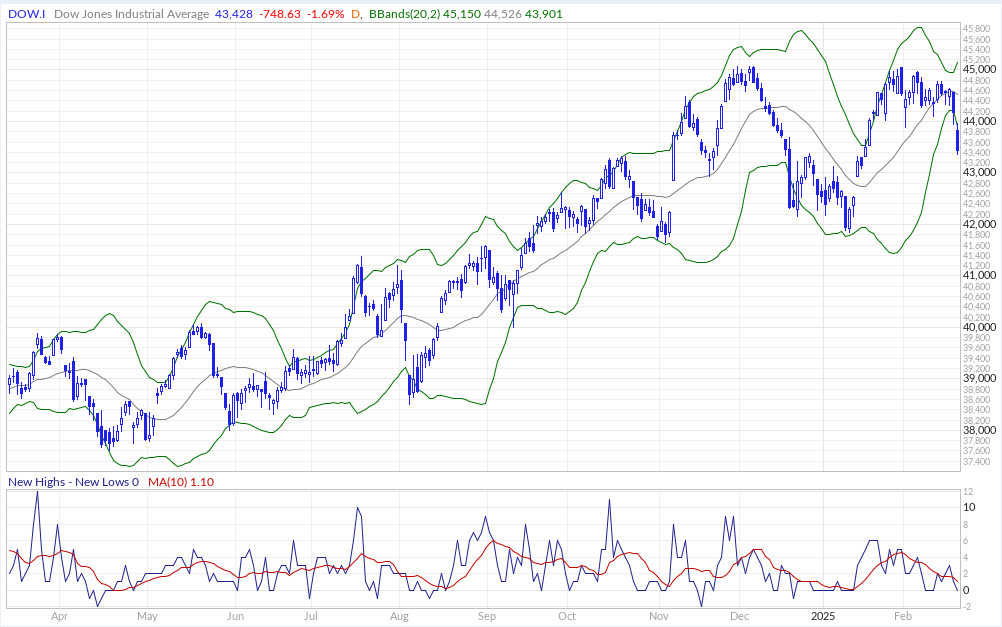
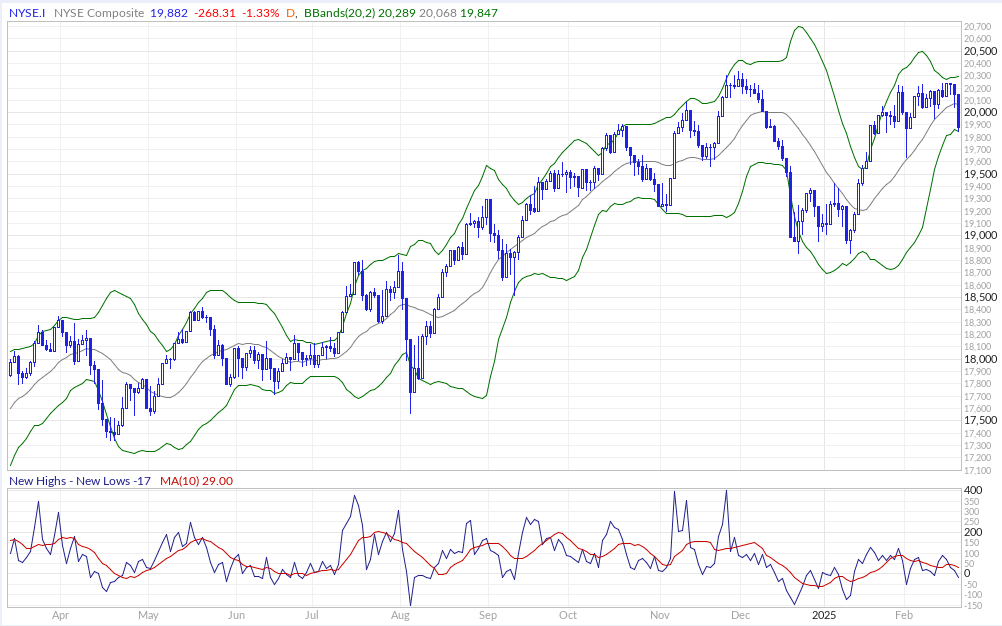
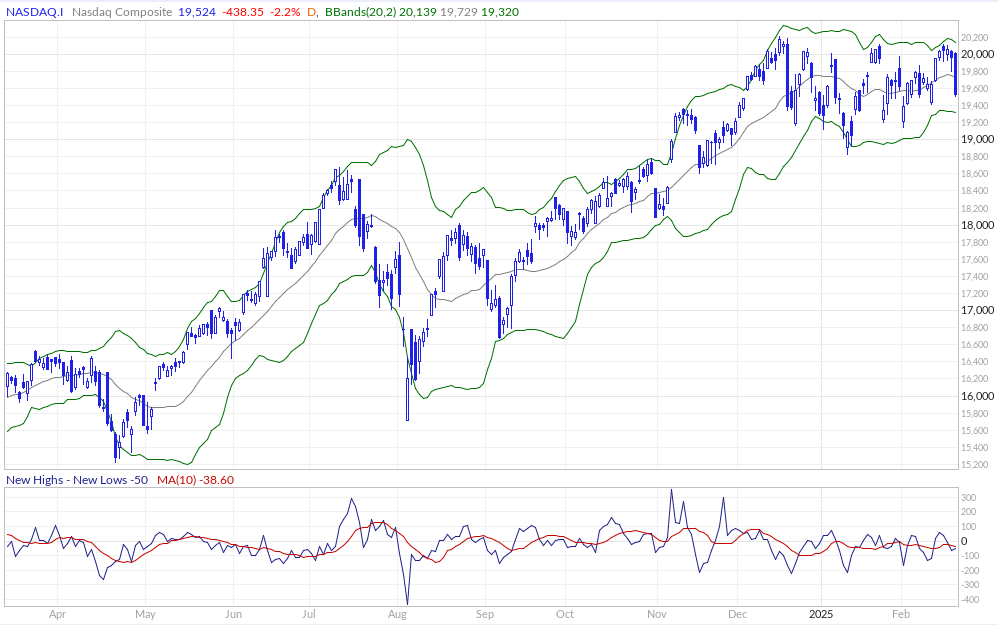
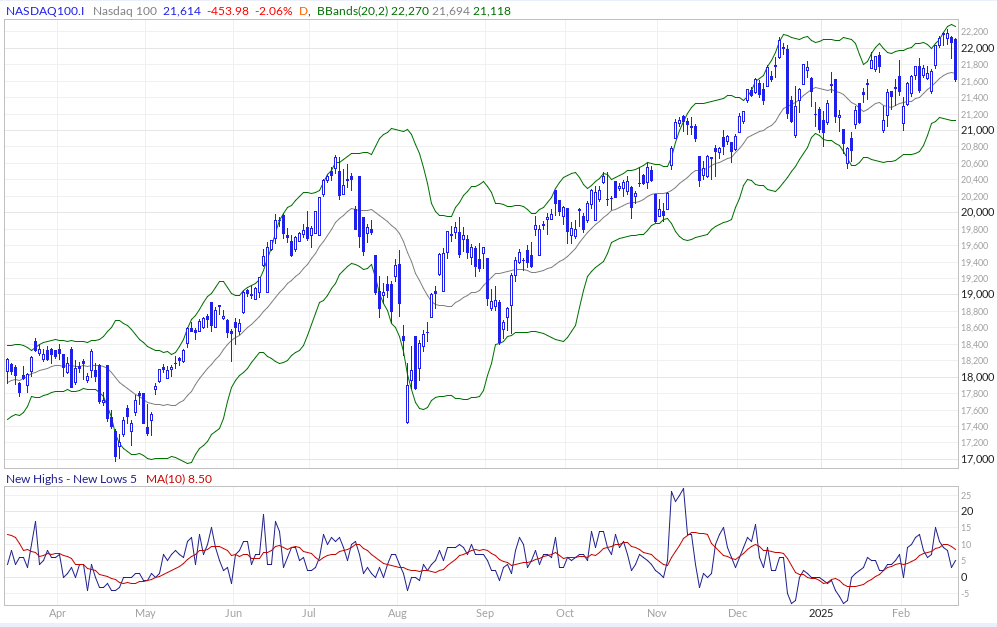
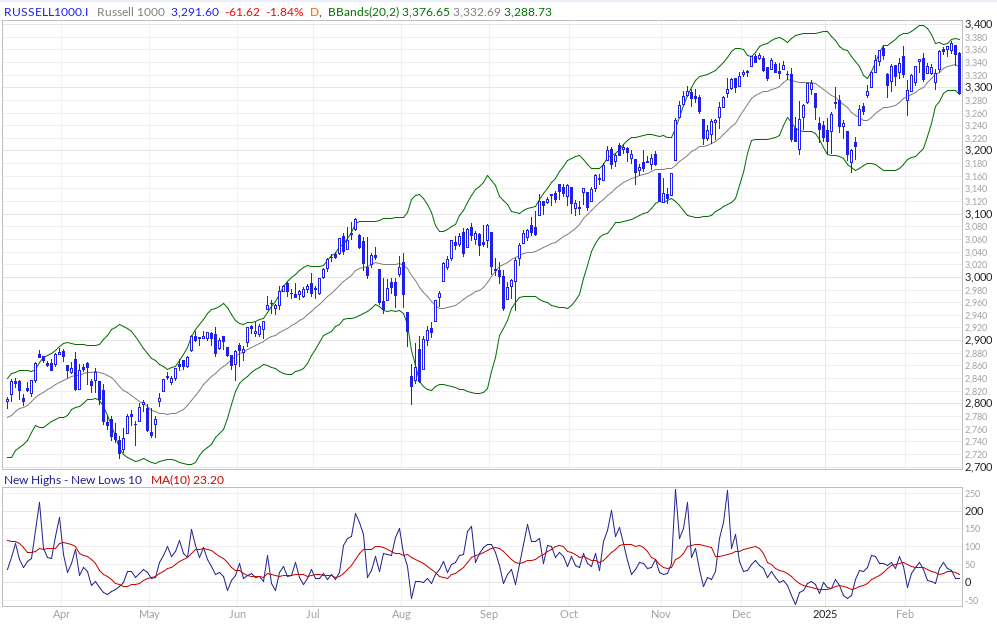
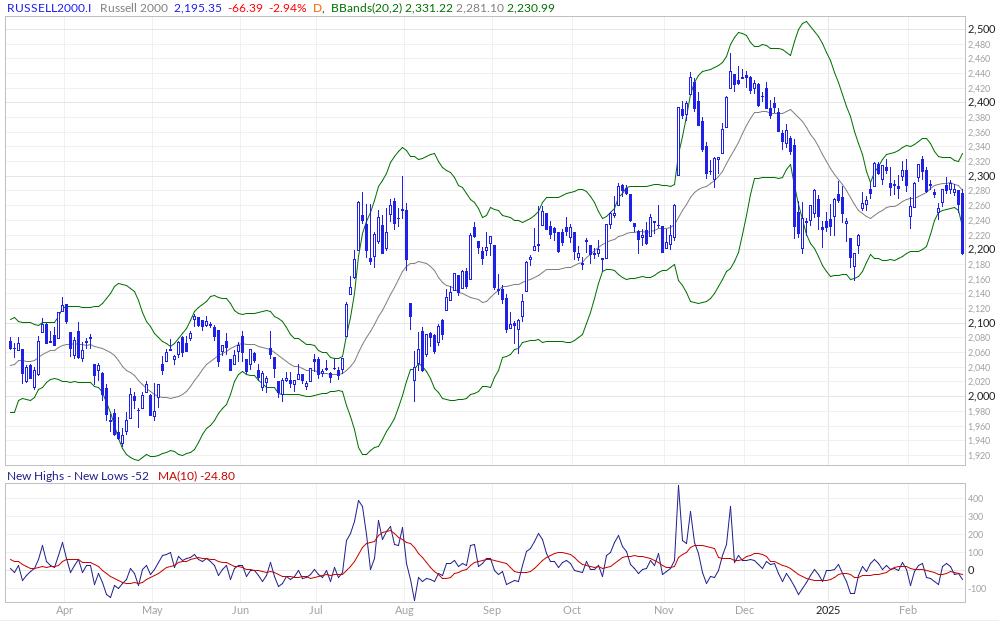
New Highs - New Lows
The New Highs - New Lows indicator (NH-NL) displays the daily difference between the number of stocks reaching new 52-week highs and the number of stocks reaching new 52-week lows. The NH-NL indicator generally reaches its extreme lows slightly before a major market bottom. As the market then turns up from the major bottom, the indicator jumps up rapidly. During this period, many new stocks are making new highs because it's easy to make a new high when prices have been depressed for a long time. The NH-NL indicator oscillates around zero. If the indicator is positive, the bulls are in control. If it is negative, the bears are in control. As the cycle matures, a divergence often occurs as fewer and fewer stocks are making new highs (the indicator falls), yet the market indices continue to reach new highs. This is a classic bearish divergence that indicates that the current upward trend is weak and may reverse.
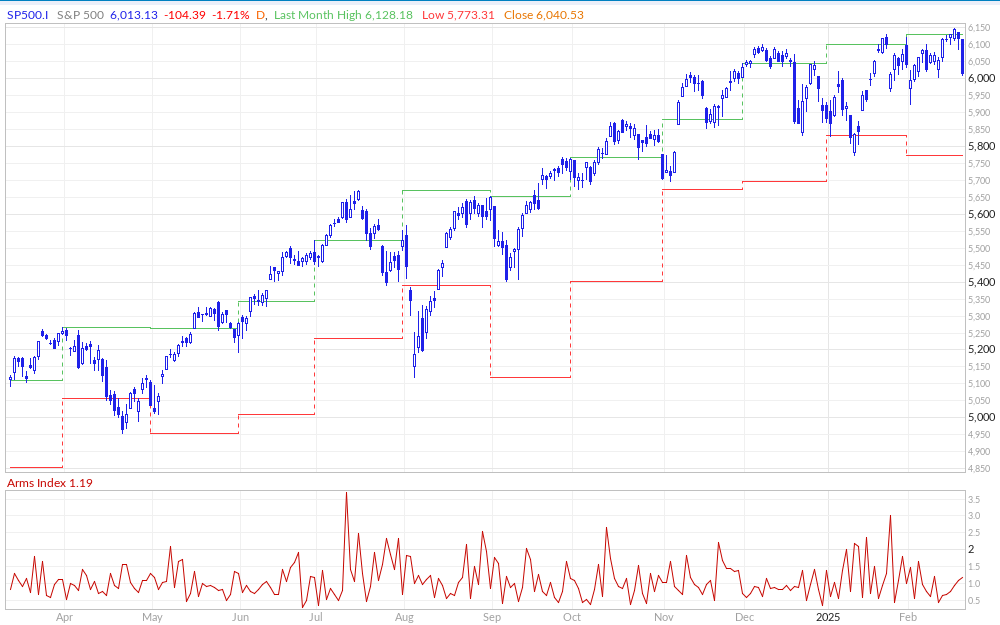
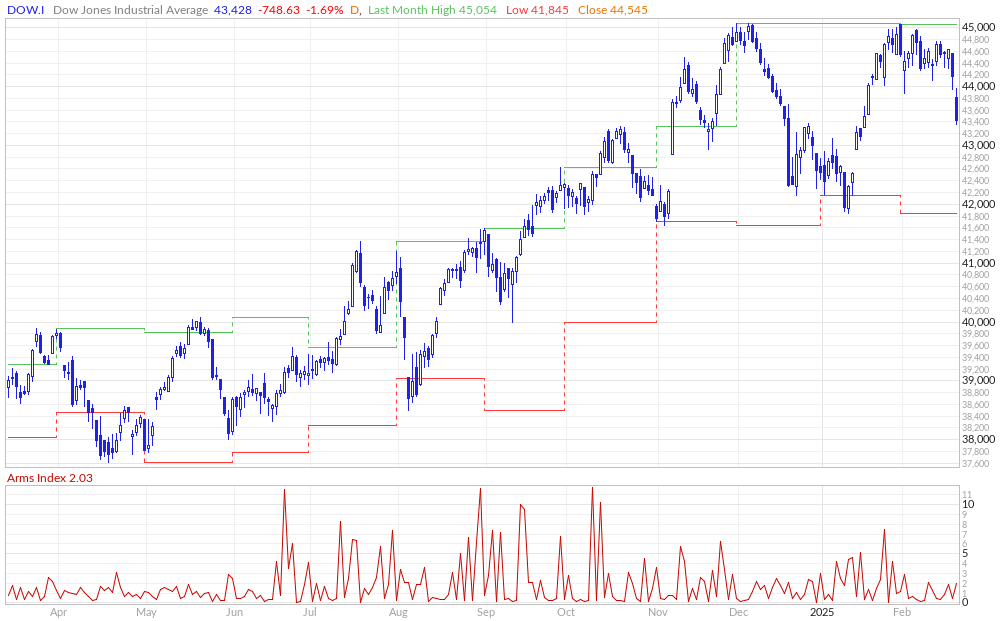
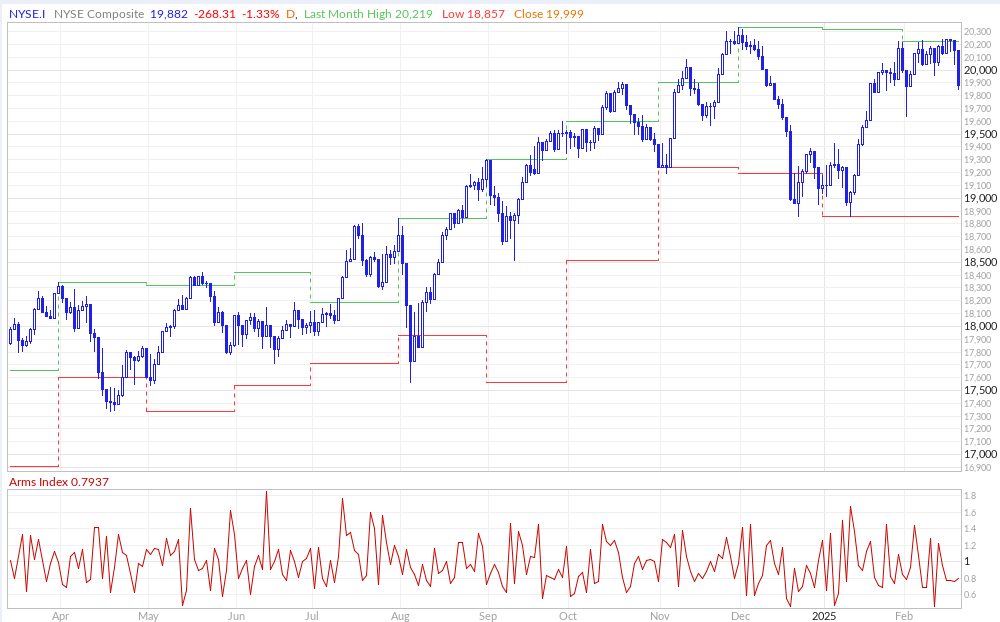
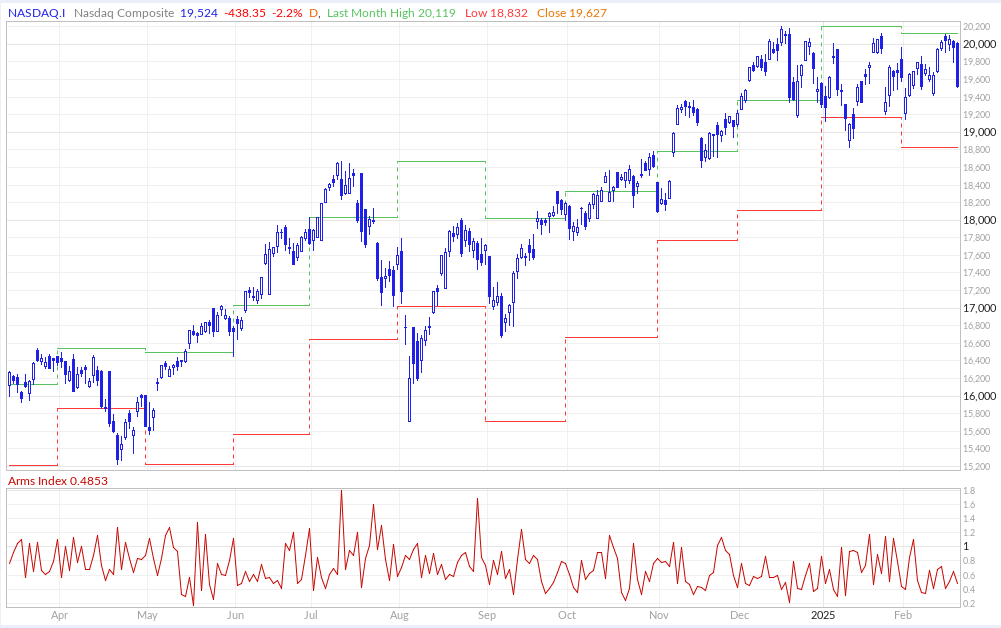
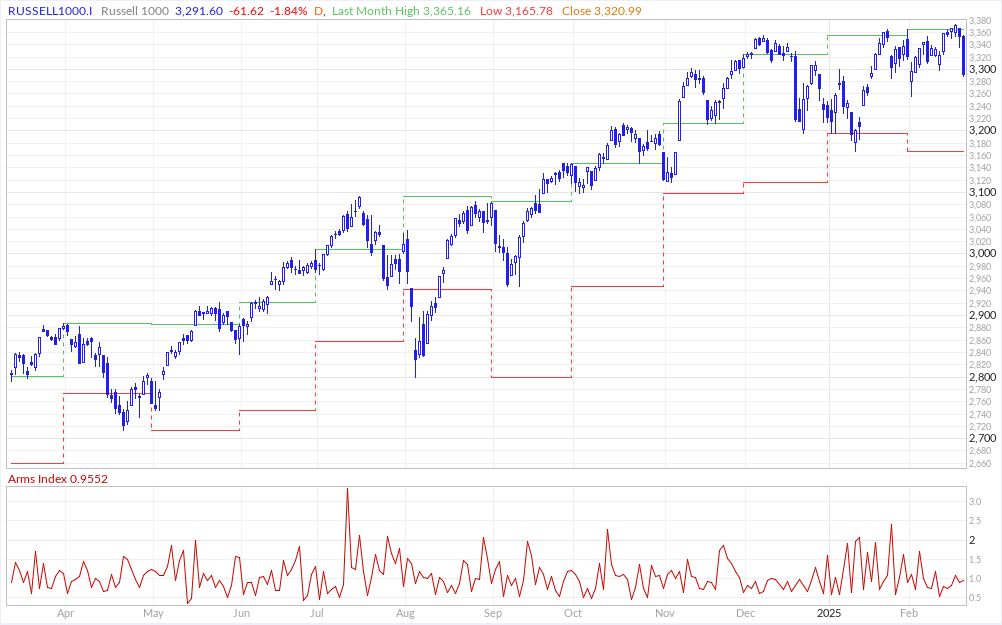
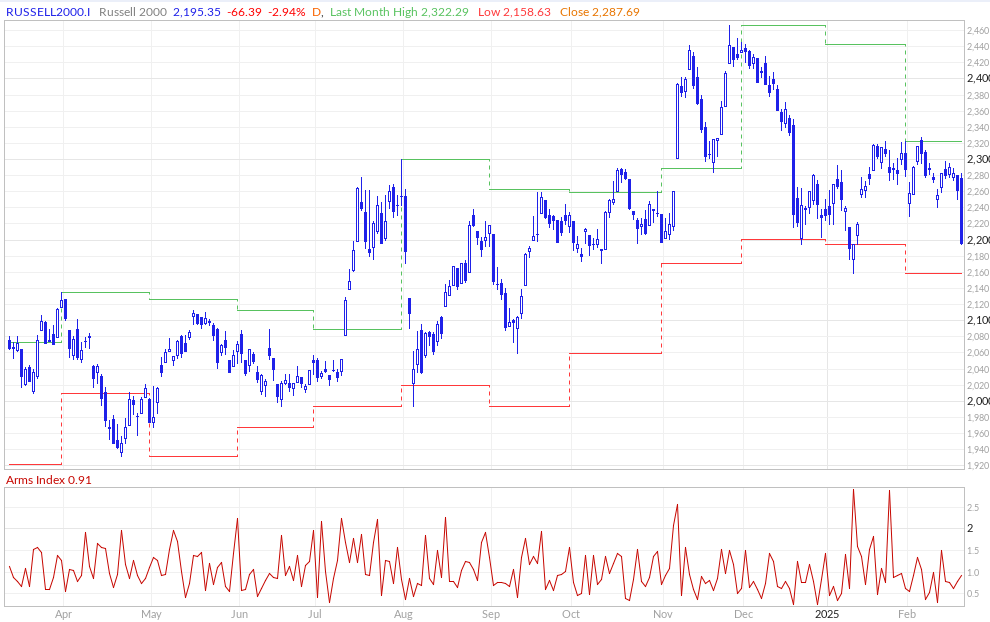
ARMS Index
The Arms Index, also known as the TRIN (Short-Term TRading INdex), was developed by Richard Arms in the 1960s. It is calculated by dividing the ratio of advancing stocks to declining stocks by the ratio of advancing volume to declining volume. Interpreting the Arms Index involves looking at its value in relation to certain thresholds. A value below "1" is considered bullish, indicating that advancing stocks and volume dominate the market. Conversely, a value above "1" is considered bearish, suggesting that declining stocks and volume are more prevalent. Extremely low values (below 0.5) or high values (above 2) are often seen as potential reversal signals.

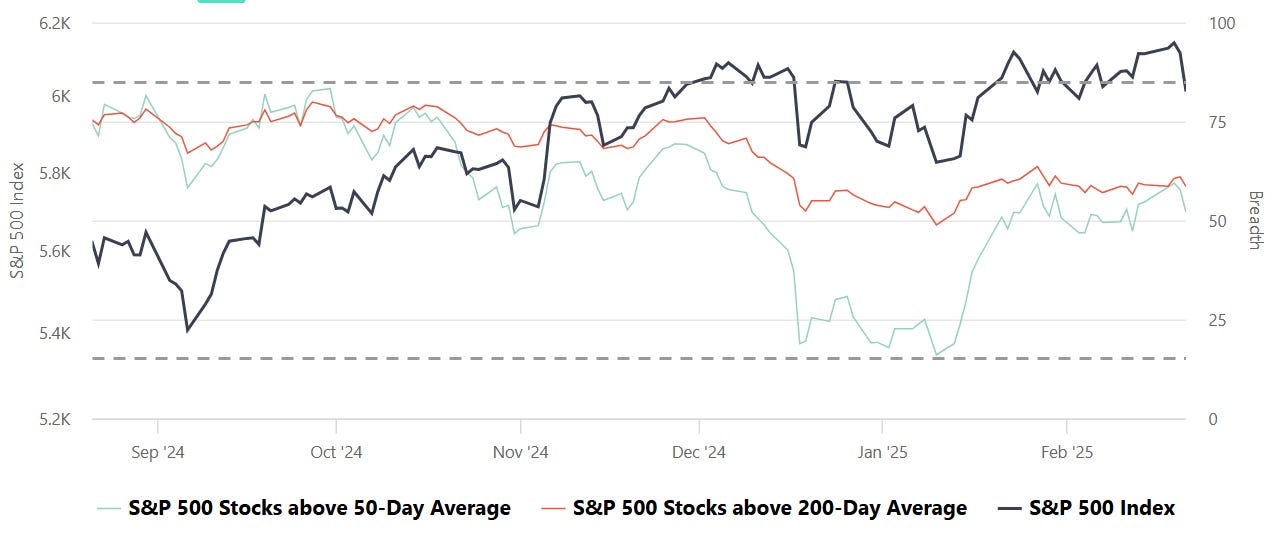
S&P Breadth
Breadth, in the context of stock market analysis, refers to the measure of how many stocks in a given index (such as the S&P 500) are participating in a trend, such as advancing or declining relative to a certain moving average (e.g., 50-day or 200-day).
Market Strength Assessment:
Breadth provides insight into whether a market rally or decline is broad-based or driven by only a few large-cap stocks. A rally supported by a high percentage of stocks above their 50-day or 200-day averages is generally considered healthier and more sustainable.
Early Warning Signals:
Divergences between breadth indicators and the index price can signal potential reversals. For example:
If the index is rising, but the number of stocks above their moving averages is declining, it may indicate weakening underlying strength and potential for a pullback.
Conversely, if breadth improves while the index remains flat or declines, it may suggest accumulating strength for a future rally.
Trend Confirmation:
Breadth indicators can confirm trends. For instance, a strong majority of stocks above their moving averages signals robust market momentum, providing confidence in the prevailing trend.
Identifying Overbought or Oversold Conditions:
Extremely high or low breadth readings can signal overbought or oversold conditions, which might lead to mean reversion. For example:
If nearly all stocks are above their 50-day or 200-day averages, it may suggest overbought conditions.
Conversely, extremely low levels indicate oversold conditions and potential for a bounce.
Breadth and Timing Investments:
Entry Points:
When breadth improves (e.g., more stocks move above their 50-day or 200-day moving averages) after a market pullback, it can indicate a good time to start building positions as the broader market is regaining strength.
Exit Points:
Breadth deterioration during a rally may suggest it’s time to reduce exposure, especially if only a small number of stocks are driving index gains. This is often a warning sign of an impending correction.
Volatility and Risk Management:
Weak breadth in volatile markets may prompt caution or defensive positioning. Conversely, improving breadth can justify taking on more risk during uptrends.
CME Fedwatch
What is the likelihood that the Fed will change the Federal target rate at upcoming FOMC meetings, according to interest rate traders? Use CME FedWatch to track the probabilities of changes to the Fed rate, as implied by 30-Day Fed Funds futures prices.
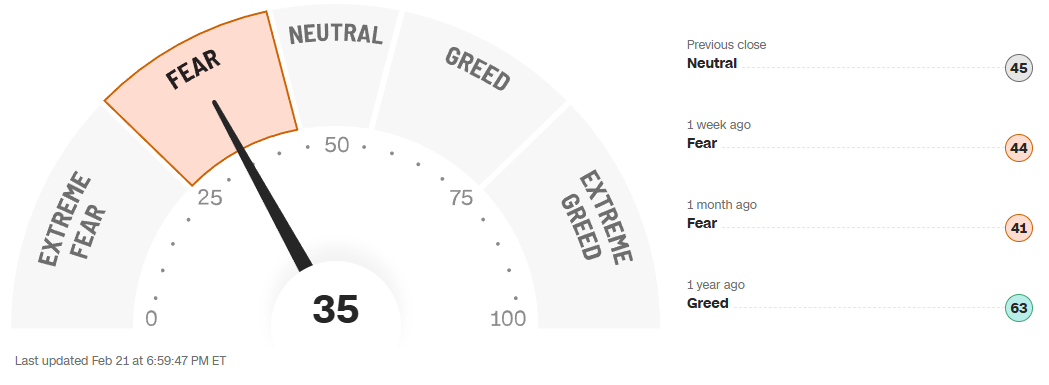
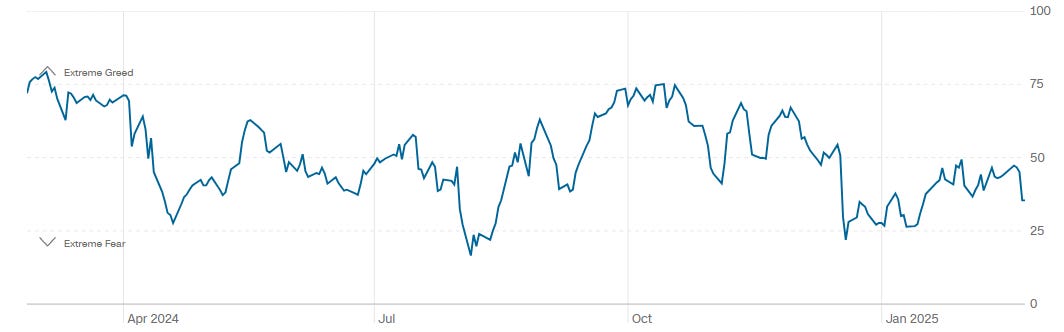
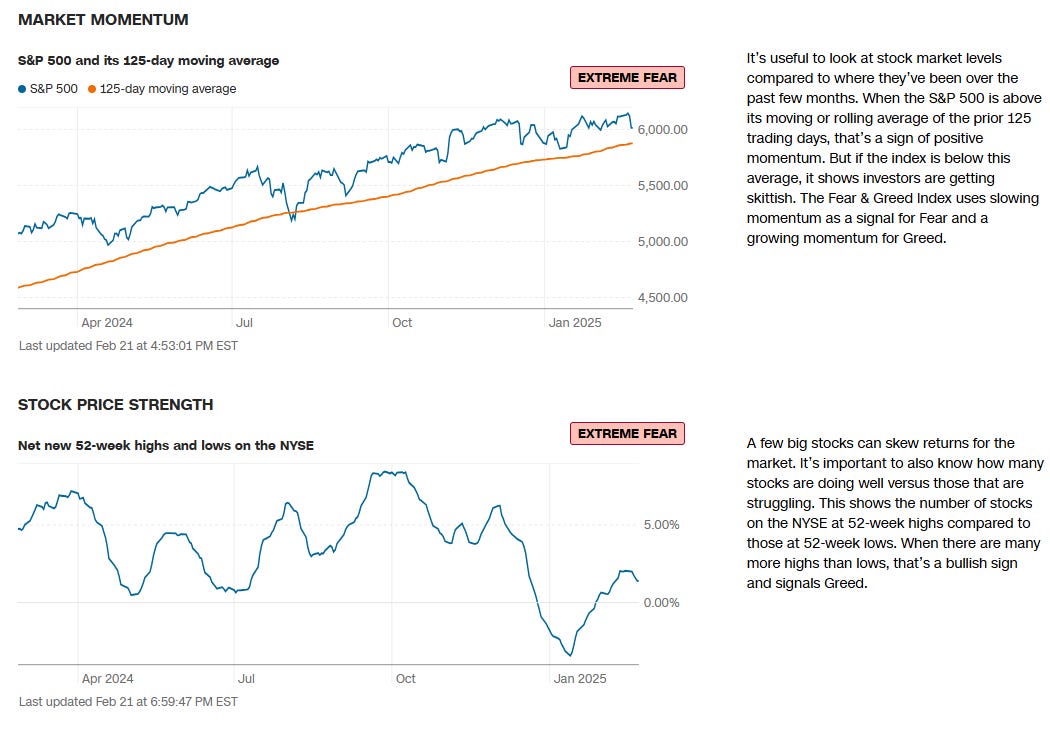
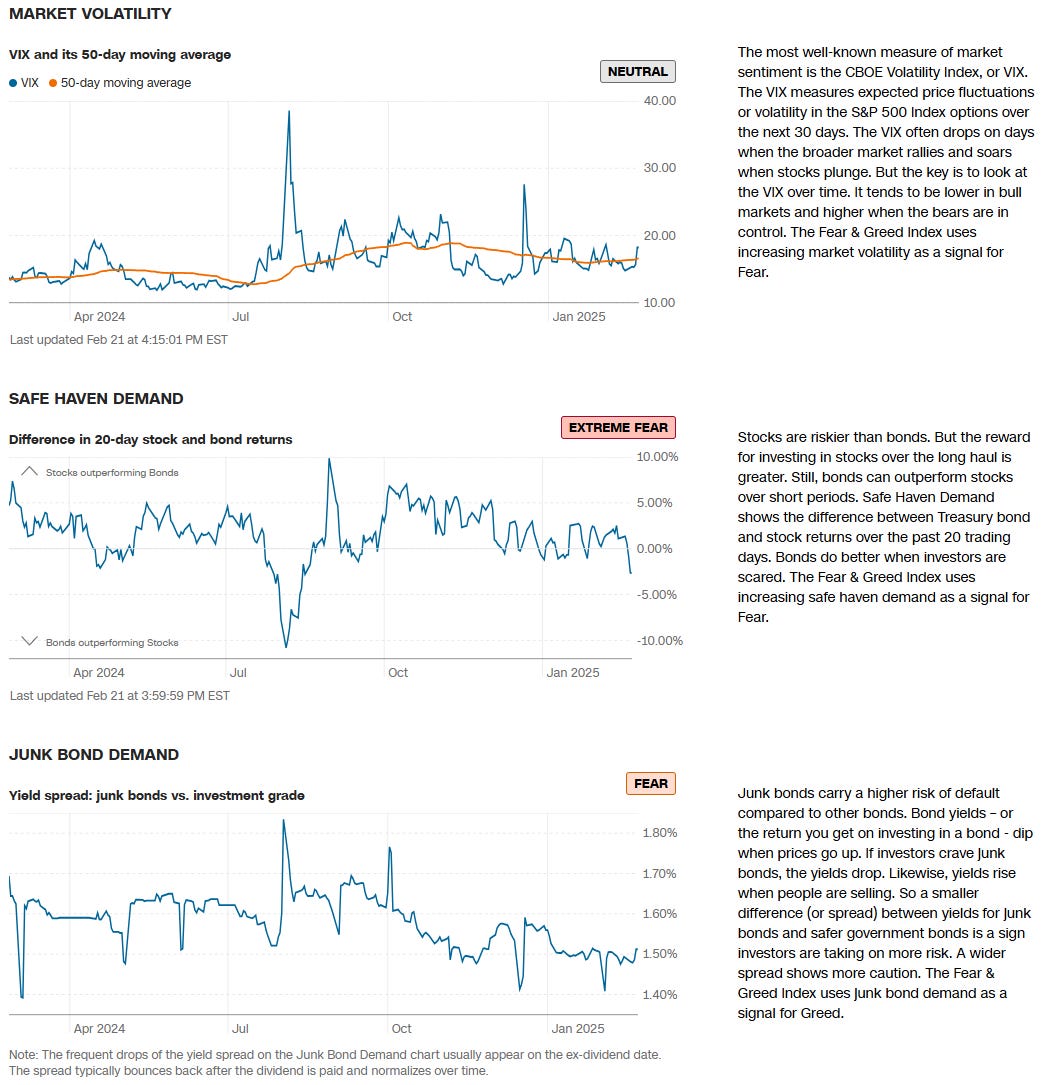
CNN Fear & Greed Constituent Data Points & Composite Index
Institutional S/R Levels for Major Indices
When you’re a large institutional player, your primary goal is to find liquidity - places to do a ton of business with the least amount of slippage possible. VolumeLeaders.com automatically identifies and visually plots the exact spots where institutions are doing business and where they are likely to return for more. It’s one of the primary reasons “support” and “resistance” concepts work and truly one of the reasons “price has memory”.
Levels from the VolumeLeaders.com platform can help you formulate trades theses about:
Where to add or take profit
Where to de-risk or hedge
What strikes to target for options
Where to expect support or resistance
And this is just a small sample; there are countless ways to leverage this information into trades that express your views on the market. The platform covers thousands of tickers on multiple timeframes to accommodate all types of traders. Observe for yourself how accurate the levels are by marking-up your charts with the information in the “Trade Levels” boxes and play-along in real-time this week.
SPY 0.02%↑
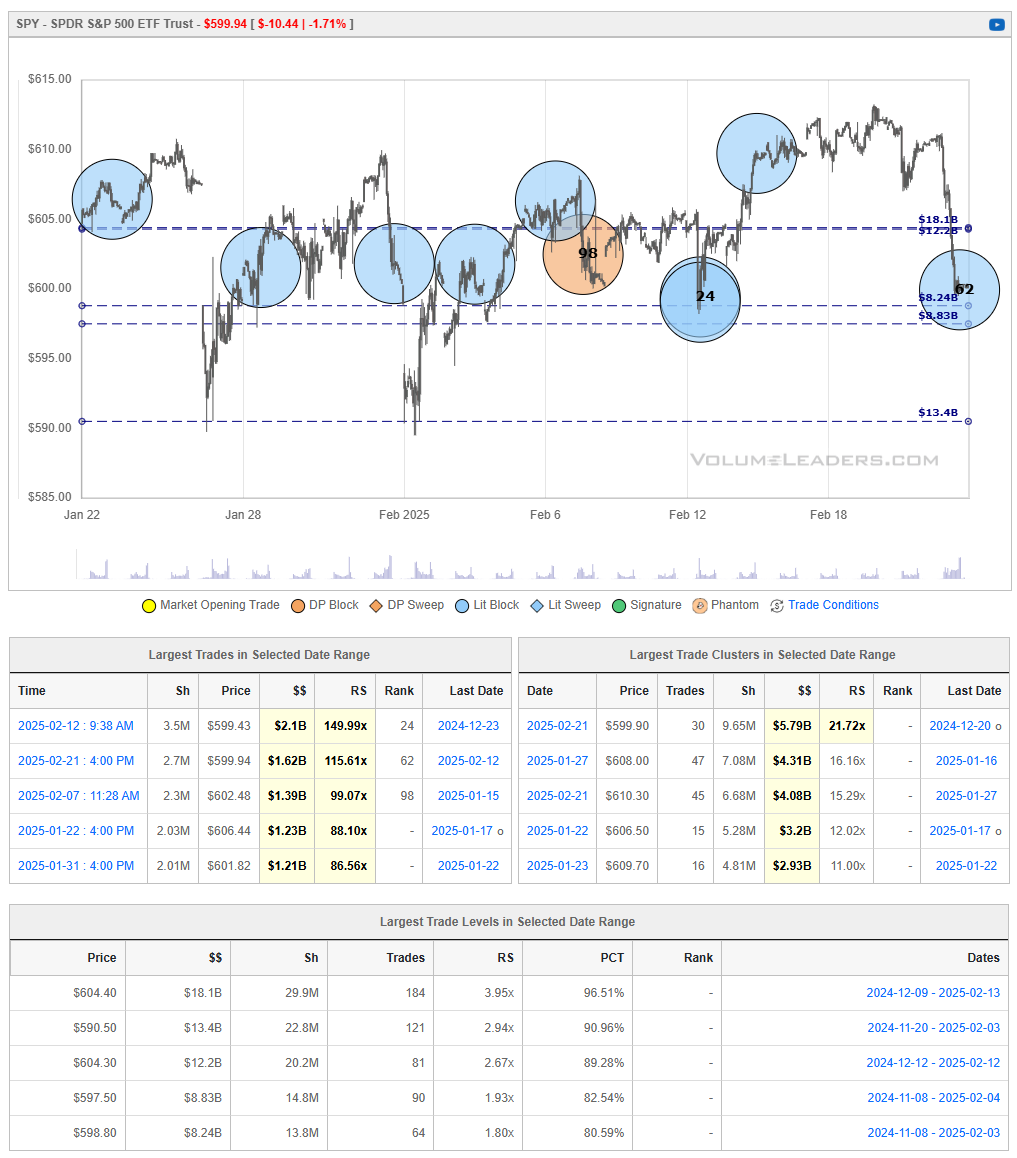
SPY’s recent pullback from the $610 area has driven price below the $600 level, highlighting that near‐term sellers are gaining traction. After repeatedly testing and briefly holding above $600–$605 in February, the ETF is now breaking lower, indicating that prior support has turned into overhead supply.
If buyers fail to reclaim $600–$605 soon, SPY could slide further toward the $595–$590 band, where past volume suggests a potential support shelf. Conversely, a decisive recovery above $605 would signal that bulls have absorbed the current wave of selling, setting up a possible re‐test of the recent highs near $610.
QQQ -0.01%↓

QQQ recently rolled over from the mid‐$530s, losing traction as it pushed below the $530–$535 zone of overhead supply. The ETF has since pulled back toward $525, where prior institutional trades suggest potential near‐term support. If QQQ can stabilize above $520–$525 and recover quickly, it may attempt another push toward $530–$535, testing whether buyers can reabsorb supply. However, a decisive break below $520 raises the risk of a deeper retracement, potentially targeting the $510–$515 region where stronger demand might re‐emerge.
IWM 0.00%↑
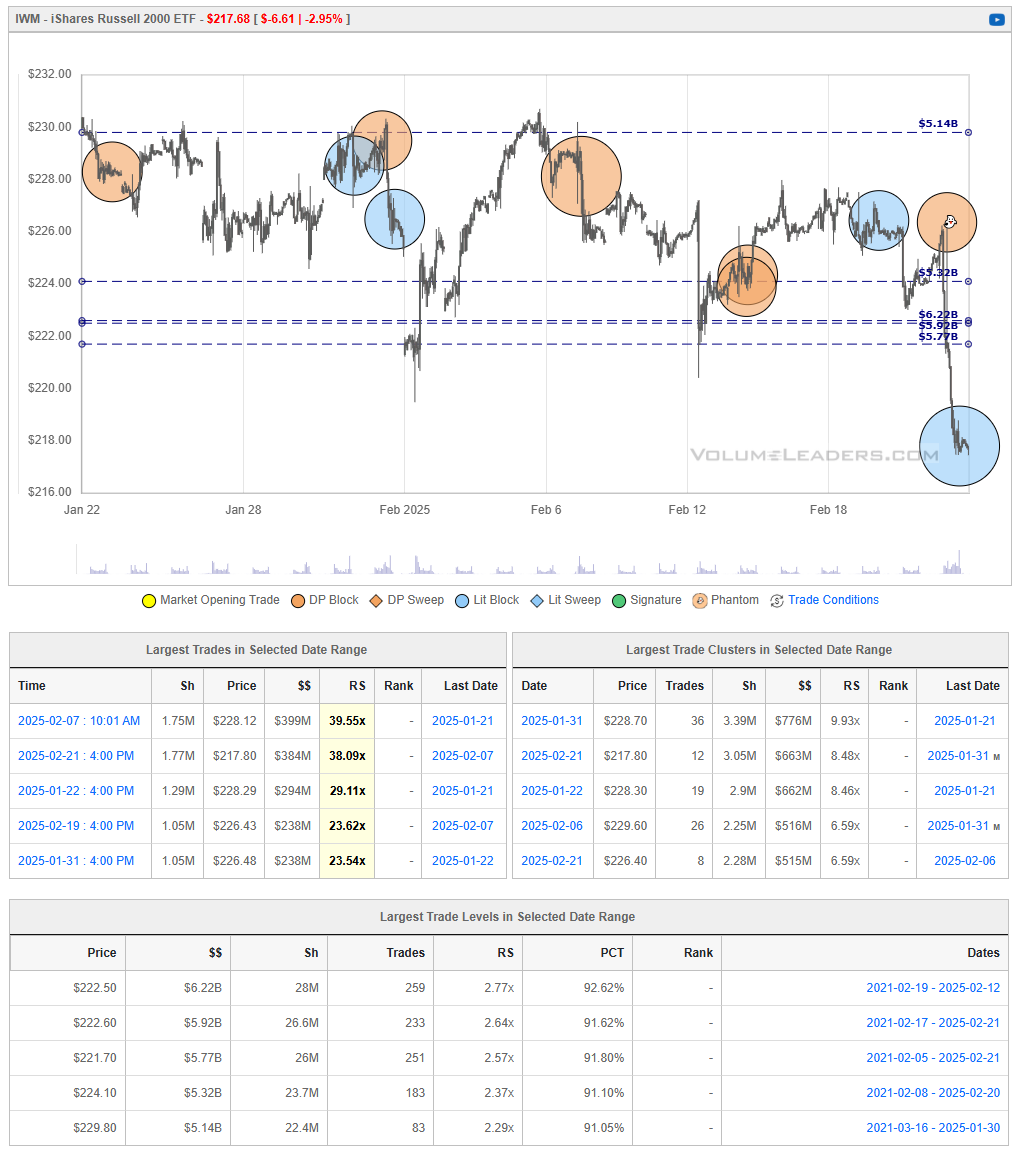
IWM’s break below the key $220–$222 support zone triggered a wave of selling pressure, sending price sharply lower toward the mid‐$210s. Previous institutional trade clusters around $224–$226 are now likely to function as overhead resistance. If buyers can stage a recovery and reclaim that range, it would signal that demand has returned and potentially stabilize the market. However, continued weakness beneath $220 increases the likelihood of further downside, with the next meaningful support levels not clearly defined until the ETF approaches the lower $210s.
DIA 0.00%↑
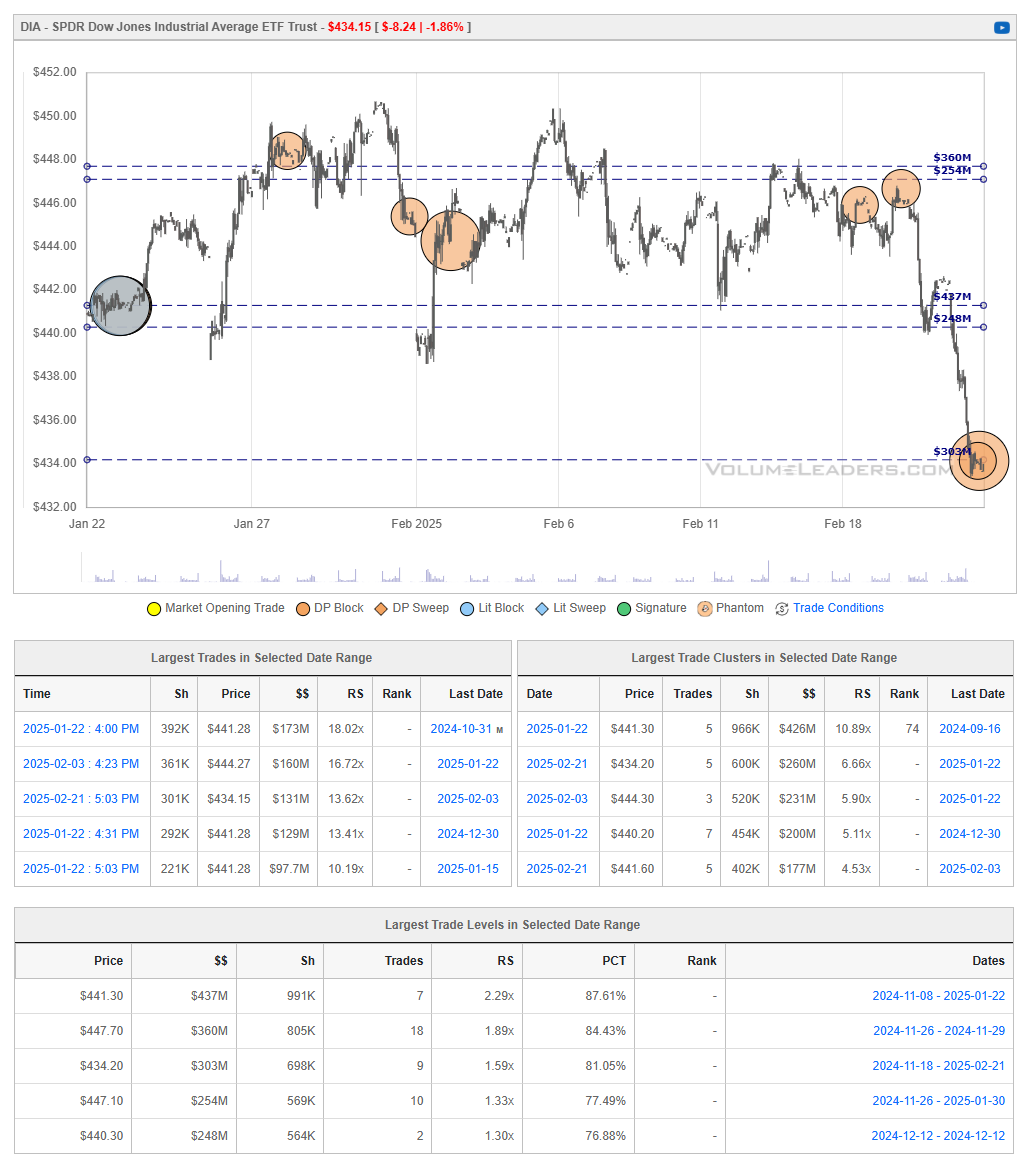
DIA has experienced a notable breakdown from its earlier trading range, slicing through key support levels in the $440–$444 region. Heavy selling pressure drove price into the lower $430s, where limited institutional support suggests a vulnerable market. If buyers cannot quickly recapture the mid‐$440s, DIA risks extending its decline further, with only weaker support visible at lower levels.
Institutional Order Flow
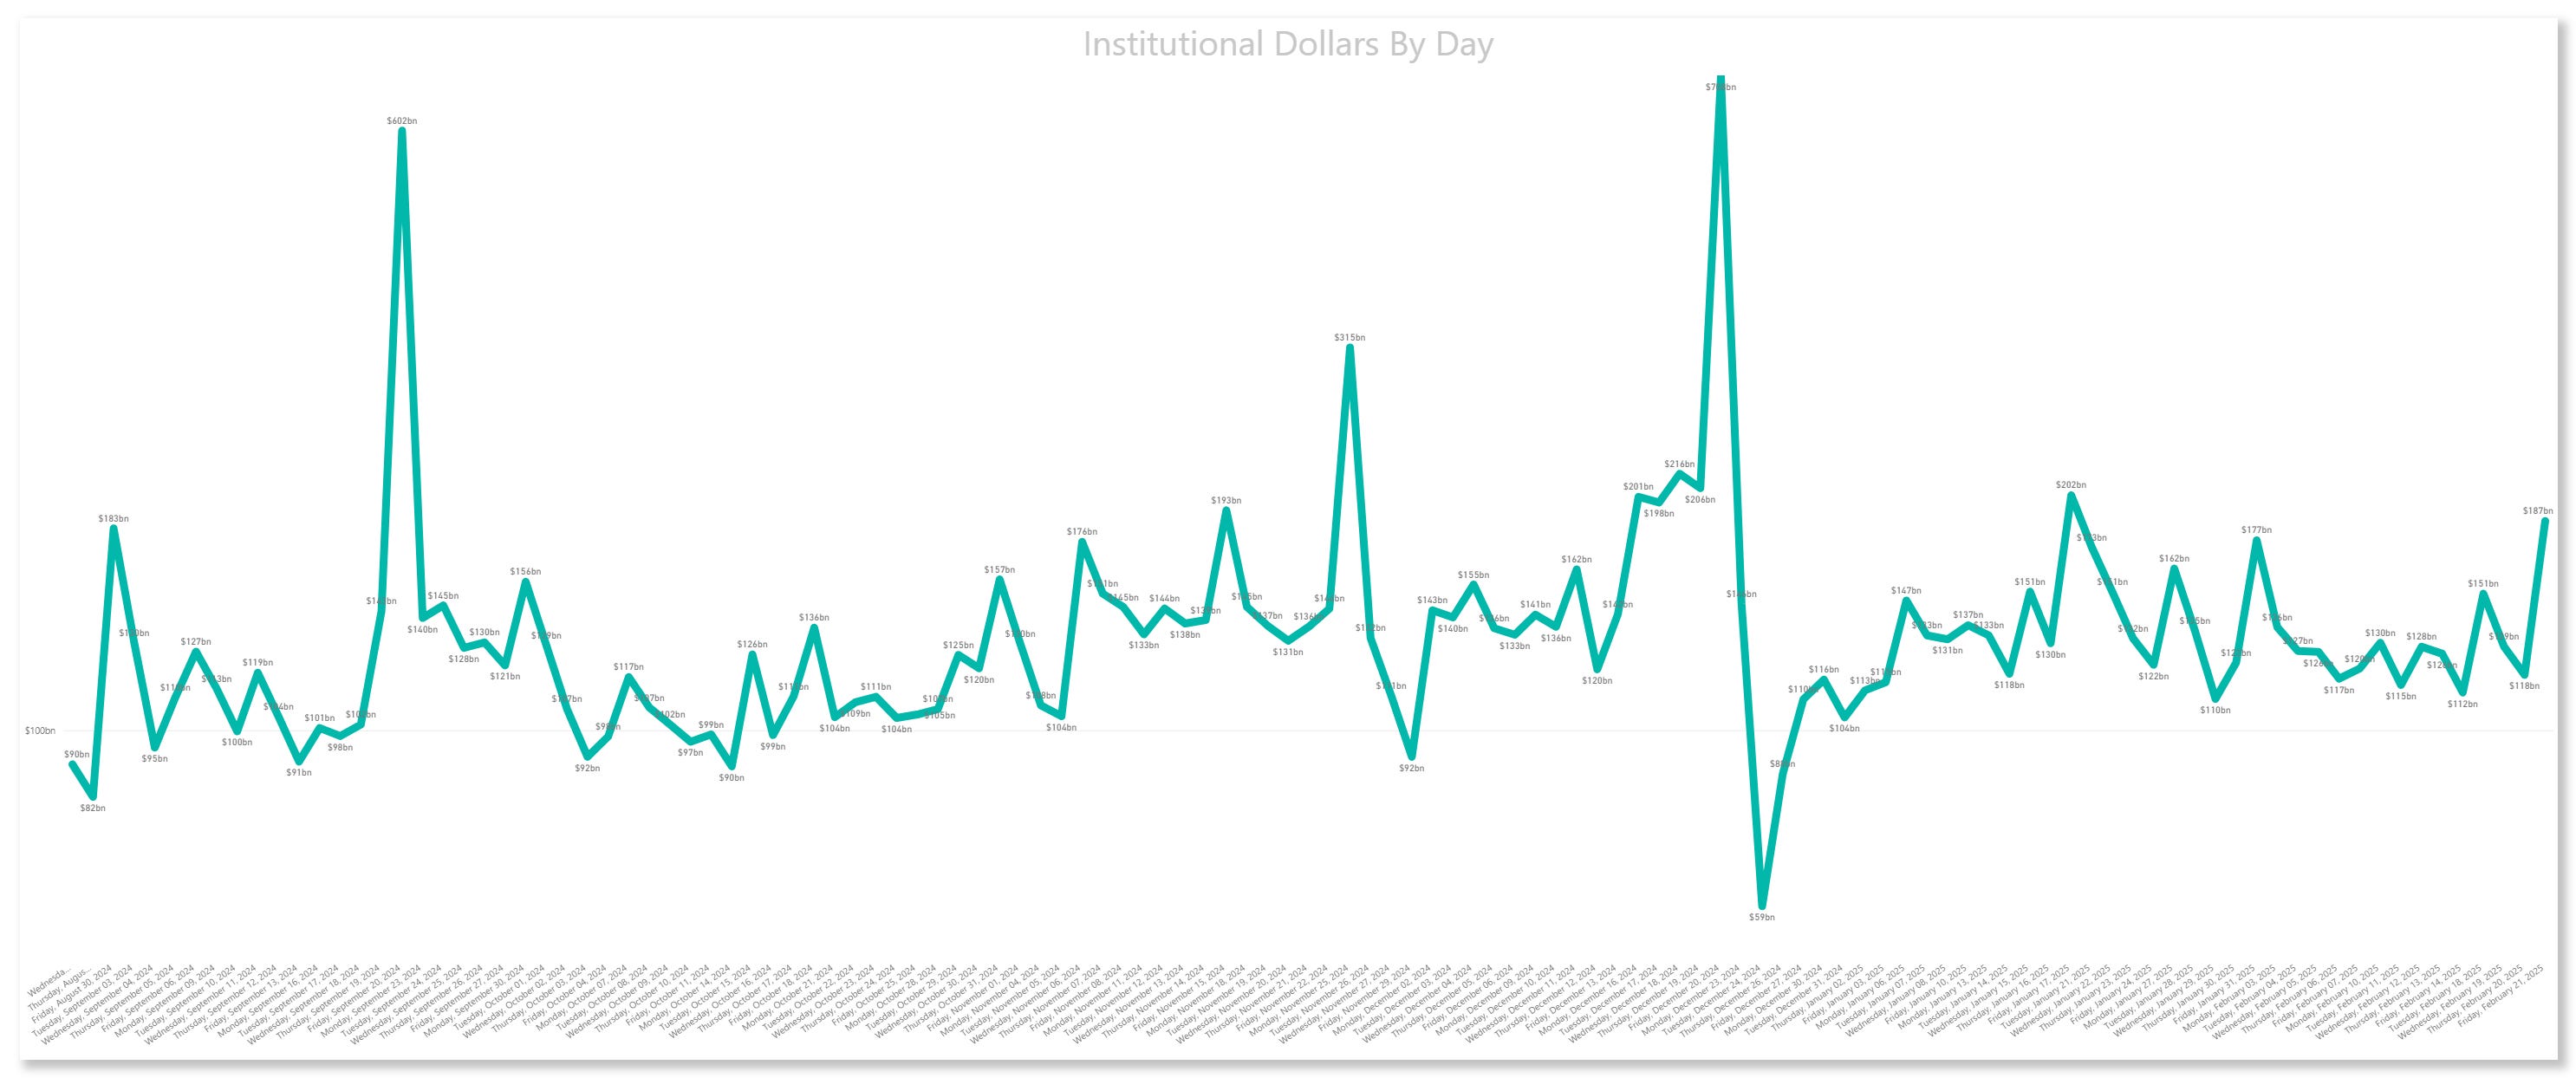
Rolling 90-Day Dollars By Day
This chart shows institutional activity by dollars by day on a rolling 1-year basis. From a theoretical standpoint, examining a chart of daily institutional dollar activity over the course of a year can offer several insights and possible inferences, though all should be approached with caution since the data alone may not prove causality or confirm underlying reasons. Some potential takeaways include:
Event-Driven Behavior:
Sharp, singular spikes on certain days might correlate with major market-moving events. These could include central bank policy announcements, significant geopolitical news, sudden macroeconomic data releases (like employment reports or GDP data), earnings seasons for large-cap companies, or unexpected shocks (e.g., mergers, acquisitions, regulatory changes).Liquidity Dynamics:
Institutions often concentrate large trades on days with higher expected liquidity. For instance, heightened activity might coincide with index reconstitutions, option expiration dates, or the days leading up to or following a major index rebalance, when large amounts of capital shift hands simultaneously.Risk Management and Hedging Activity:
Institutions may significantly adjust their exposures on days that are critical from a risk management perspective. Large spikes can occur if hedge funds, pension funds, or asset managers are rolling over futures contracts, initiating or closing out large hedges, or reacting to volatility triggers.Market Sentiment Indicators:
While the data is purely transactional, the sheer volume of institutional involvement on certain days might indirectly hint at changing sentiment or strategic shifts.
In essence, a chart like this can lead you to hypothesize that institutional trading volumes are not constant or random but rather influenced by a mix of predictable calendar effects, major market events, liquidity considerations, risk management decisions, and strategic allocation shifts.
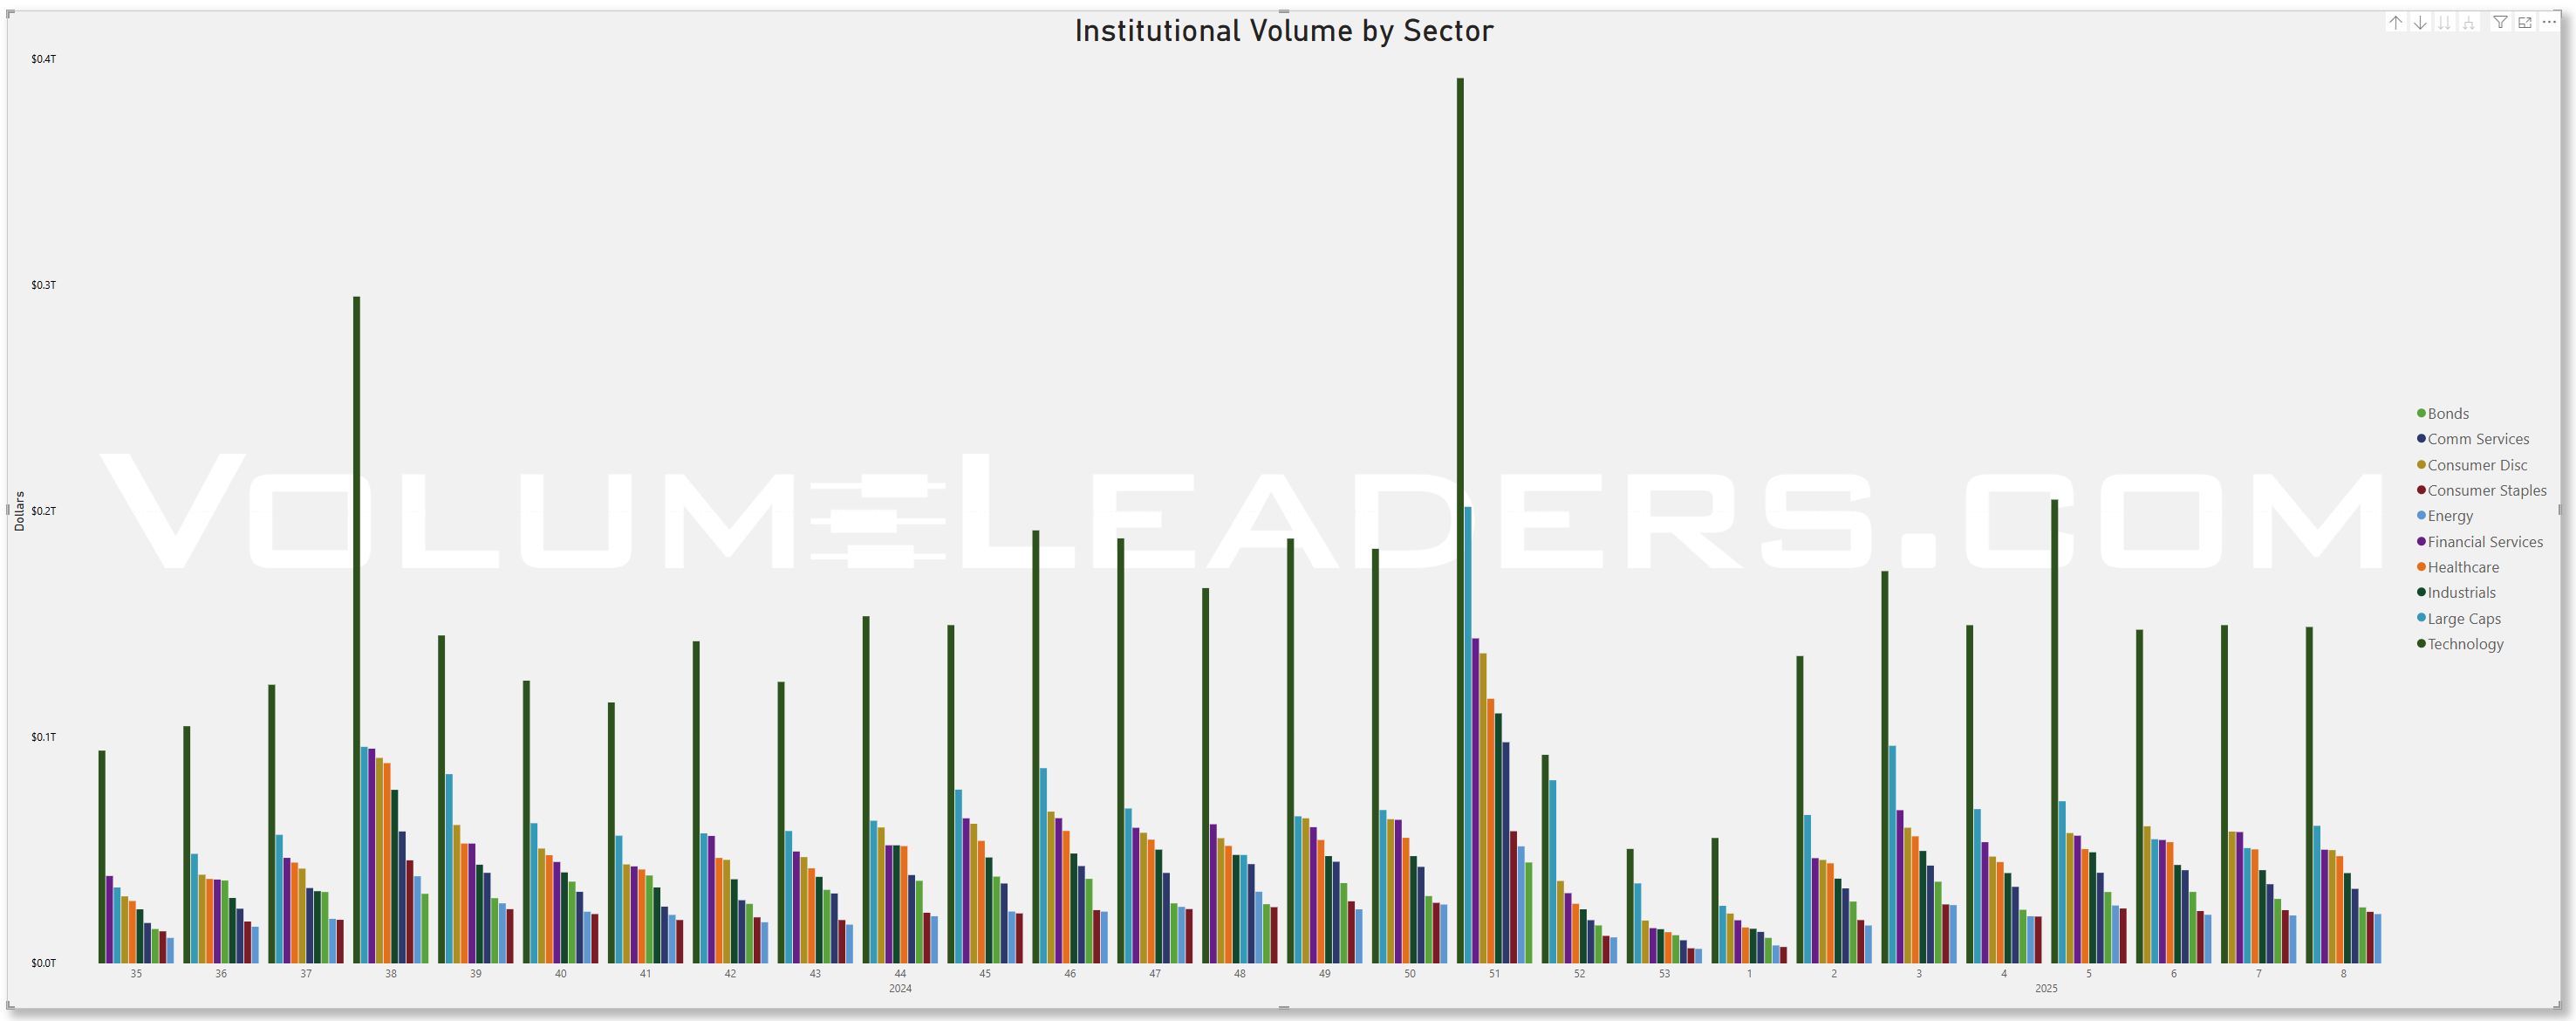
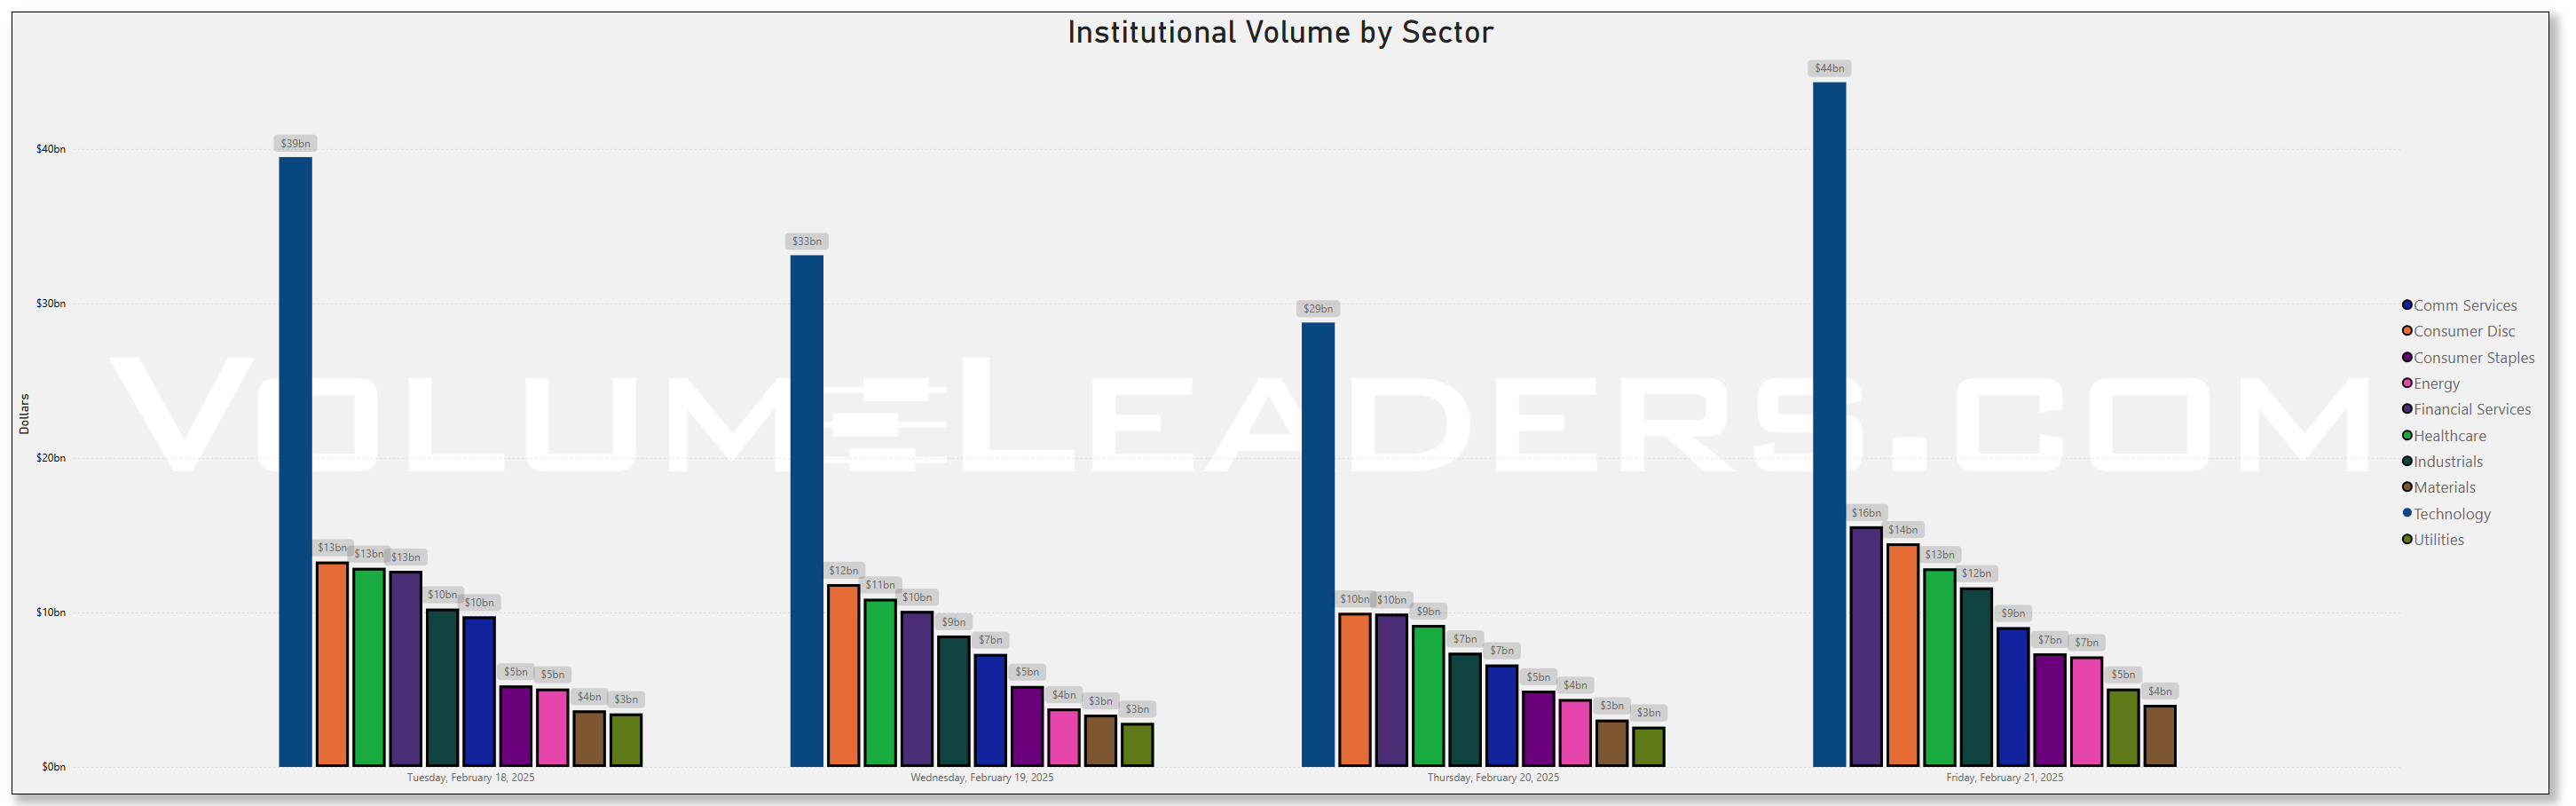
Top Institutional Order Flow By Sector By Week For The Past 90-Days
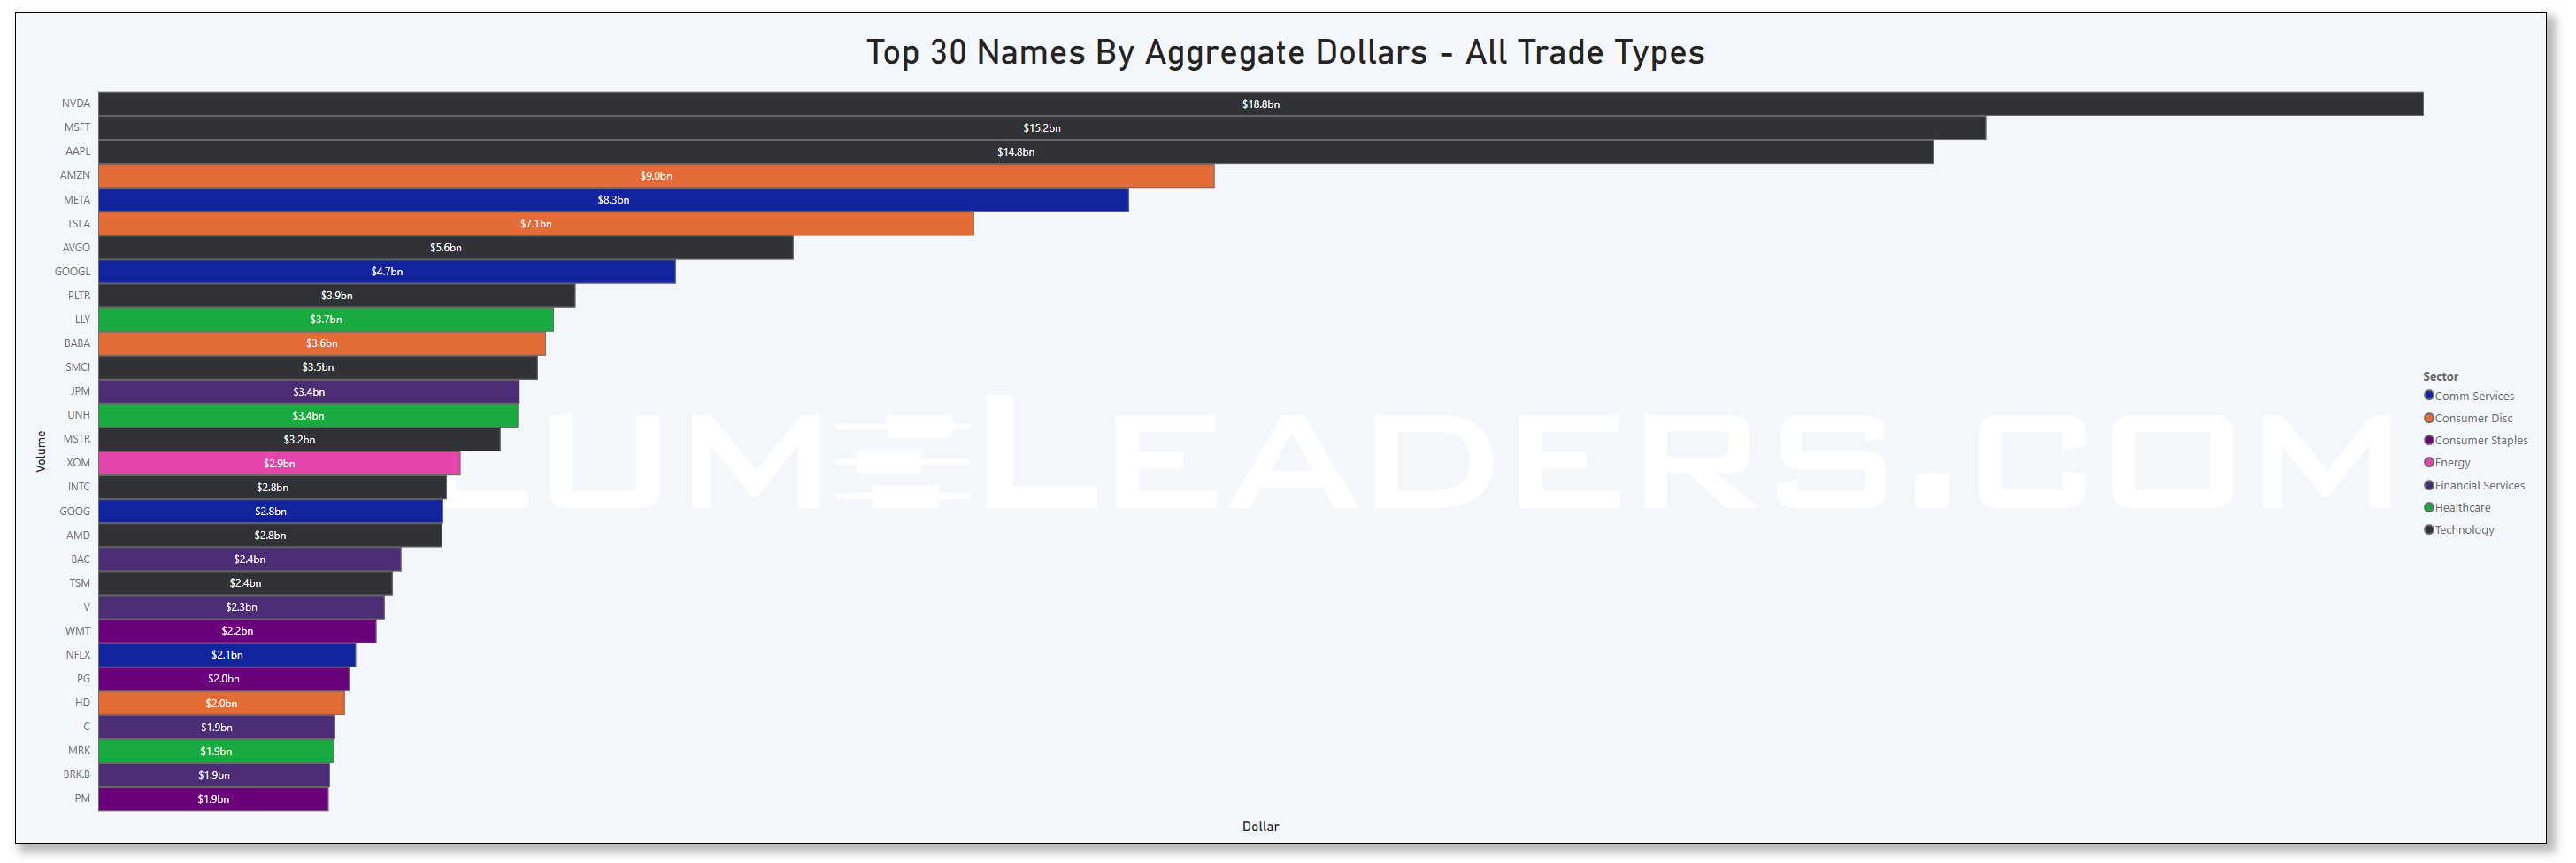
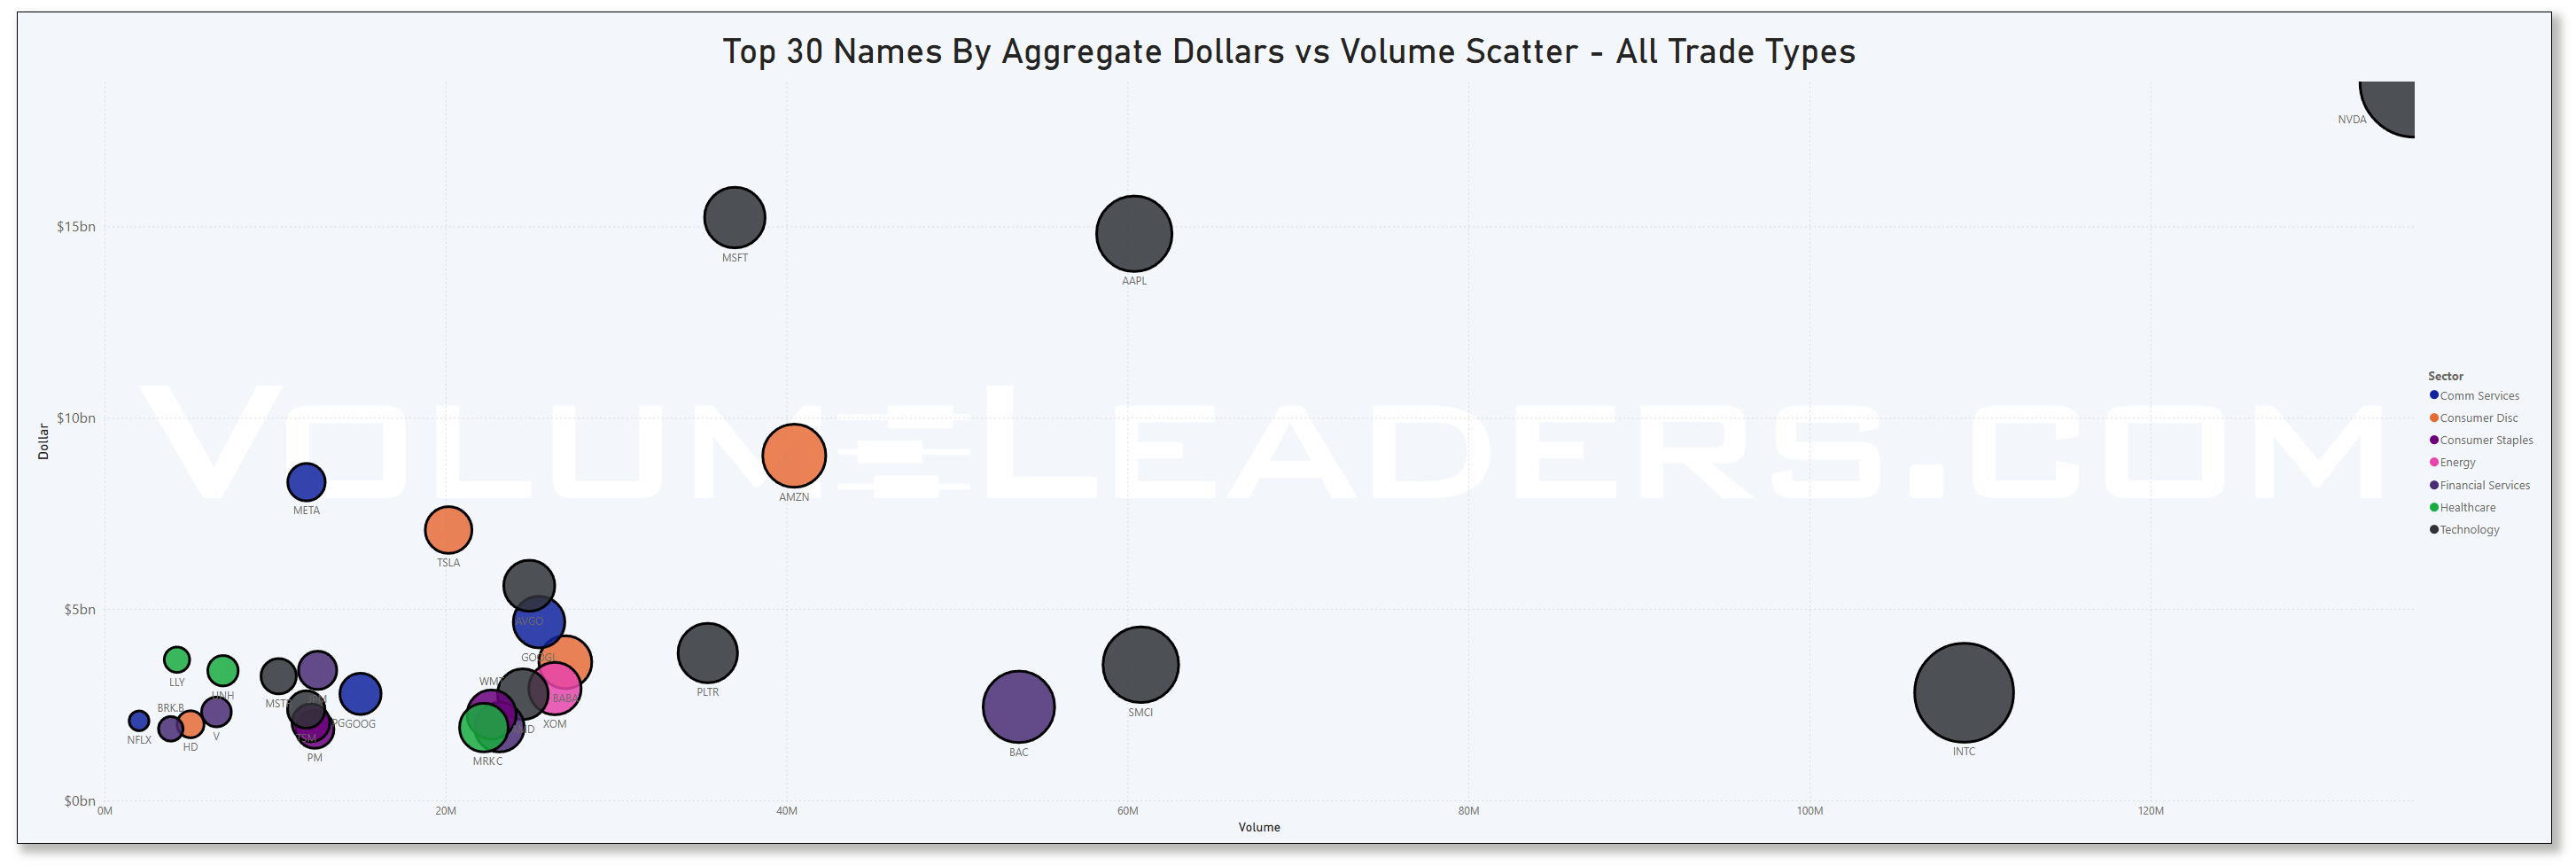
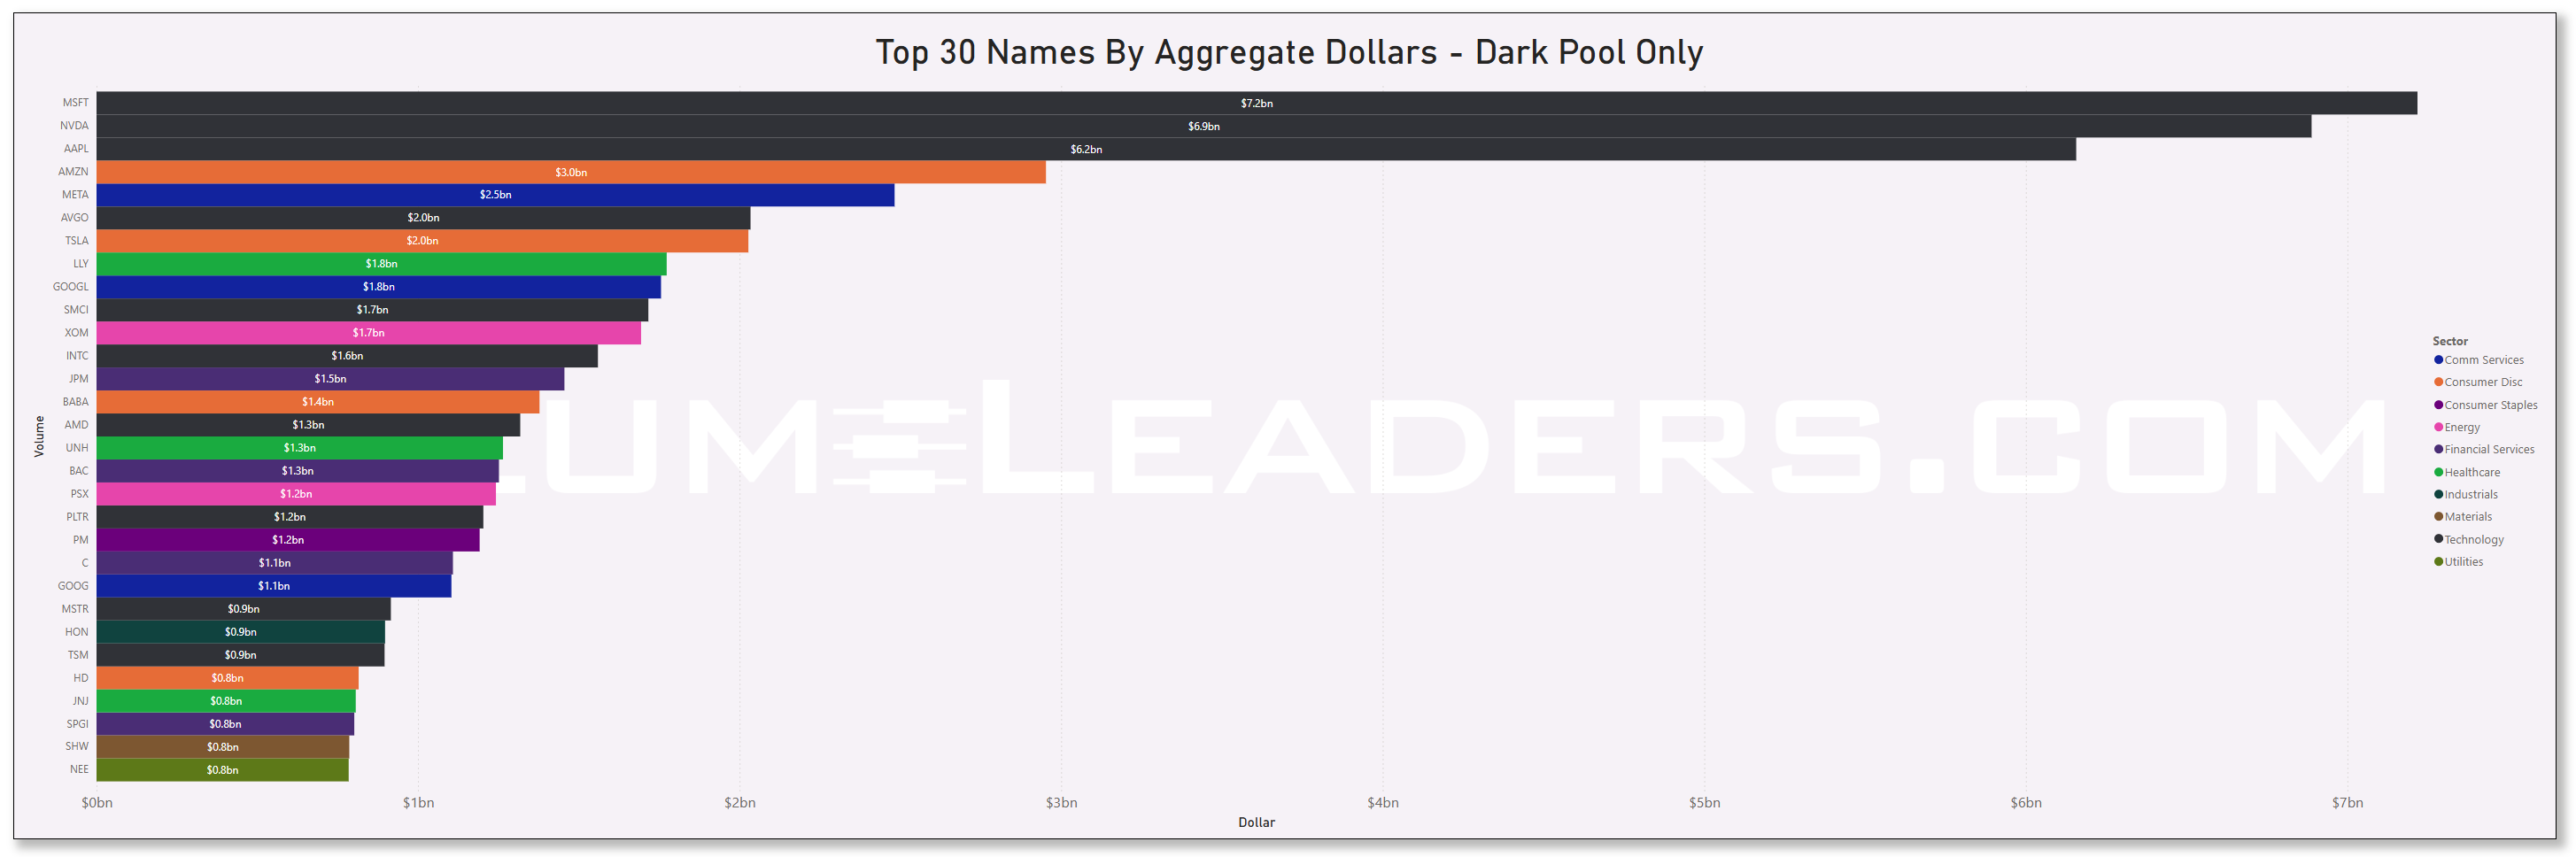
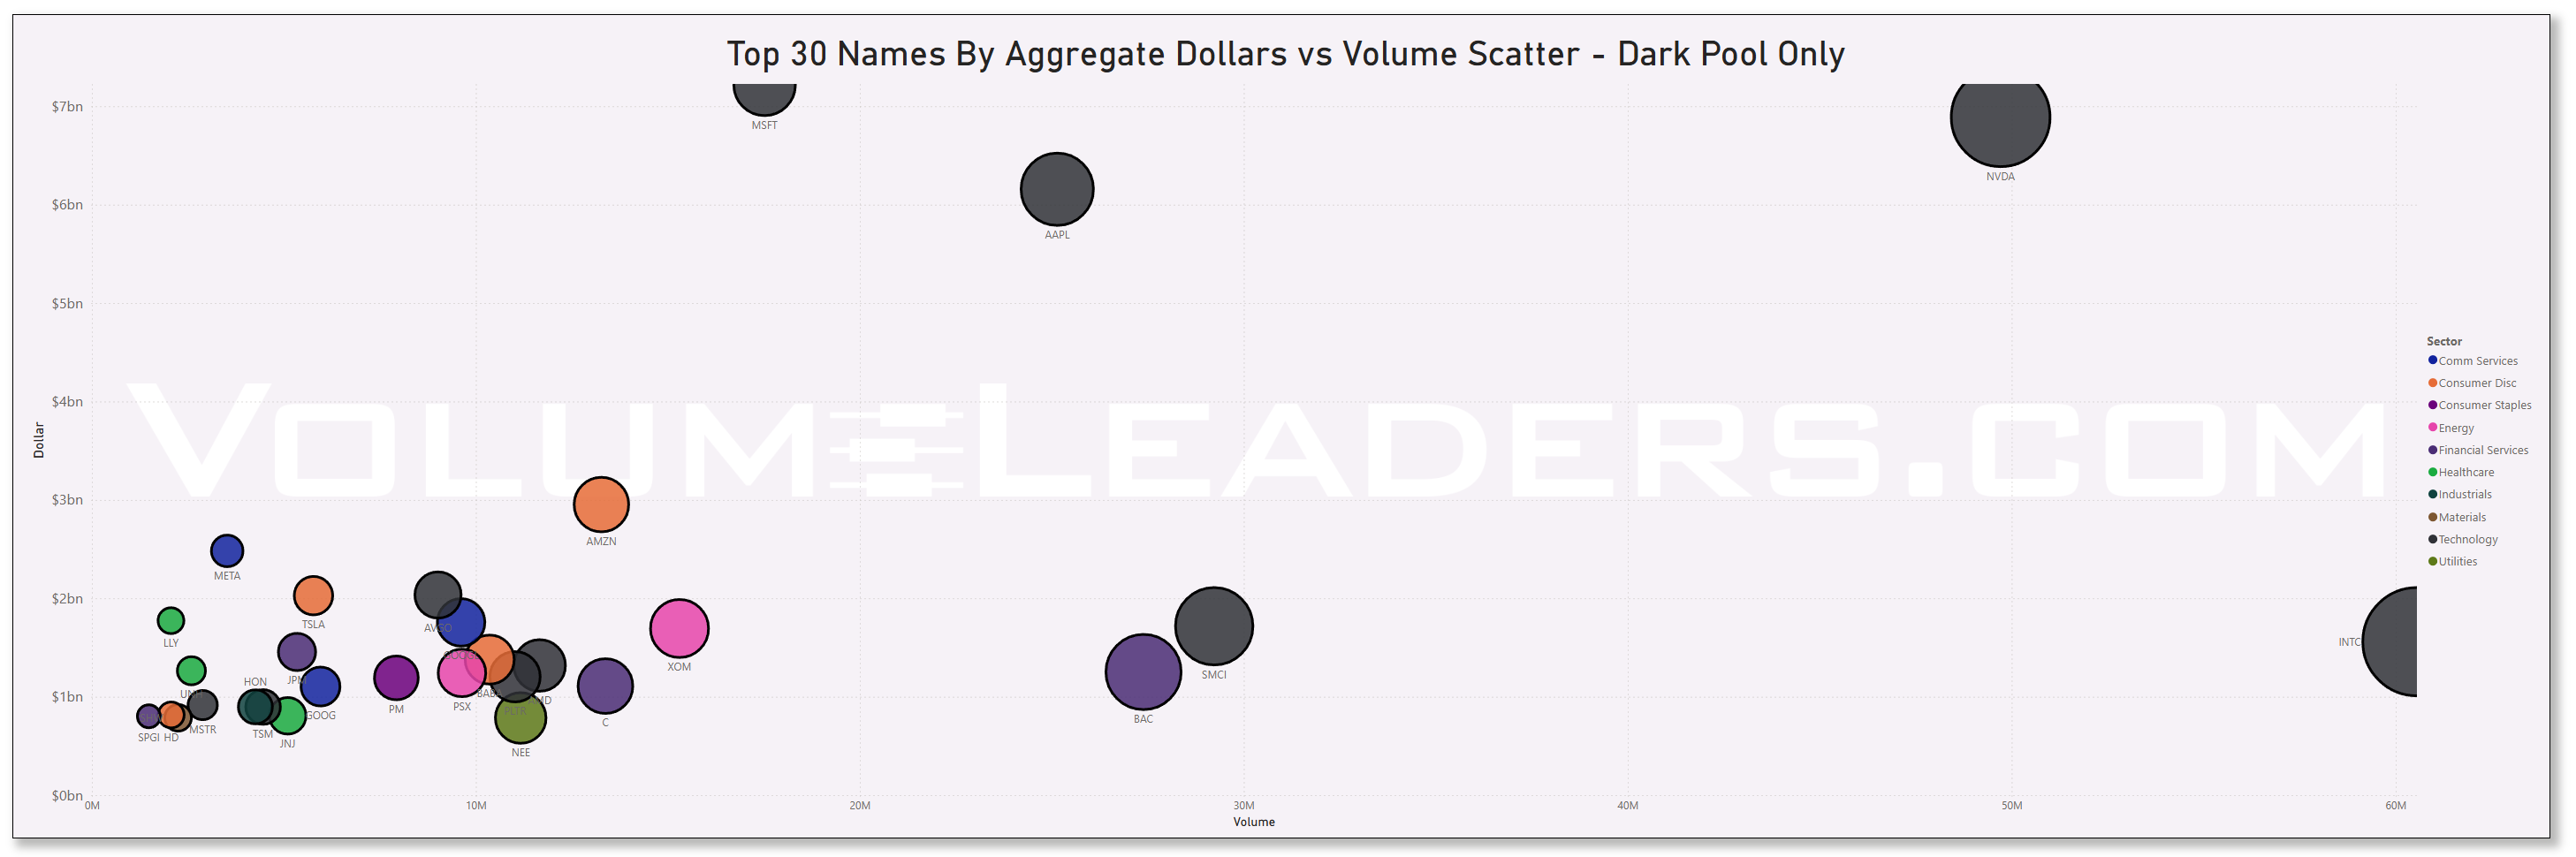
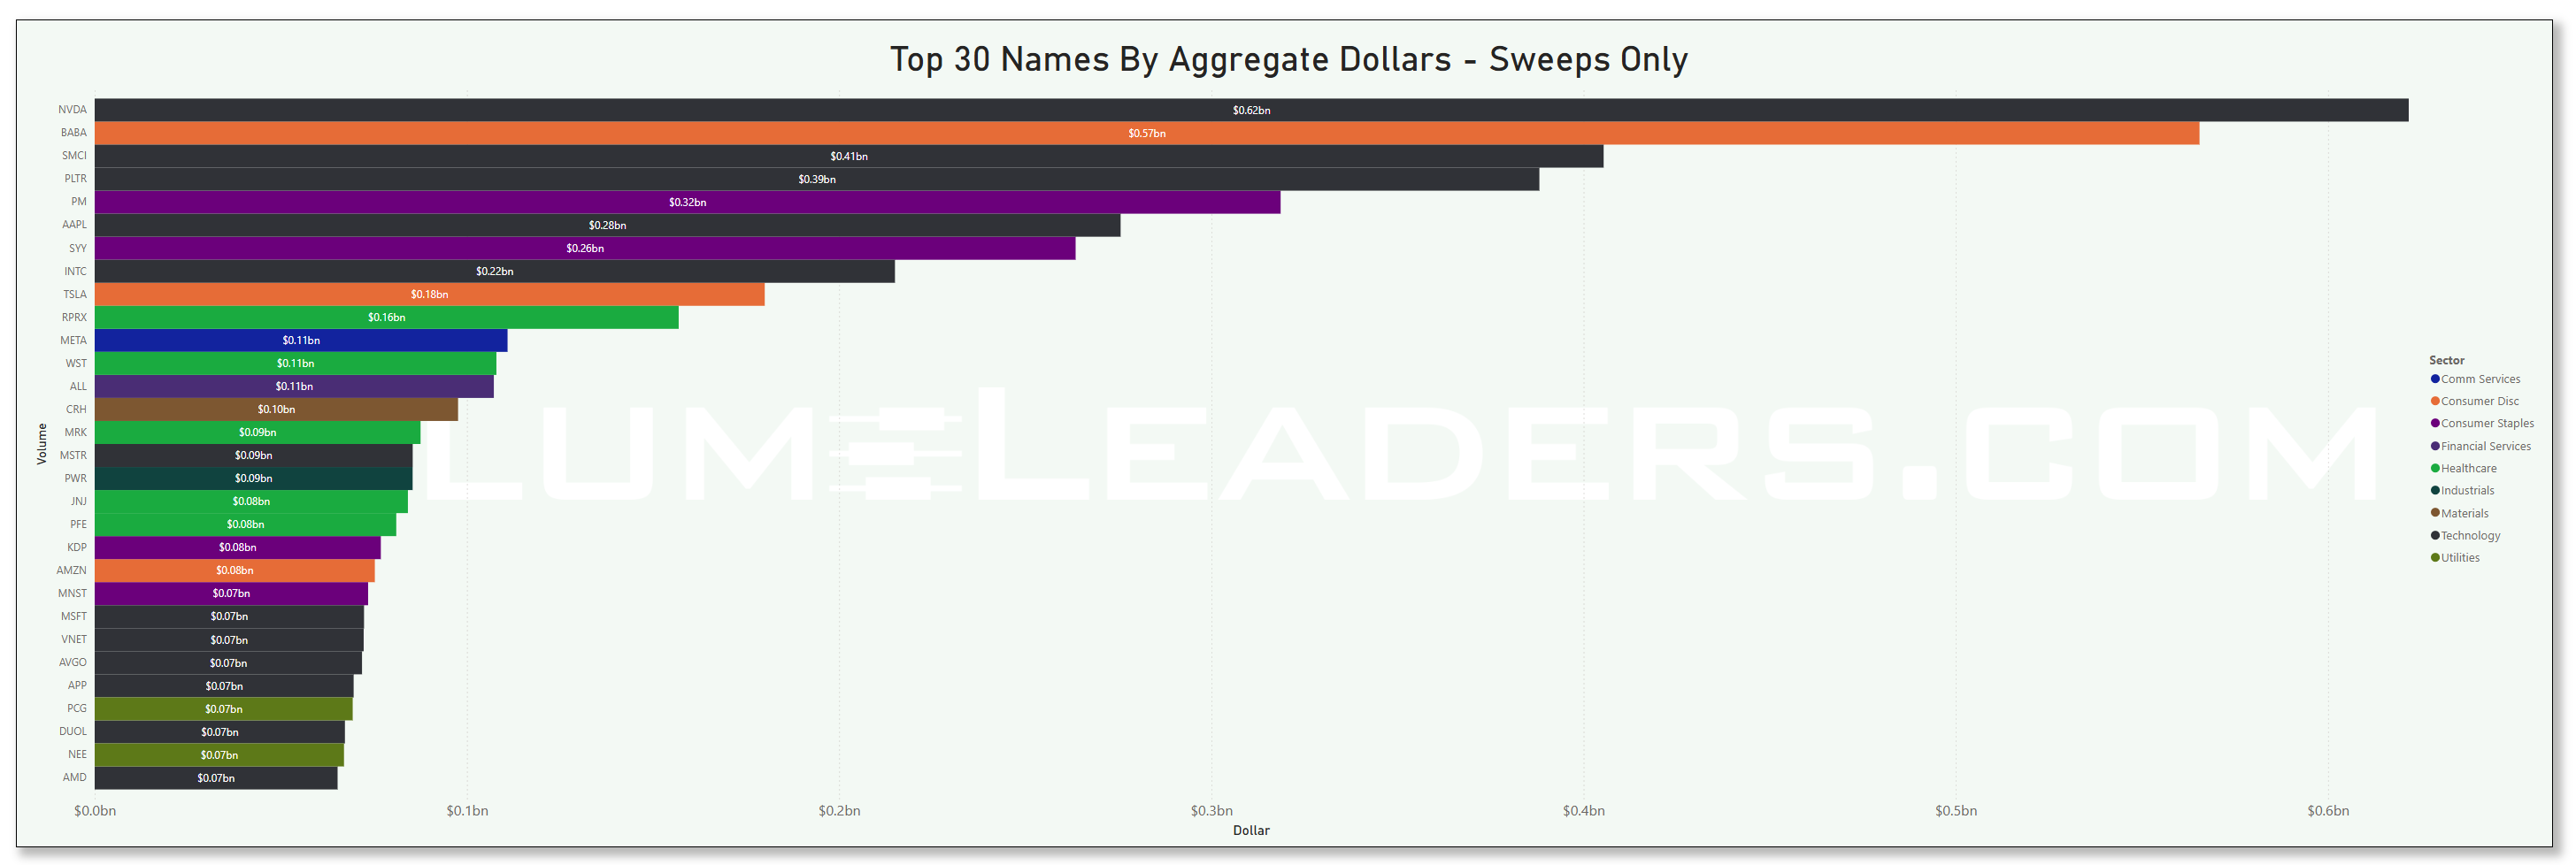
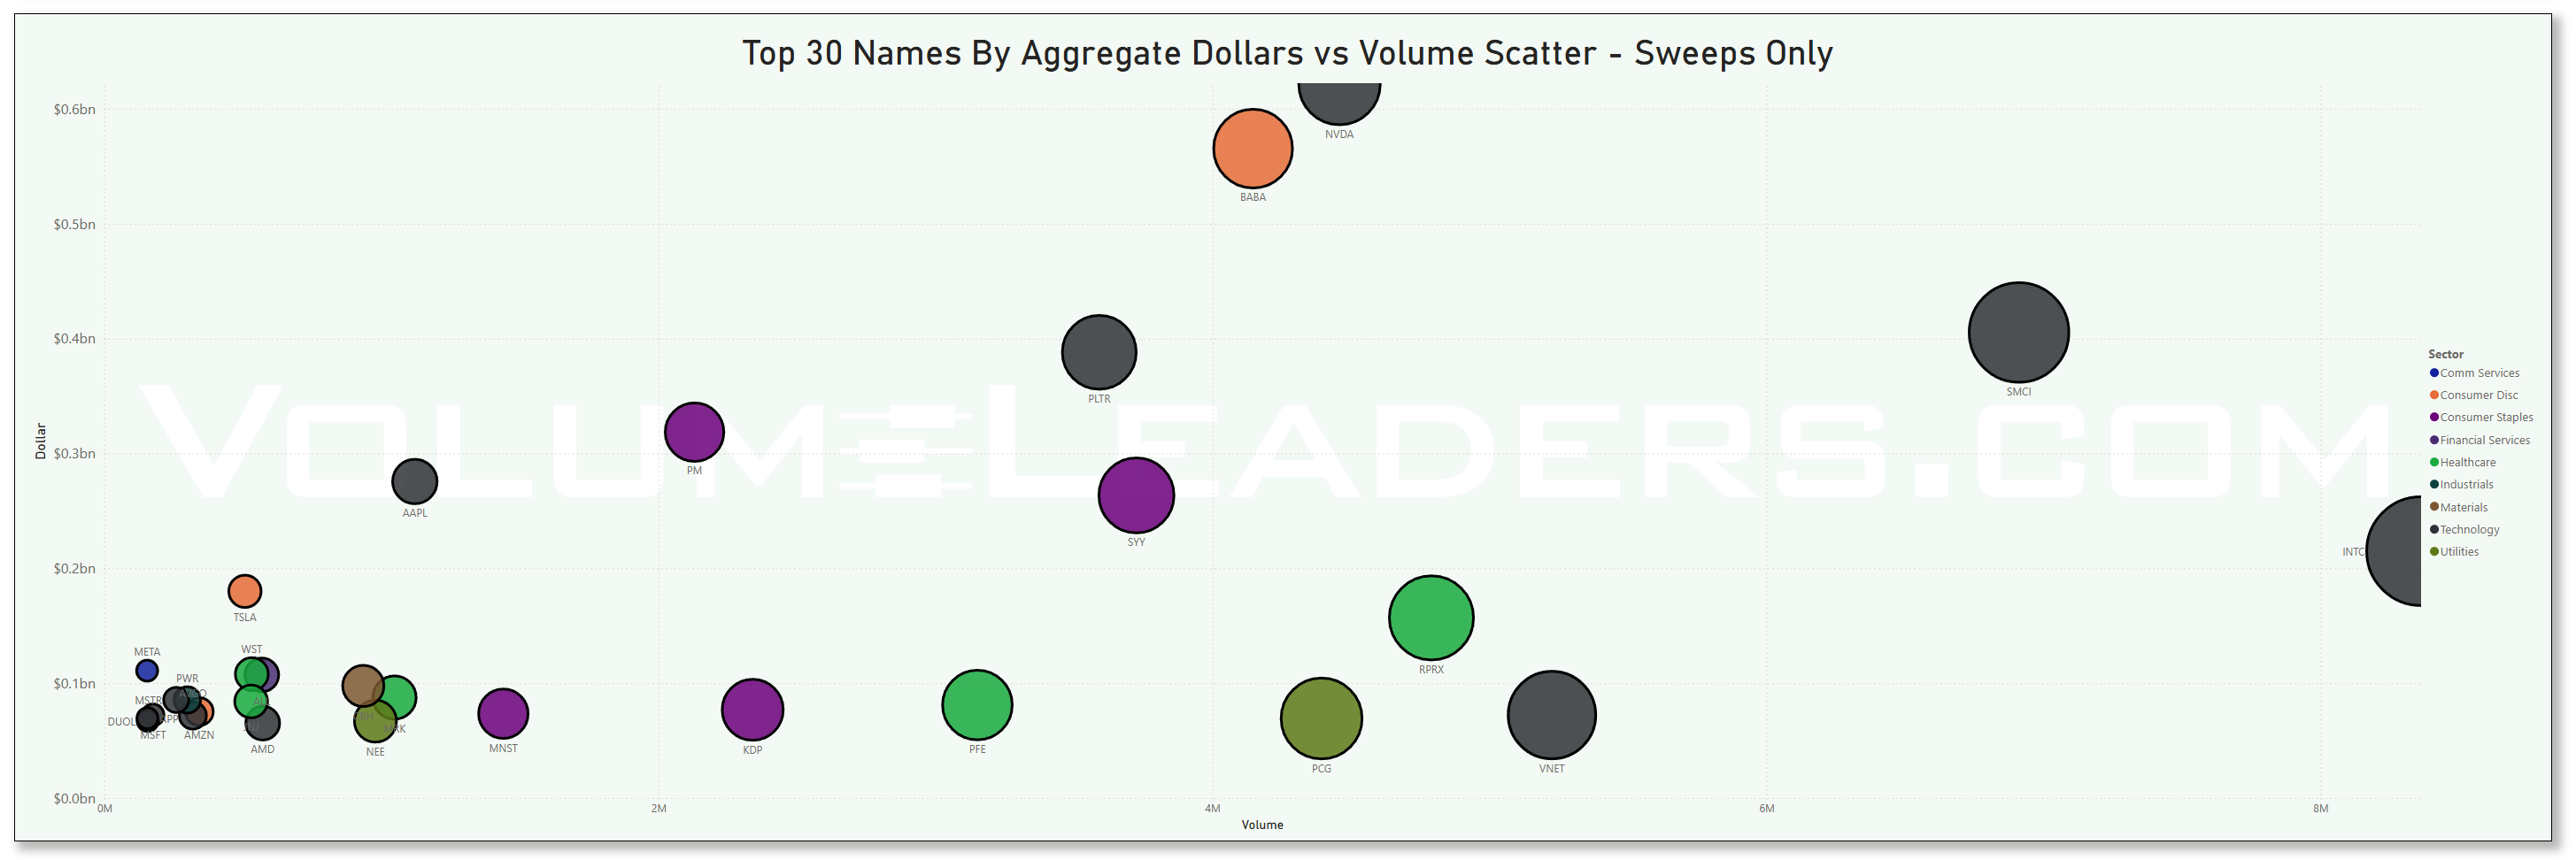
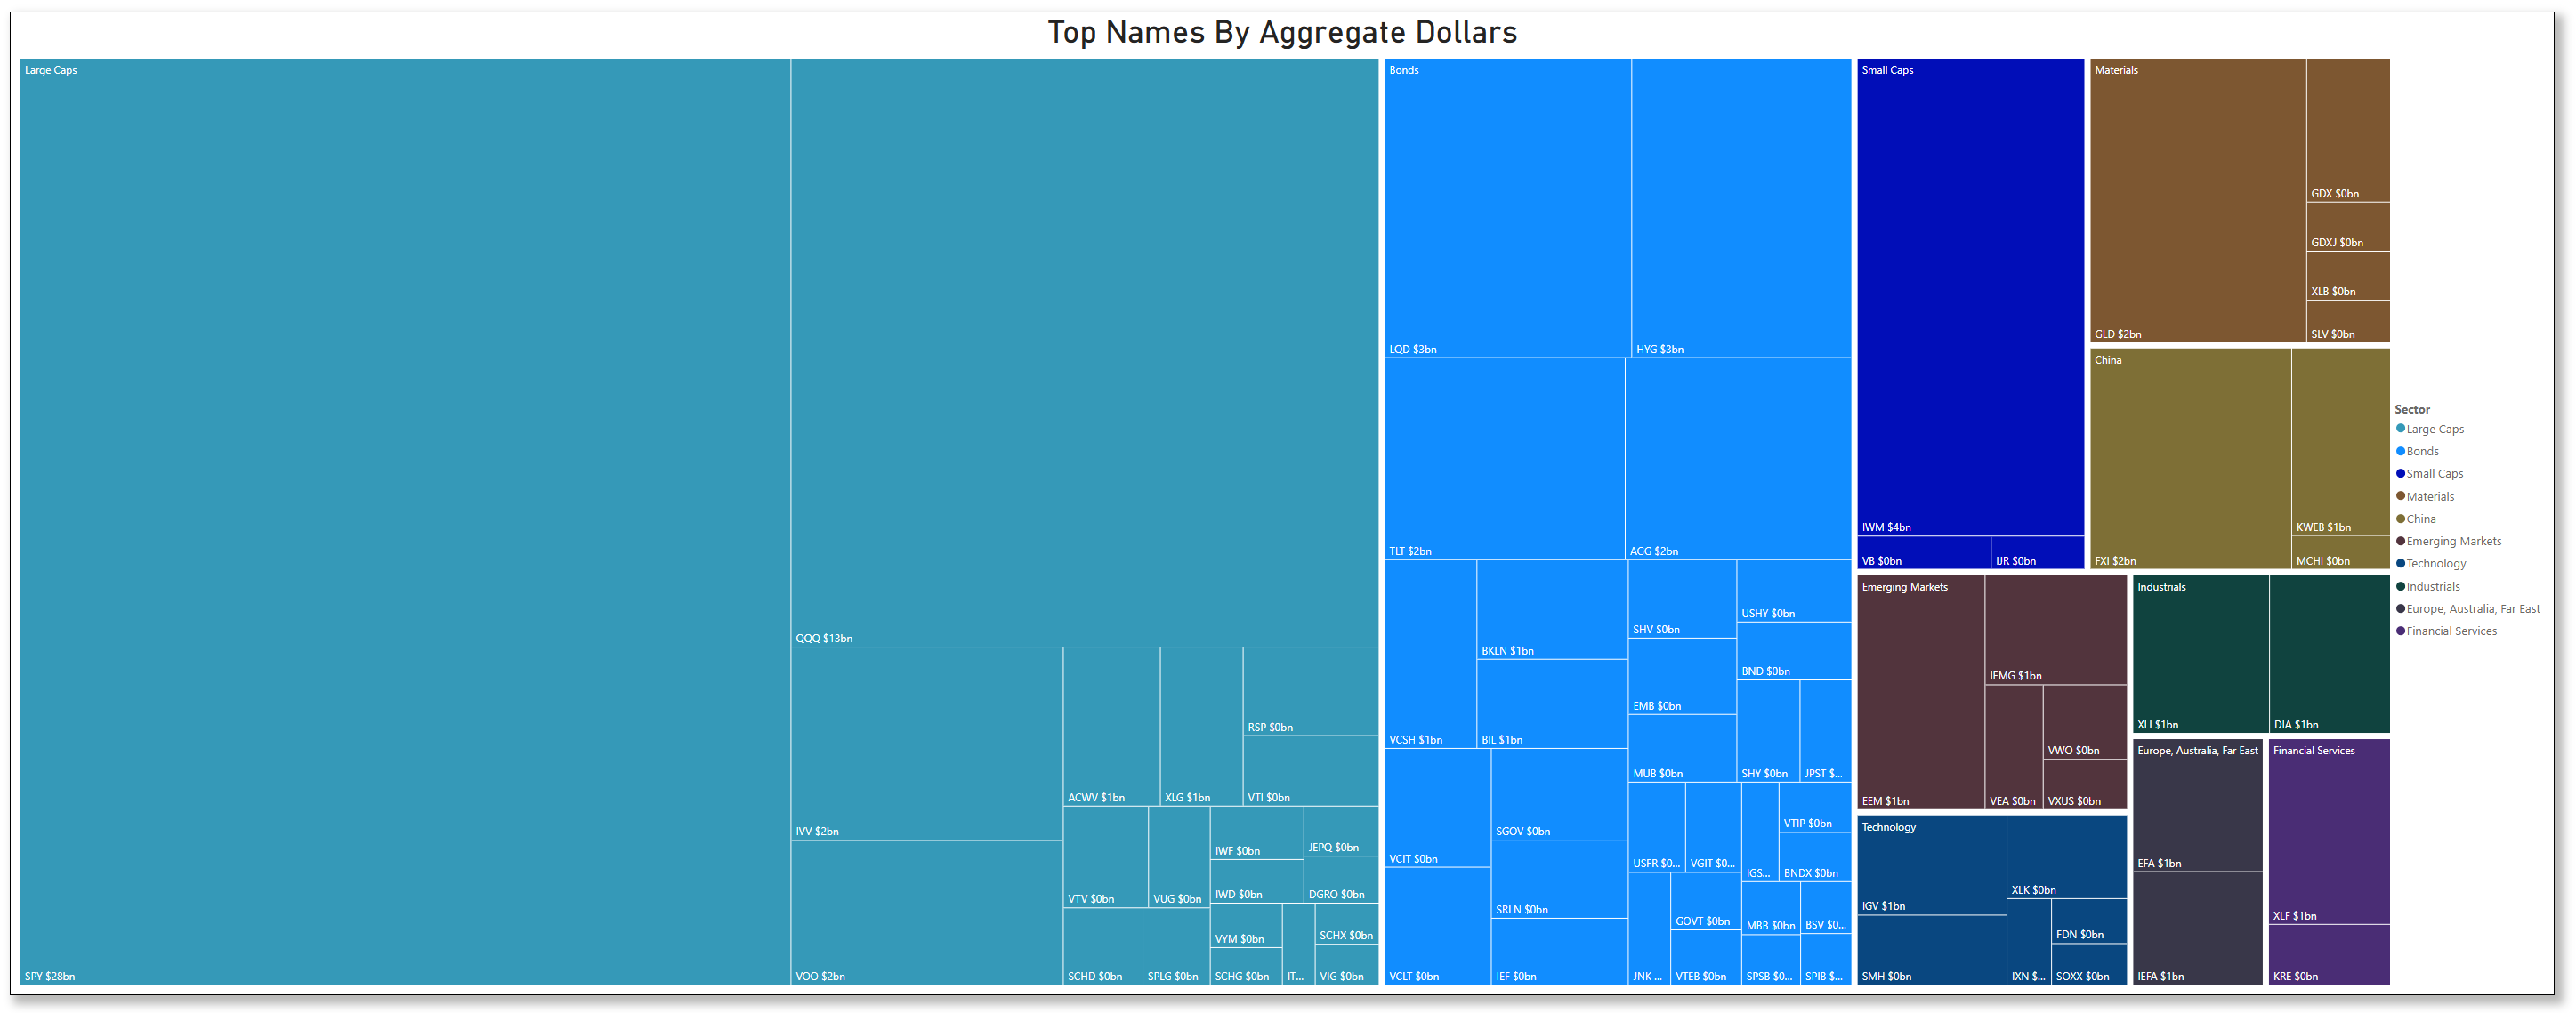
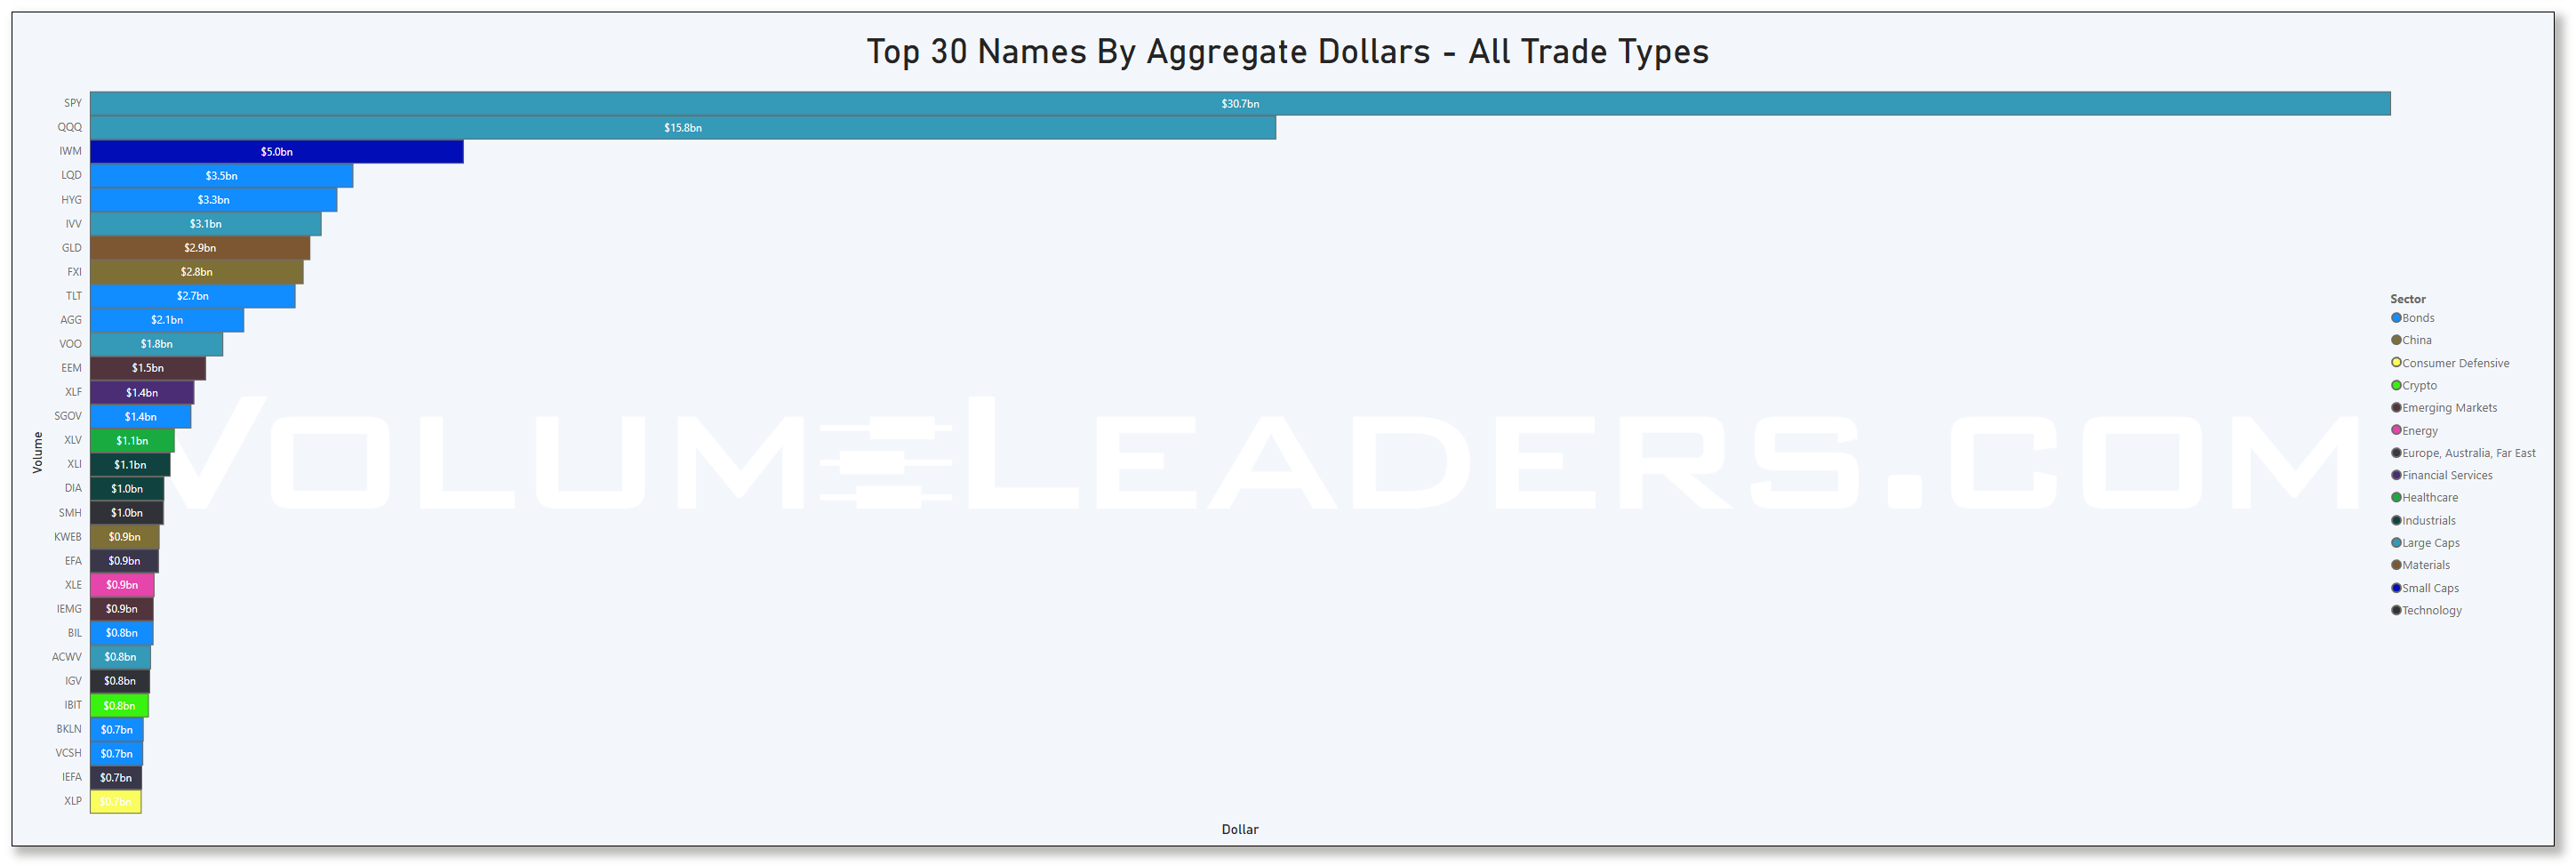
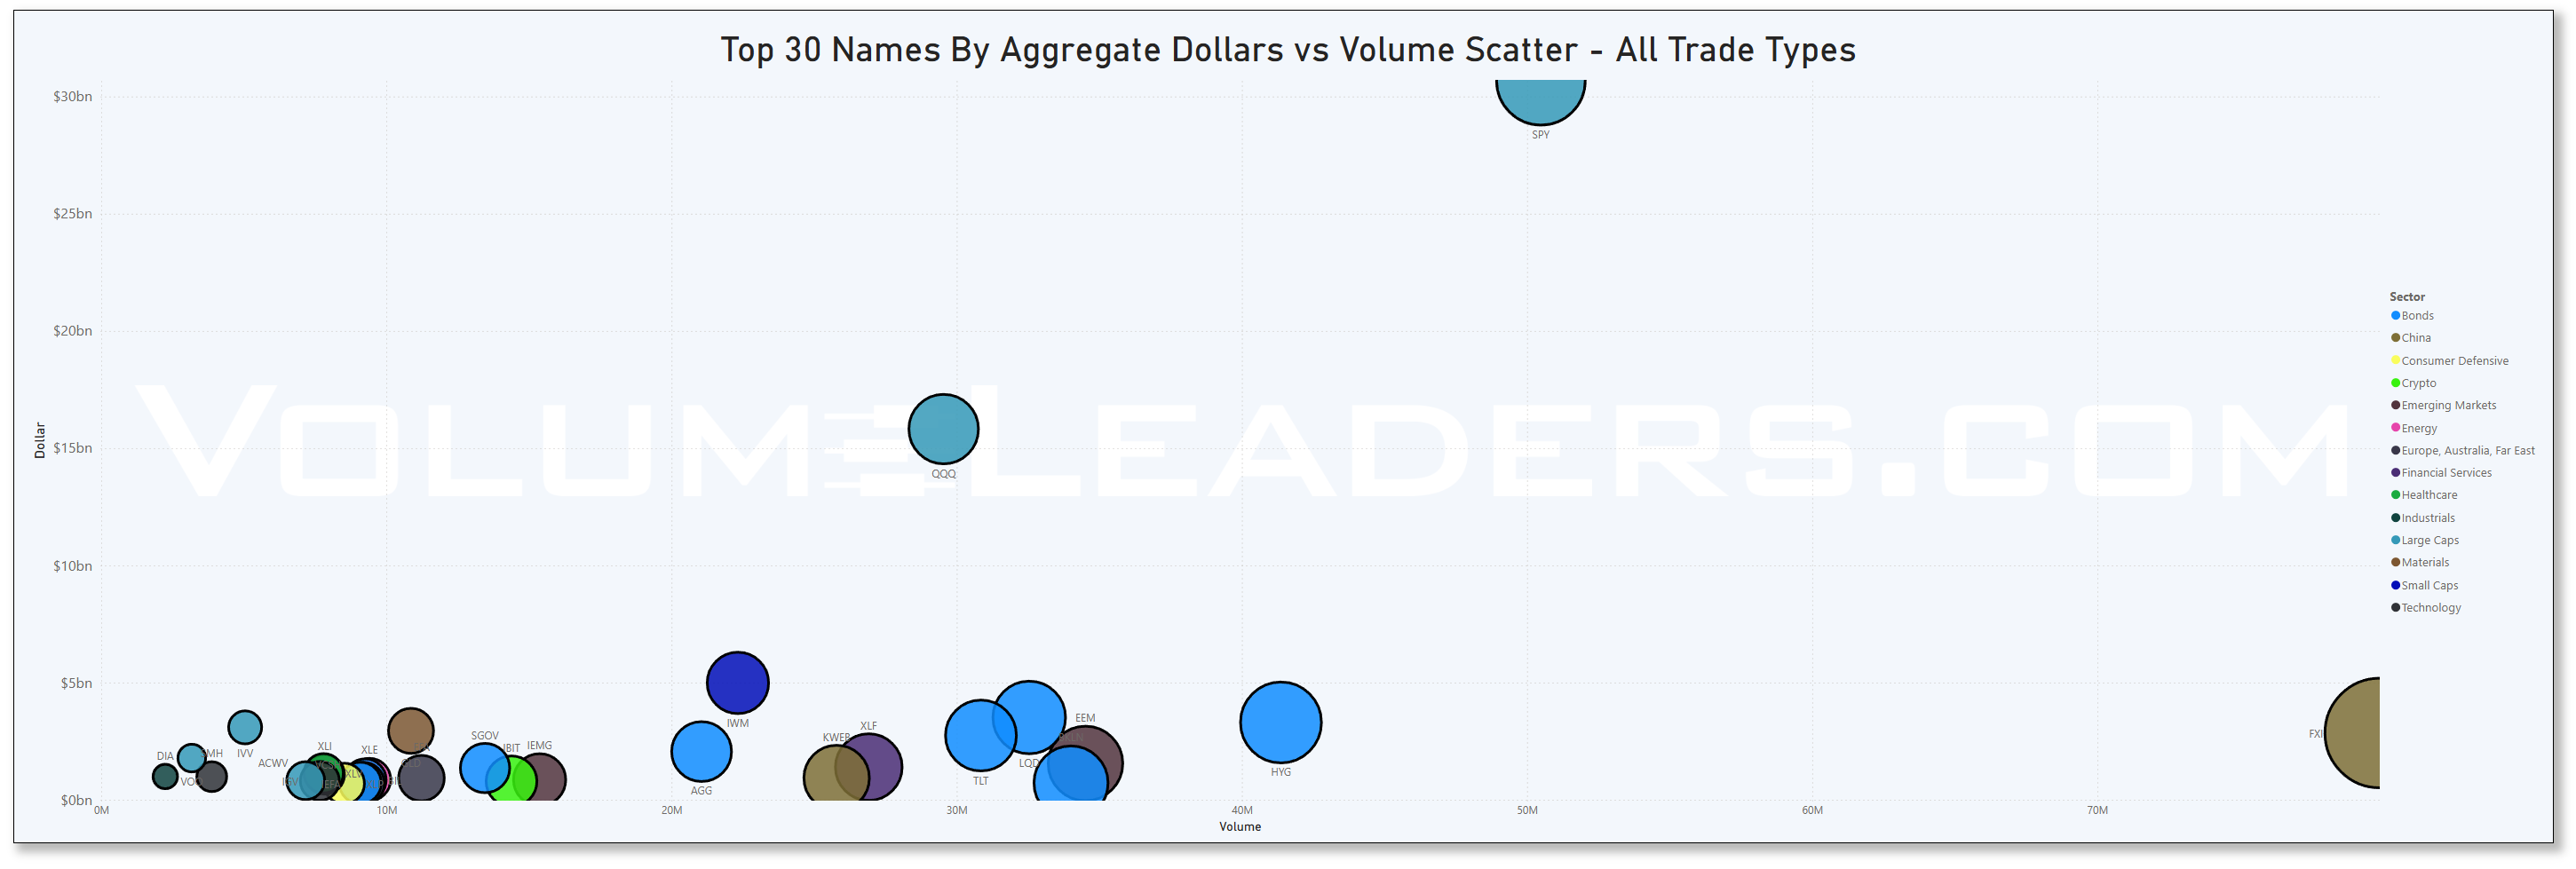
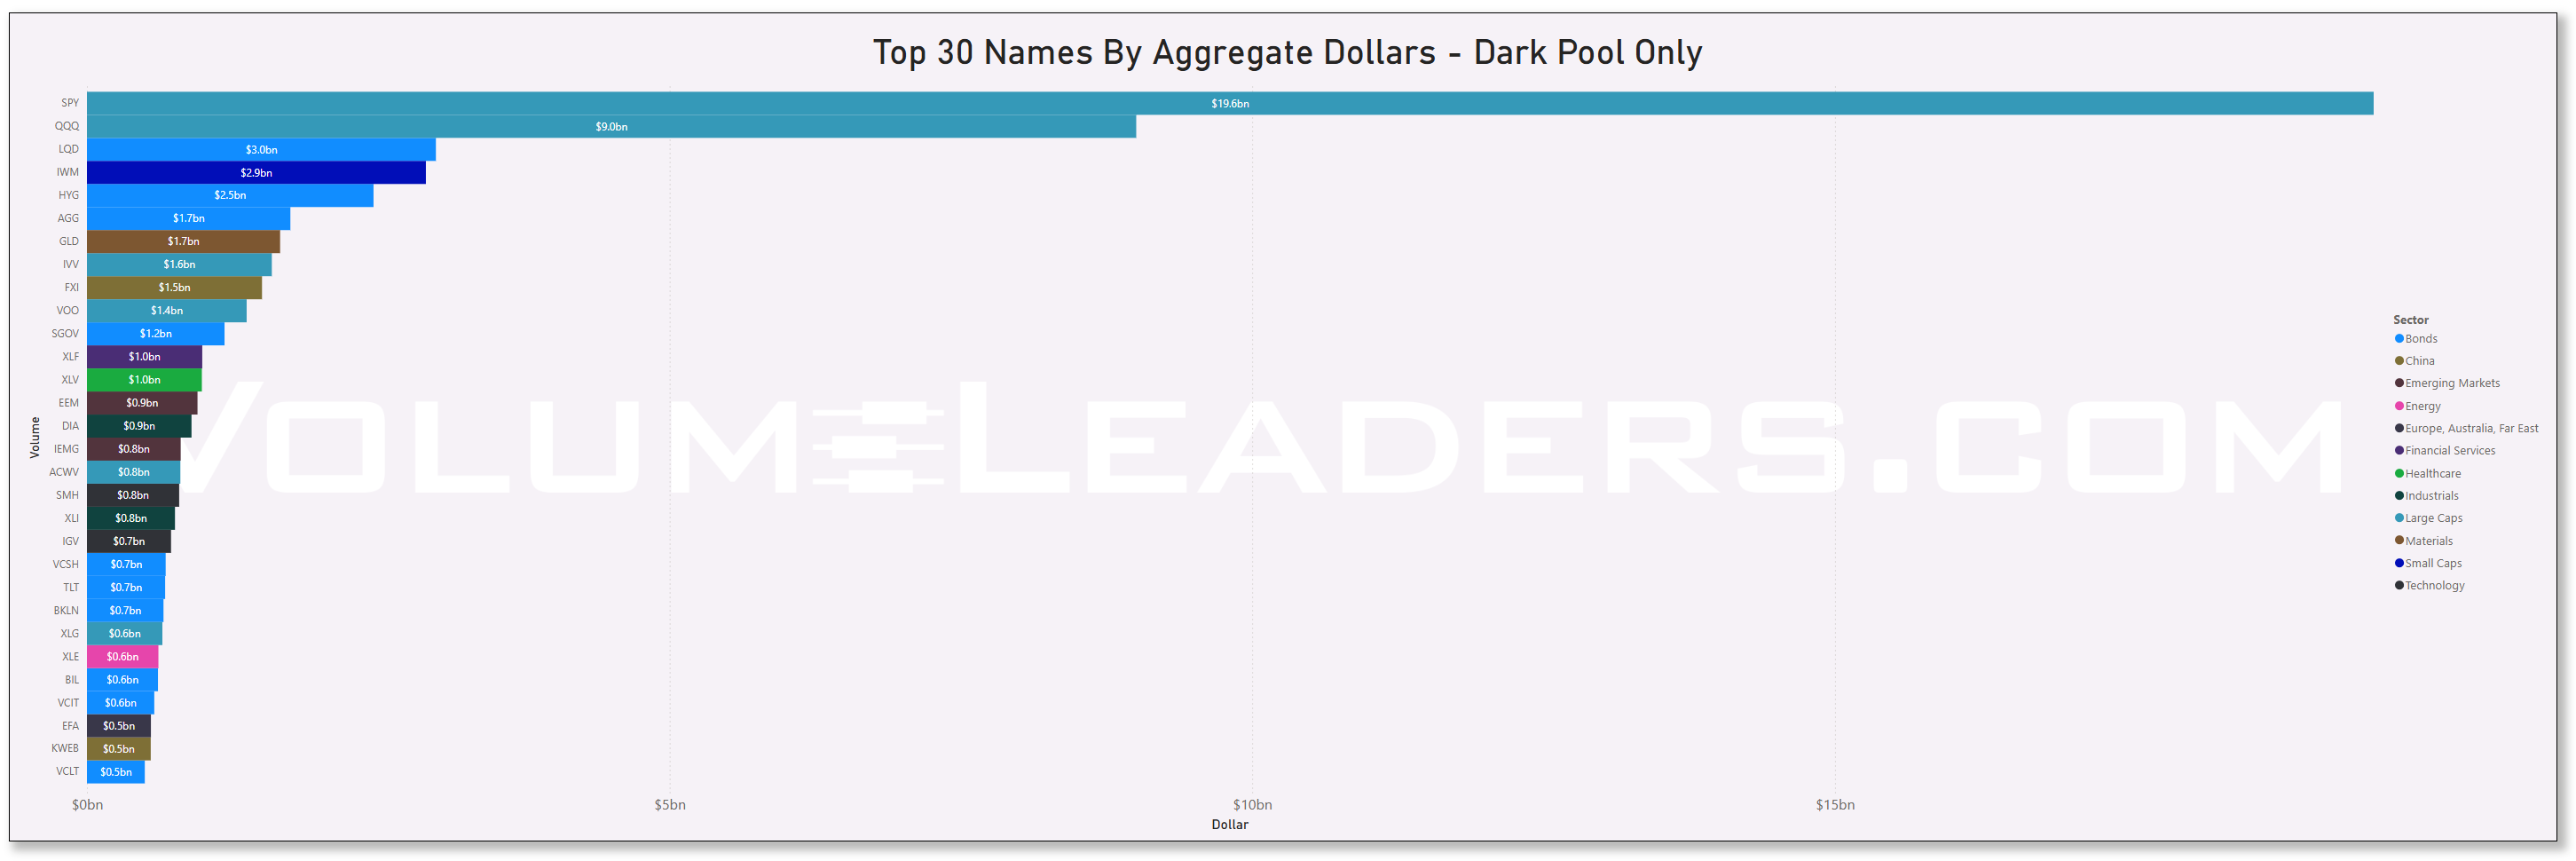
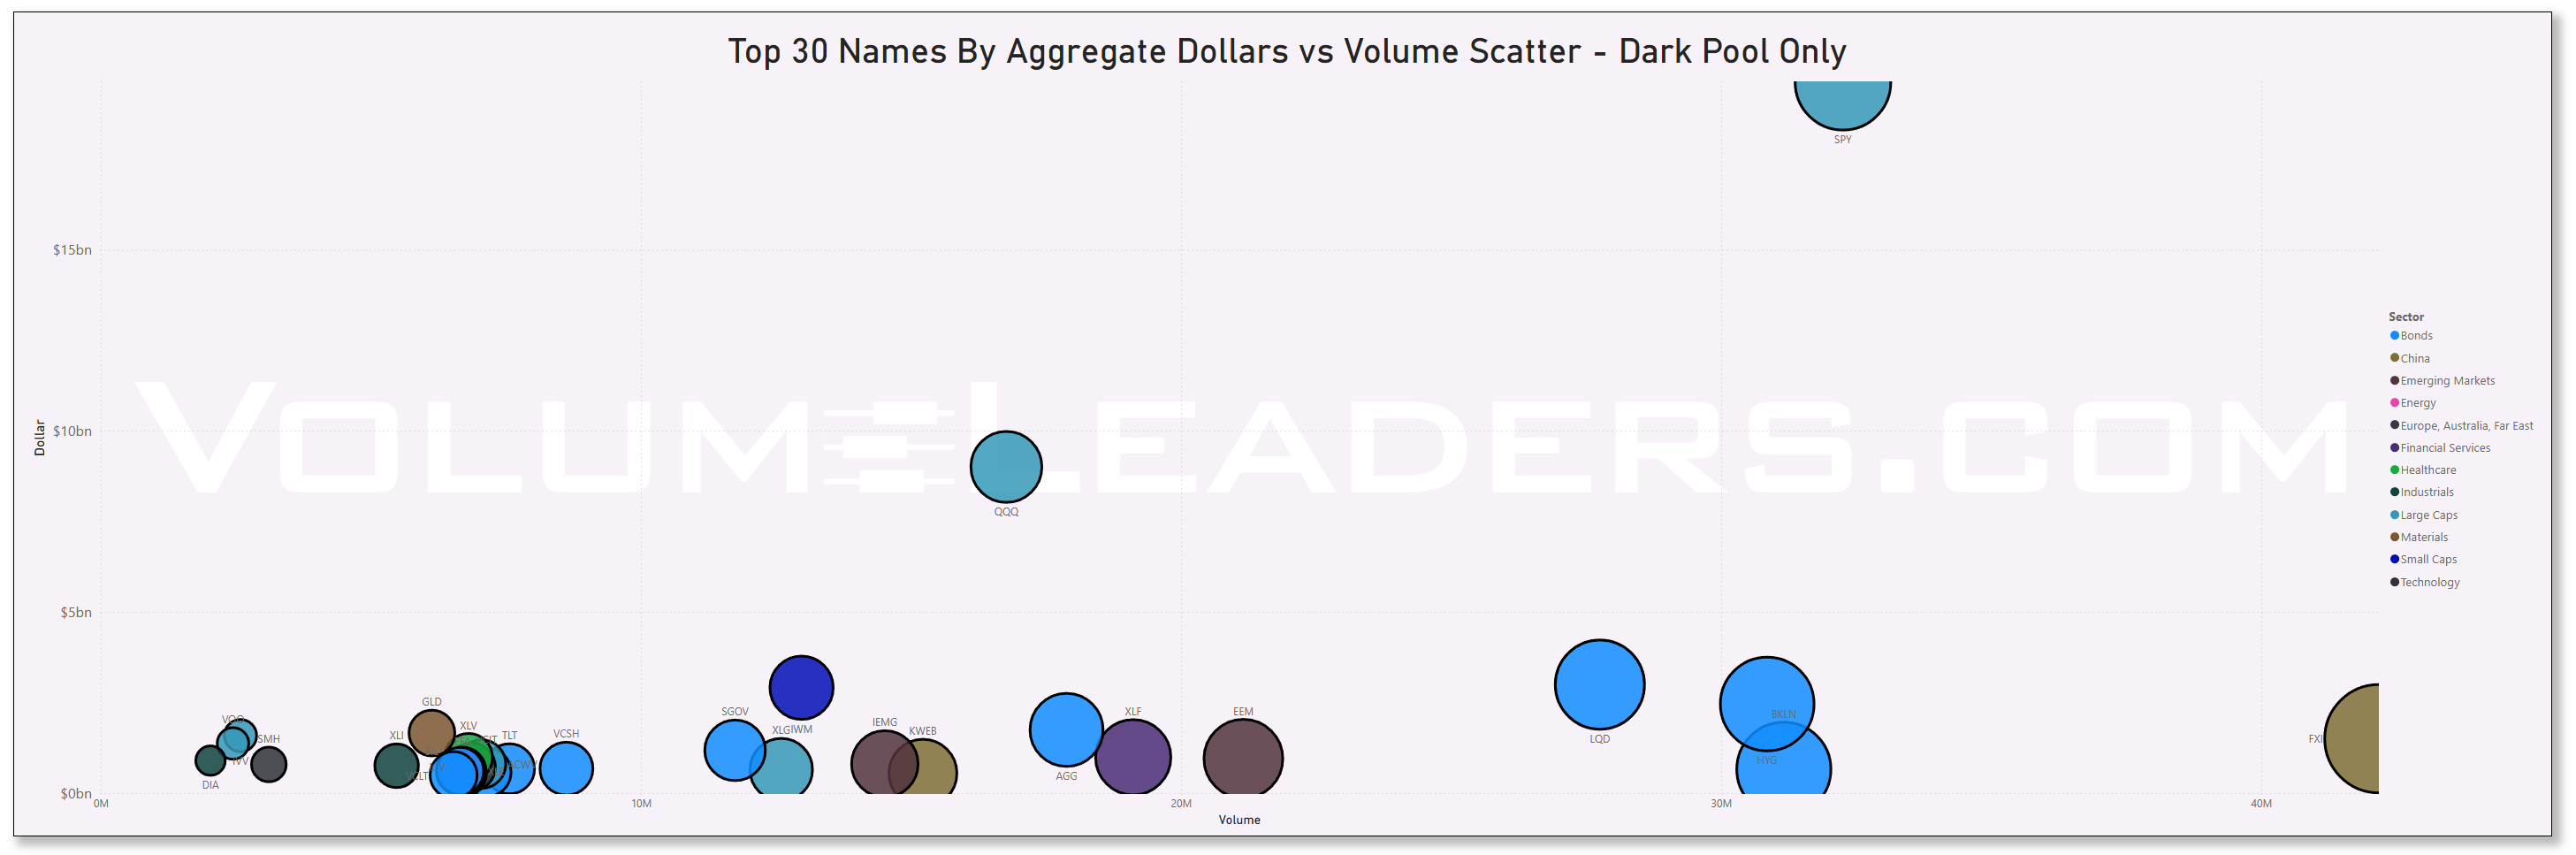
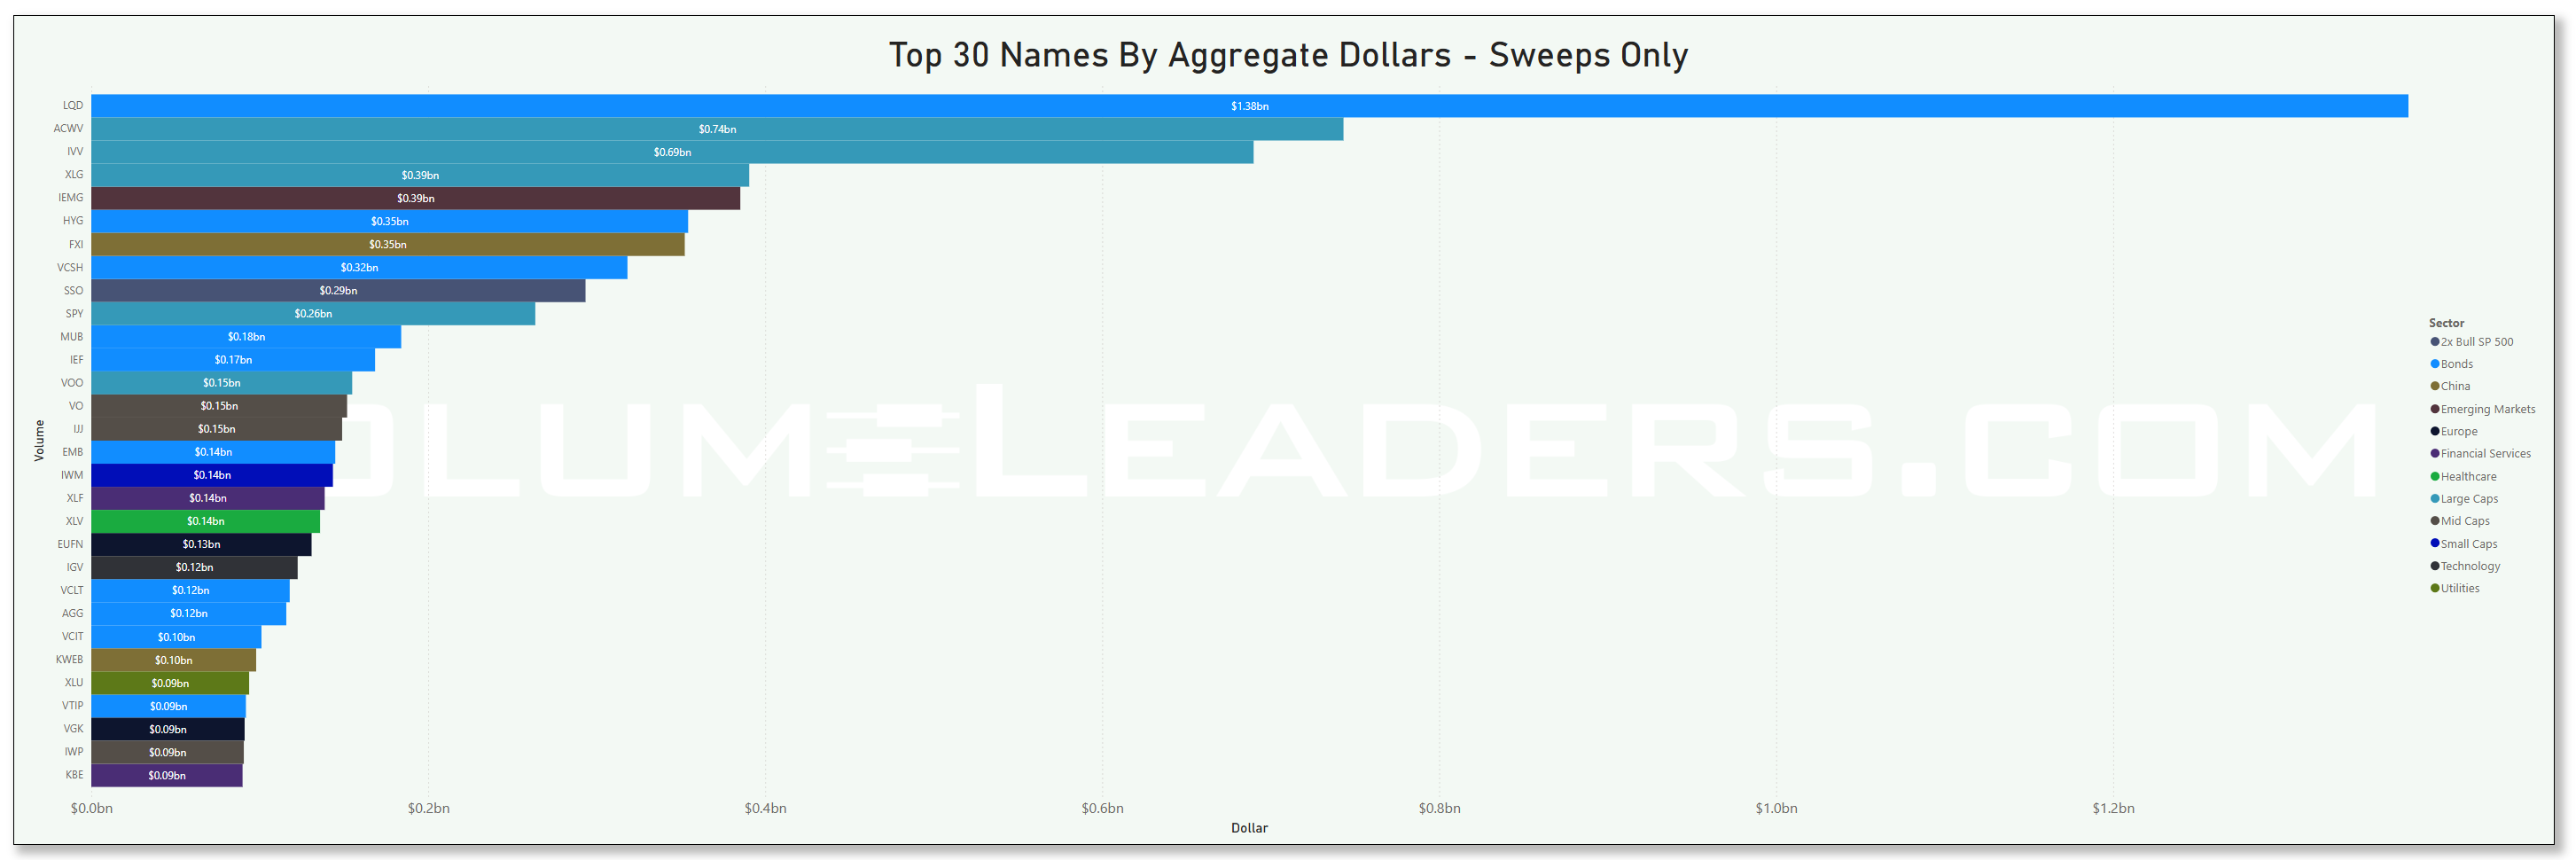
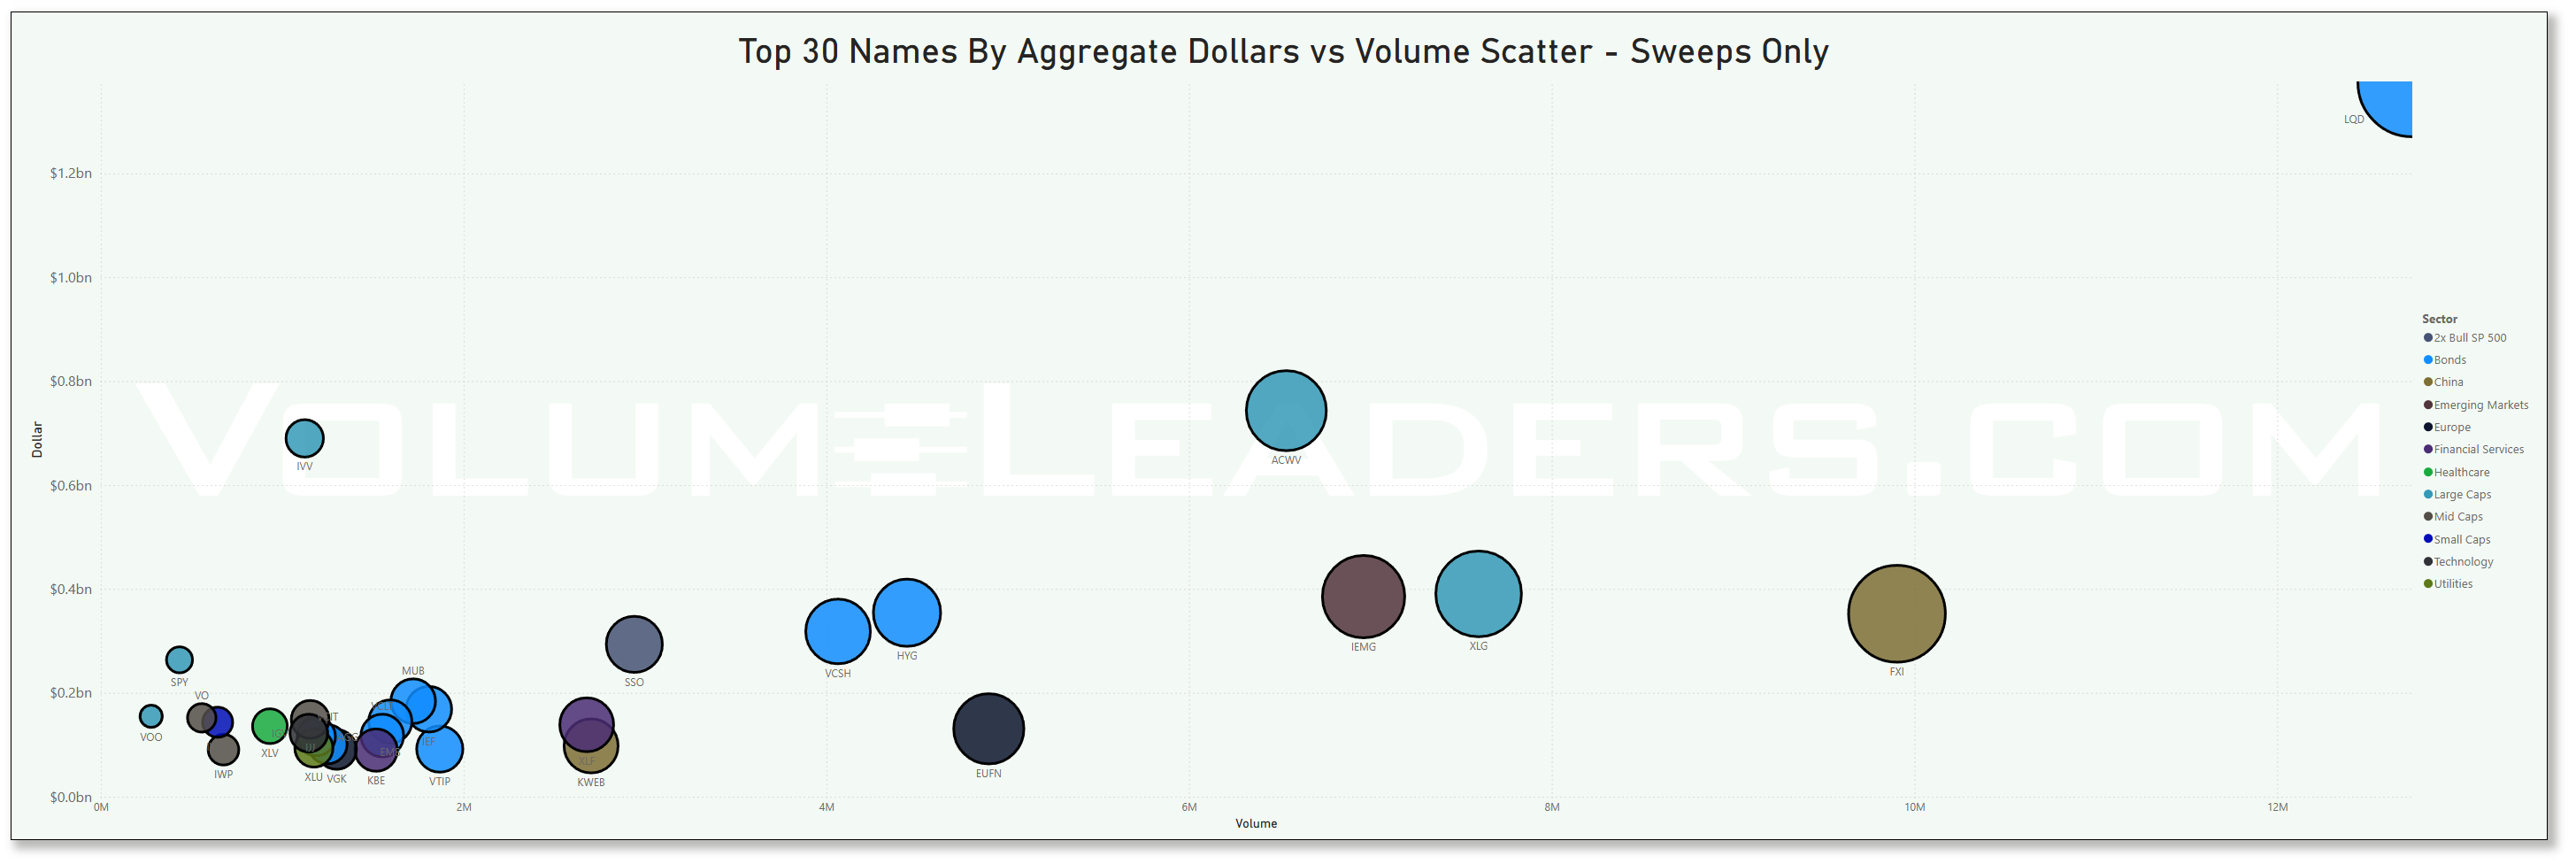
Top Institutional Order Flow In Equities
These are incredibly important charts to watch as they contains lots of nuanced suggestions at a thematic level. Watch these charts closely week-to-week to stay informed about where institutional money is flowing, adjust your strategies based on momentum, align your portfolio with macroeconomic and market trends, and manage risks more effectively by avoiding sectors losing institutional favor.
Sector Rotation Insights: The chart highlights which sectors are attracting institutional activity and which are losing favor. Institutions often lead market trends, so tracking shifts in their focus can indicate sector rotations.
Sentiment Analysis: The level of institutional activity reflects confidence in specific sectors. Rising activity in traditionally defensive sectors (e.g., healthcare, utilities) may indicate caution, while a surge in growth sectors (e.g., technology, consumer discretionary) could suggest optimism.
Emerging Trends: Sudden spikes in a previously overlooked sector, like industrials or consumer staples, might hint at emerging opportunities or structural shifts.
Macro Themes: Changes in sector activity often align with broader macroeconomic themes like inflation, interest rates, or geopolitical events. For instance:
Increased activity in energy might indicate concerns about oil supply or rising prices.
Growth in technology could align with innovations or favorable policies.
Risk Management: Declining institutional activity in a sector might signal weakening fundamentals or heightened risks.
Spotting Overcrowding: Excessive activity in a single sector over multiple weeks may suggest overcrowding, which could lead to heightened volatility if institutions begin to exit.
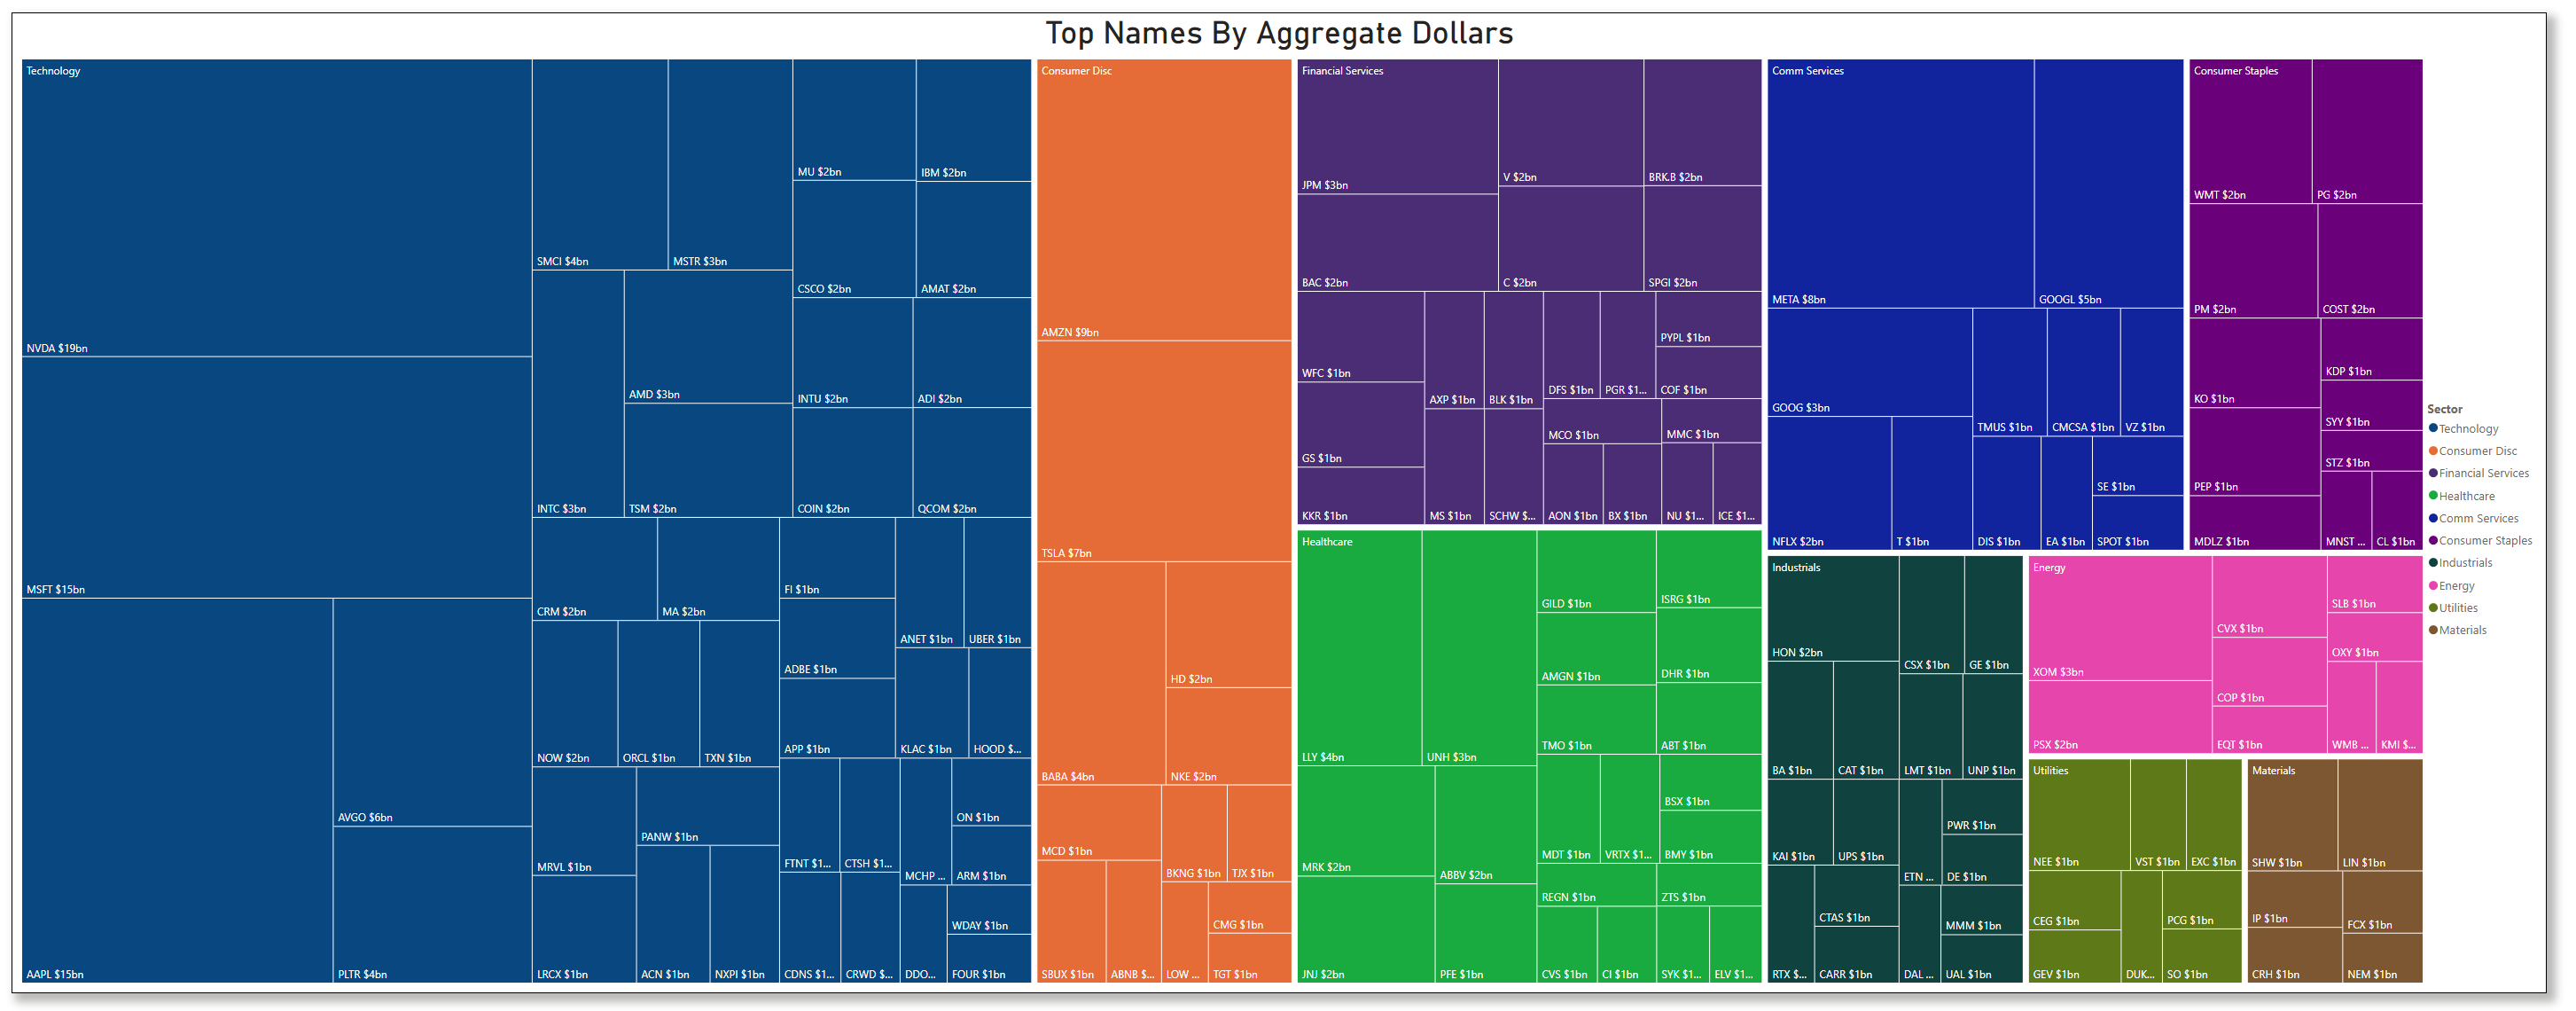
Many excellent trade ideas and sources of inspiration can be found in these prints below. While only the top 30 from each group are displayed, the complete results are accessible in VolumeLeaders.com for you to explore at your convenience any time. Remember to configure trade alerts within the platform to ensure institutional order flows that capture your interest or are significant to you aren’t missed. The blue charts encompass all types of trades, including blocks on lit exchanges; the purple charts exclusively depict dark pool trades; and the green charts represent sweeps only.
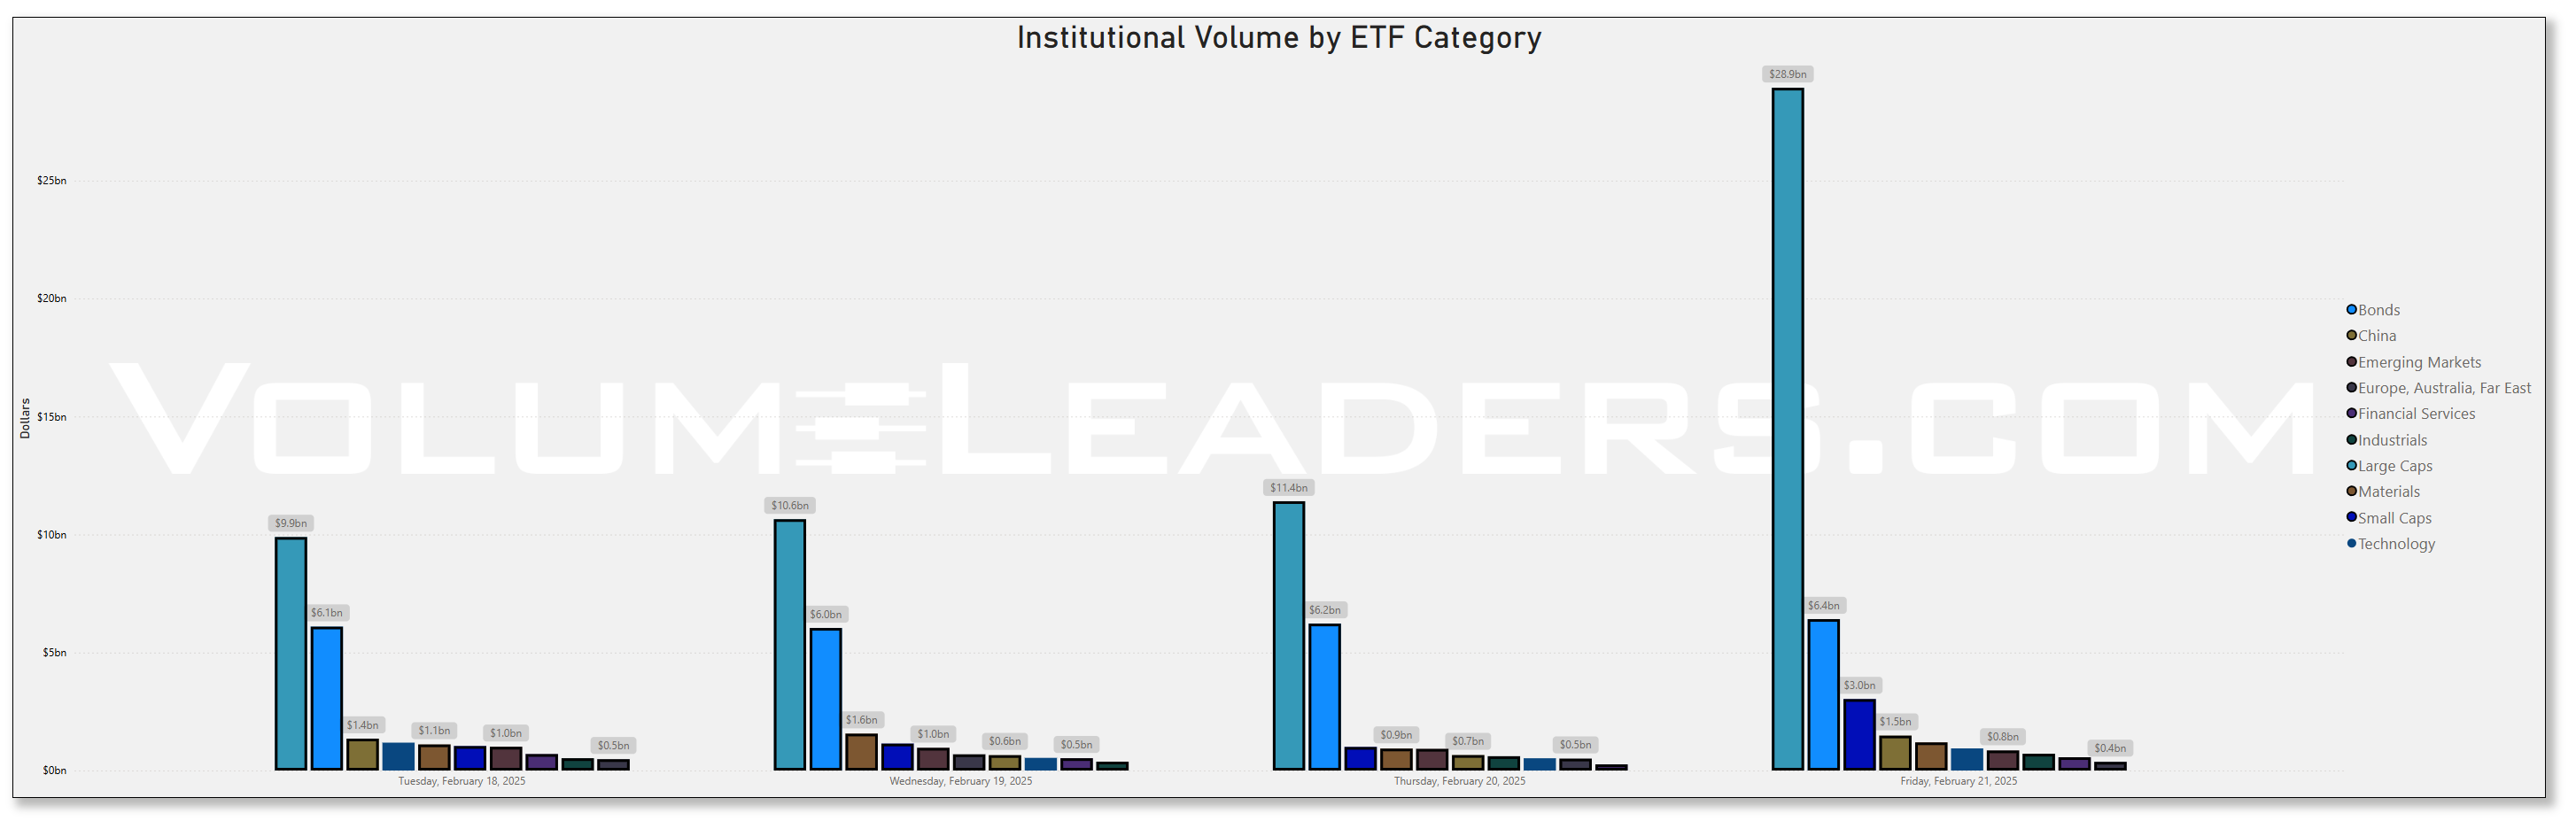
Top Institutional Order Flow In ETFs
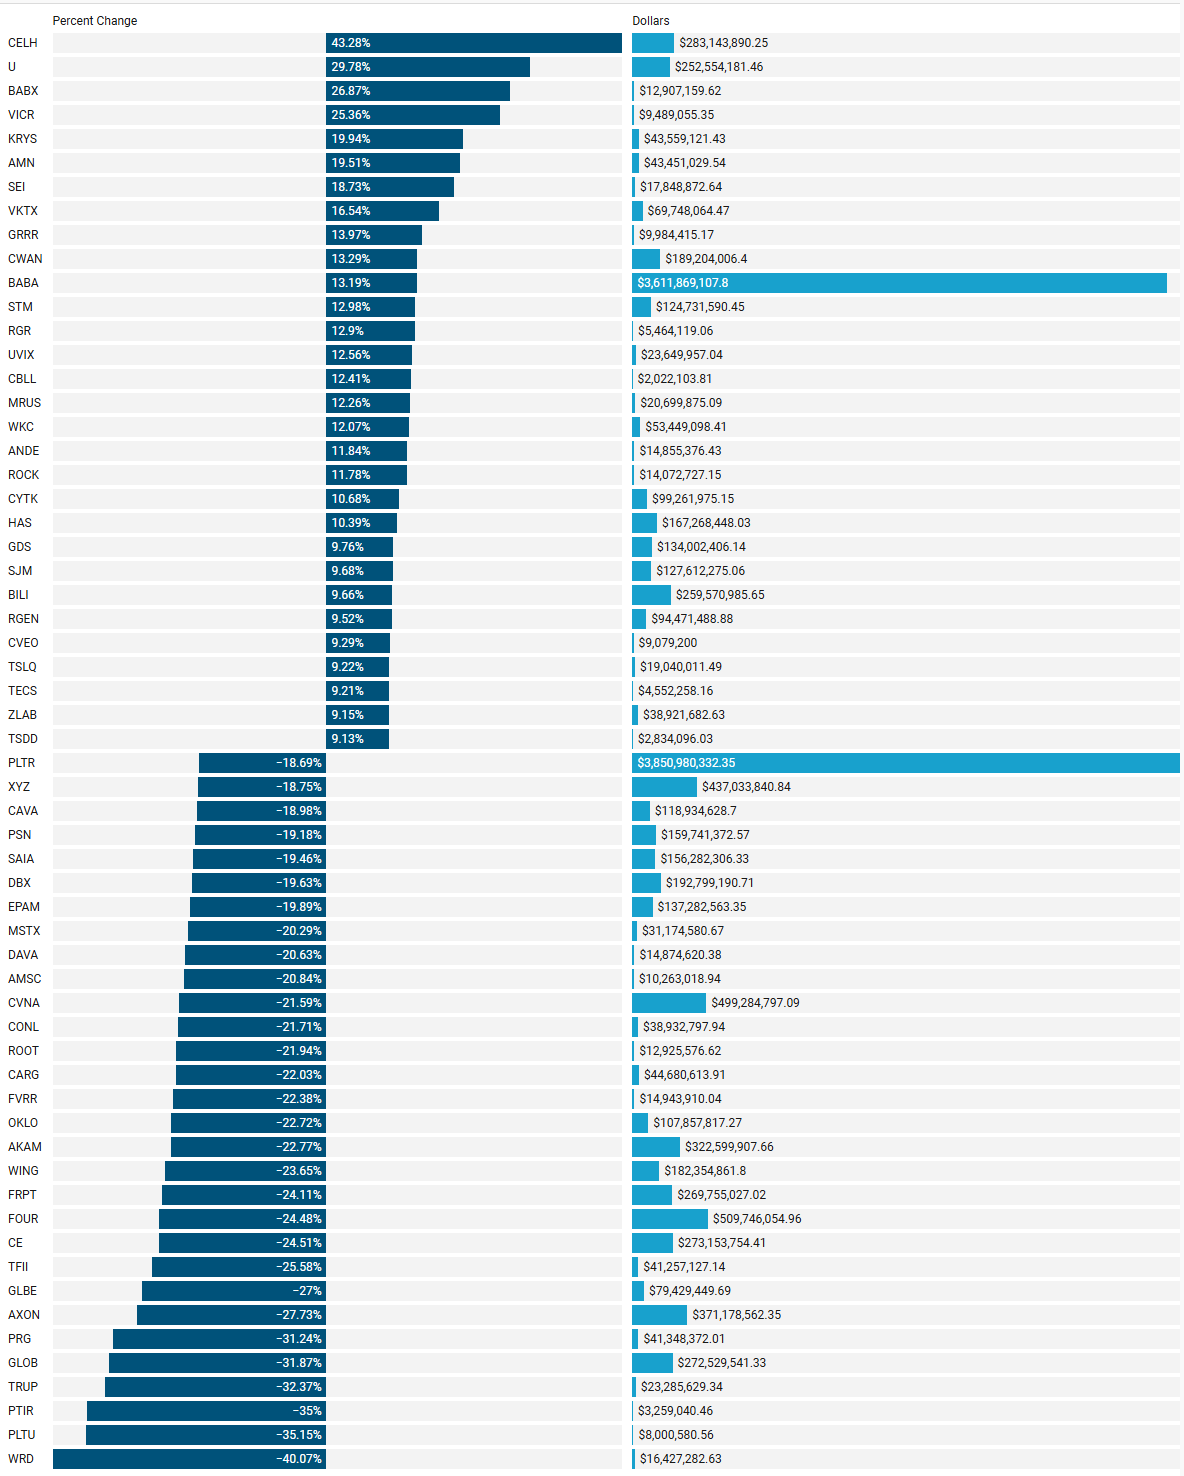
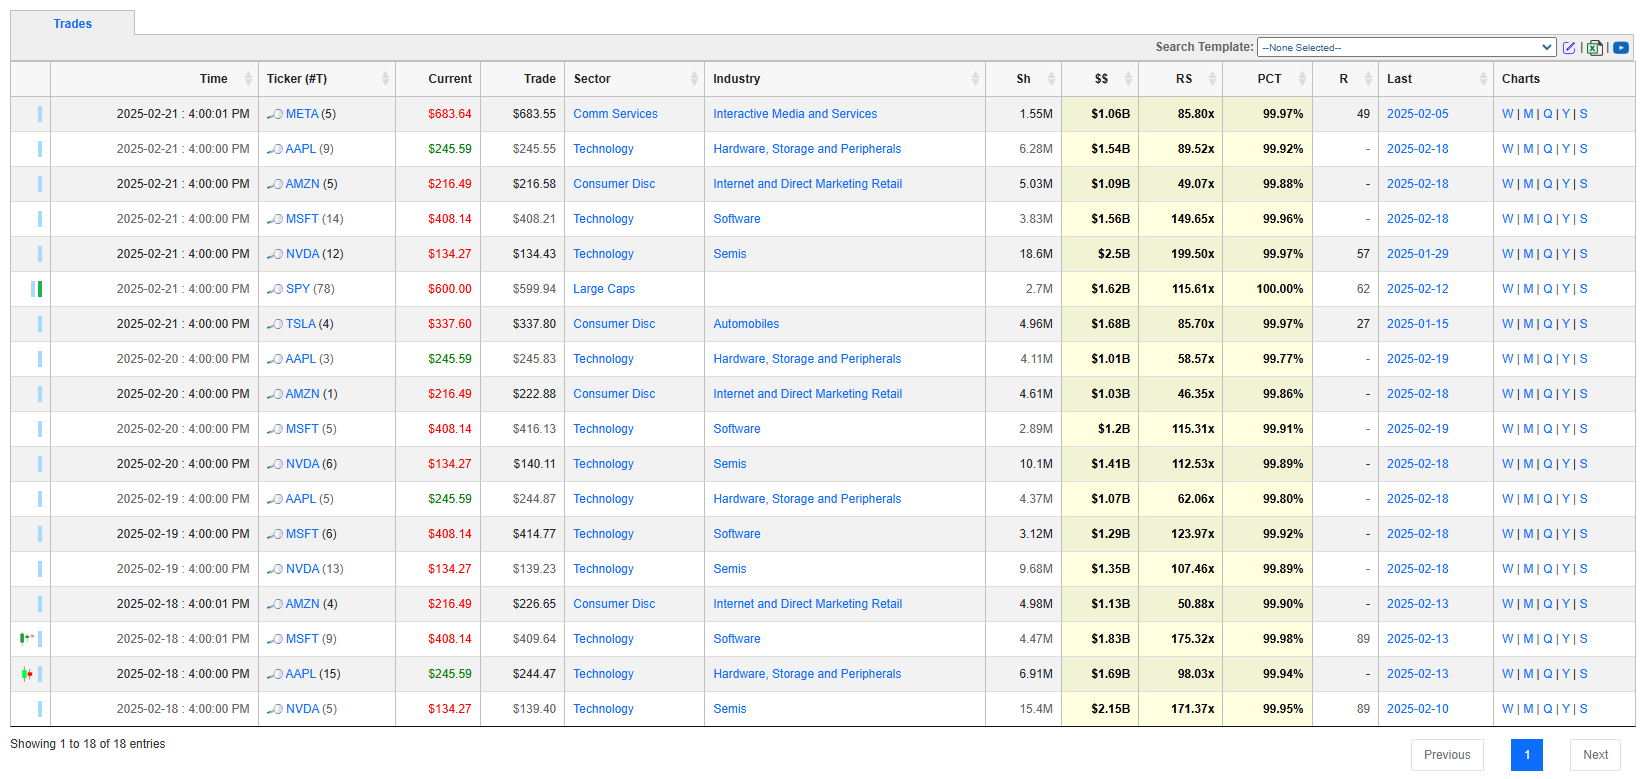
Last Week’s Institutionally-Backed Gainers & Losers
If you’re going to bet on a name, consider one that is officially endorsed by an institution! These are the top percent gainers (green) and percent losers (red) from this week’s open-to-close that had a trade price greater than $20 and institutional involvement. Continue watching tickers from this and prior stacks as these names frequently turn into multi-leg trades with a lot of movement!
Last Week’s Billion-Dollar Prints
Tickers that printed a trade worth at least $1B last week get a special shout-out… Welcome to the club. These are massive commitments by institutions that should not be ignored.
Investments In Focus: Bull vs Bear Arguments
Institutions leave footprints that VolumeLeaders.com can illustrate for you while providing context to assess things like institutional conviction and urgency. Theses and data given below are not financial advice, just personal observations that may be wrong; consult a certified financial advisor before making any investment decisions.
BEKE 0.00%↑
KE Holdings Inc. (NYSE: BEKE) is a leading integrated real estate platform in China, operating under the "Beike" brand. The company offers a comprehensive suite of services, including existing and new home transactions, home renovation, furnishing, and financial services.
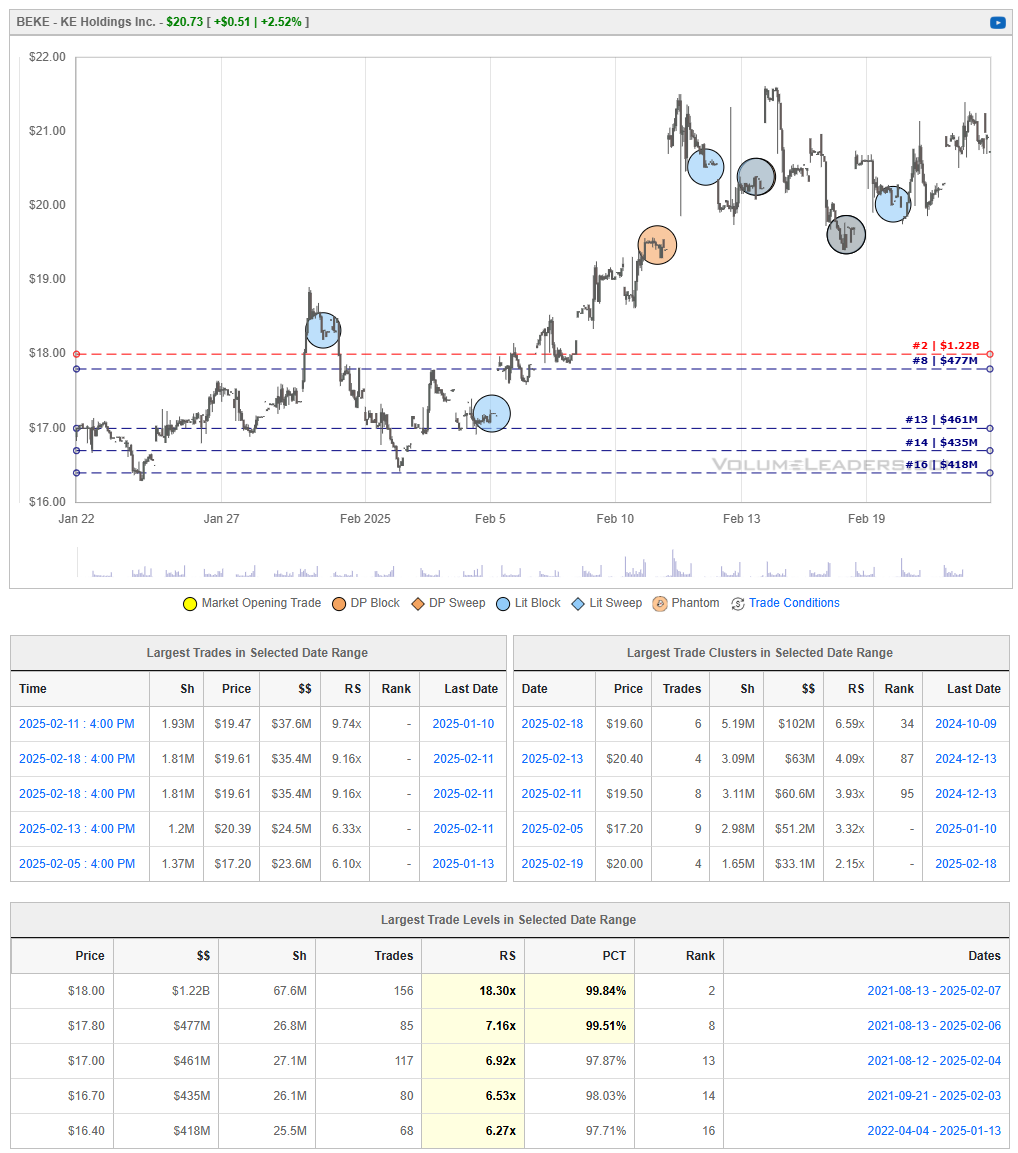
Recent Financial Performance:
Stock Performance: As of February 22, 2025, BEKE's stock is trading at $20.90, reflecting a 3.34% increase from the previous close. The stock has experienced a 52-week range between $12.44 and $26.05.
Analyst Ratings: The average one-year price target among 17 analysts is $25.33, suggesting a potential upside of approximately 21.2% from the current price. The consensus recommendation is "Outperform."
Bullish Perspective:
Market Leadership: KE Holdings maintains a dominant position in China's real estate market, leveraging its extensive data-driven platform to connect buyers, sellers, and service providers efficiently.
Diversified Services: Beyond property transactions, the company's expansion into home renovation and furnishing services offers additional revenue streams and enhances customer engagement.
Share Repurchase Program: The announcement of an upsized and extended share repurchase program in August 2024 indicates confidence in the company's financial health and commitment to enhancing shareholder value.
Bearish Perspective:
Regulatory Environment: China's real estate sector faces stringent regulatory oversight, which could impact KE Holdings' operations and profitability.
Market Volatility: The Chinese property market has experienced fluctuations, and any downturn could adversely affect transaction volumes and the company's financial performance.
Competition: The emergence of new entrants and alternative platforms in the real estate market may intensify competition, potentially affecting KE Holdings' market share.
In summary, KE Holdings Inc. stands out as a prominent player in China's real estate industry, bolstered by its comprehensive service offerings and strategic initiatives. While opportunities for growth are evident, potential investors should carefully consider regulatory challenges and market dynamics when evaluating the company's prospects.
DELL 0.00%↑
Dell Technologies Inc. (NYSE: DELL) is a prominent global provider of information technology solutions, offering a wide range of products and services, including hardware, software, and IT infrastructure.
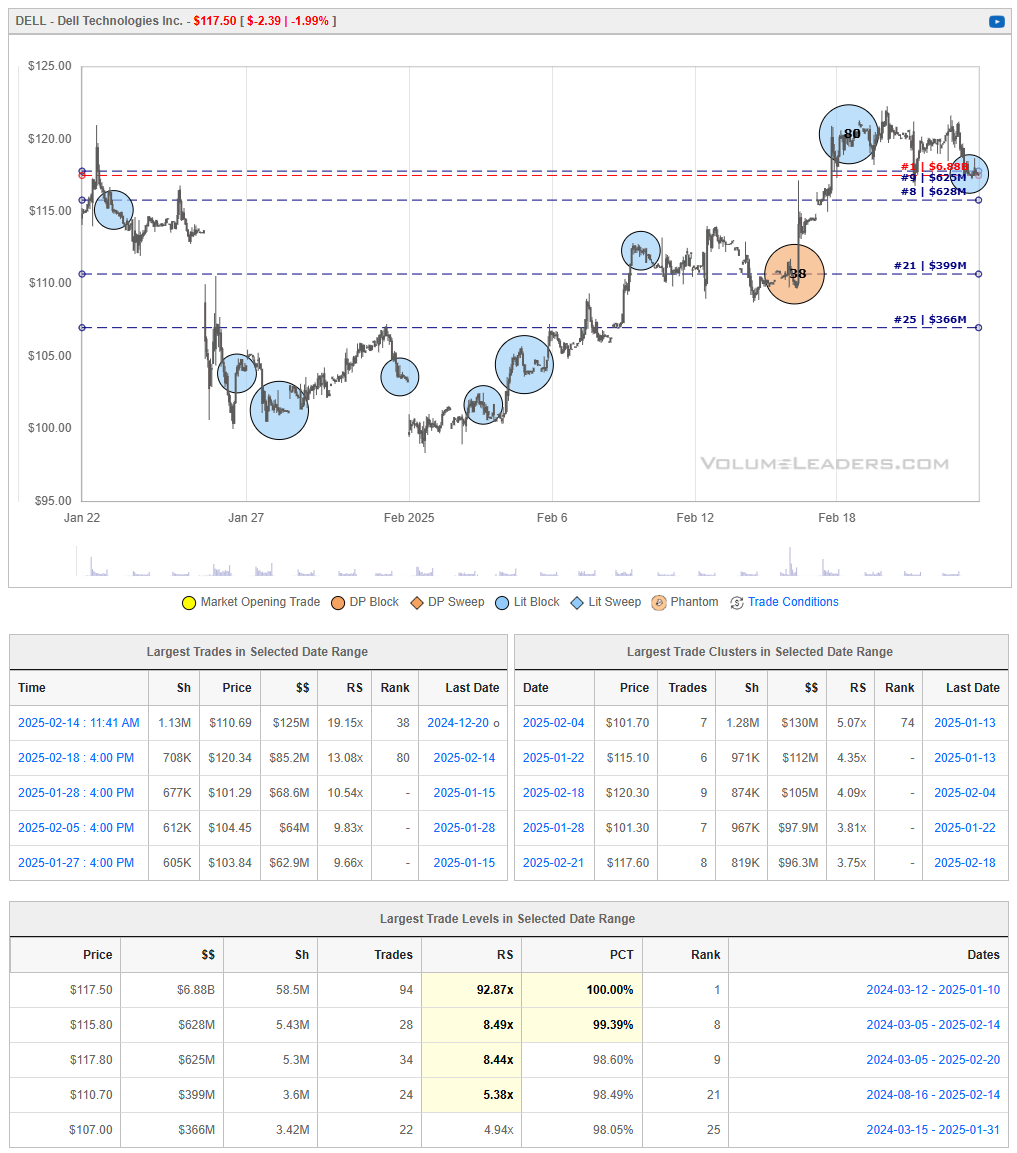
Recent Developments:
Earnings Announcement: Dell is scheduled to release its fourth-quarter fiscal 2025 financial results on February 27, 2025, at 3:30 p.m. CST.
AI Initiatives: The company is reportedly nearing a $5 billion deal to supply AI servers to xAI, Elon Musk's artificial intelligence venture.
Analyst Adjustments: Citigroup has recently adjusted Dell's price target to $145 from $156, reflecting considerations of market conditions and company performance.
Bullish Perspective:
Strategic AI Investments: Dell's potential $5 billion AI server deal with xAI positions the company to capitalize on the growing demand for AI infrastructure, potentially leading to significant revenue growth.
Earnings Growth: Analysts anticipate a year-over-year increase in earnings for the quarter ended January 2025, driven by higher revenues.
S&P 500 Inclusion: Dell's relisting on the S&P 500 Index in September 2024 enhances its visibility among investors and may attract additional institutional investment.
Bearish Perspective:
Market Volatility: The technology sector is subject to rapid changes and competition, which could impact Dell's market share and profitability.
Operational Changes: The company's recent decision to end hybrid work and require employees to return to the office full-time may affect employee morale and retention.
Analyst Caution: The downward adjustment of Dell's price target by Citigroup suggests potential concerns about future performance.
In summary, Dell Technologies demonstrates strategic initiatives in AI and anticipates positive earnings growth, bolstered by its inclusion in the S&P 500. However, potential investors should consider market volatility, internal operational changes, and cautious analyst outlooks when evaluating the company's stock.
SCHW 0.00%↑
The Charles Schwab Corporation (NYSE: SCHW) is a leading financial services firm offering a wide range of investment, banking, and advisory services.
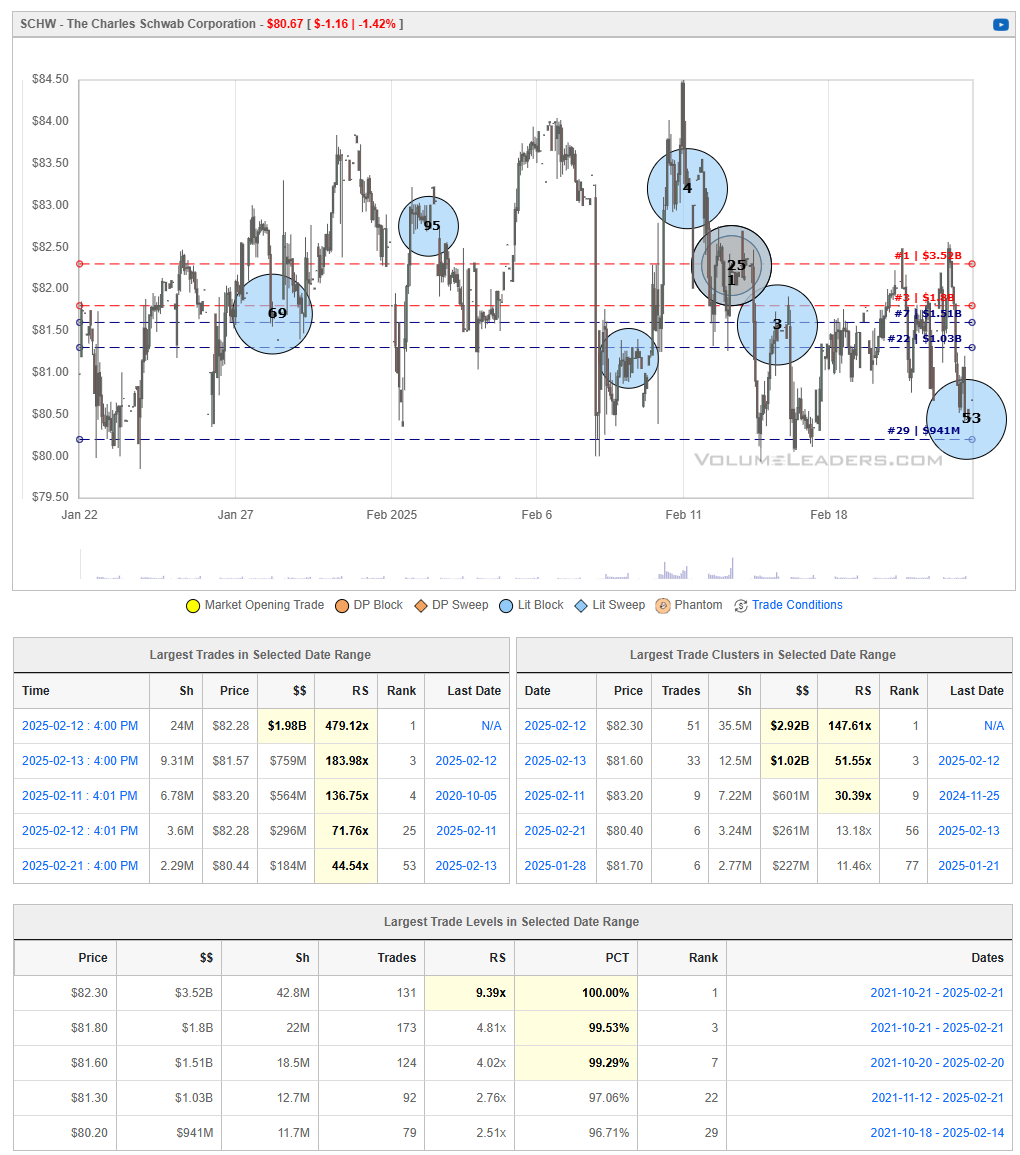
Recent Developments:
Leadership Transition: CEO Walt Bettinger announced his retirement effective December 31, 2024, after 16 years at the helm. Rick Wurster, the company's president since 2021, has assumed the role of CEO as of January 1, 2025. Under Bettinger's leadership, Schwab's client assets grew from $1.14 trillion to $9.74 trillion.
Digital Assets Expansion: Schwab appointed Joe Vietri as the new head of digital assets to develop the company's cryptocurrency strategy. This move aims to expand Schwab's offerings in the digital asset space, including potential products like spot cryptocurrency trading, pending regulatory developments.
Institutional Investments: Recent filings indicate increased interest from institutional investors. For instance, Paradigm Asset Management Co. LLC raised its position in Schwab by 217% in the fourth quarter, now holding 48,350 shares valued at approximately $3.58 million.
Bullish Perspective:
Strong Financial Growth: Schwab has demonstrated robust financial performance, with significant increases in client assets and account numbers over the past decade.
Strategic Leadership: The transition to Rick Wurster as CEO is expected to provide continuity and strategic focus, potentially leading to further growth and innovation.
Expansion into Digital Assets: By appointing a head of digital assets, Schwab is positioning itself to capitalize on the growing interest and adoption of cryptocurrencies, potentially attracting a new segment of investors.
Bearish Perspective:
Market Volatility: The financial services industry is susceptible to market fluctuations, which can impact trading volumes and asset valuations, potentially affecting Schwab's revenue.
Regulatory Challenges: Expansion into digital assets may expose Schwab to increased regulatory scrutiny, which could impact the rollout of new products and services.
Leadership Changes: While leadership transitions can bring fresh perspectives, they may also introduce uncertainty. The retirement of a long-standing CEO could lead to strategic shifts that may not align with all stakeholders' expectations.
In summary, The Charles Schwab Corporation continues to exhibit strong financial health and strategic initiatives aimed at growth and innovation. Potential investors should weigh the company's expansion efforts and leadership changes against the inherent risks associated with market volatility and regulatory environments.
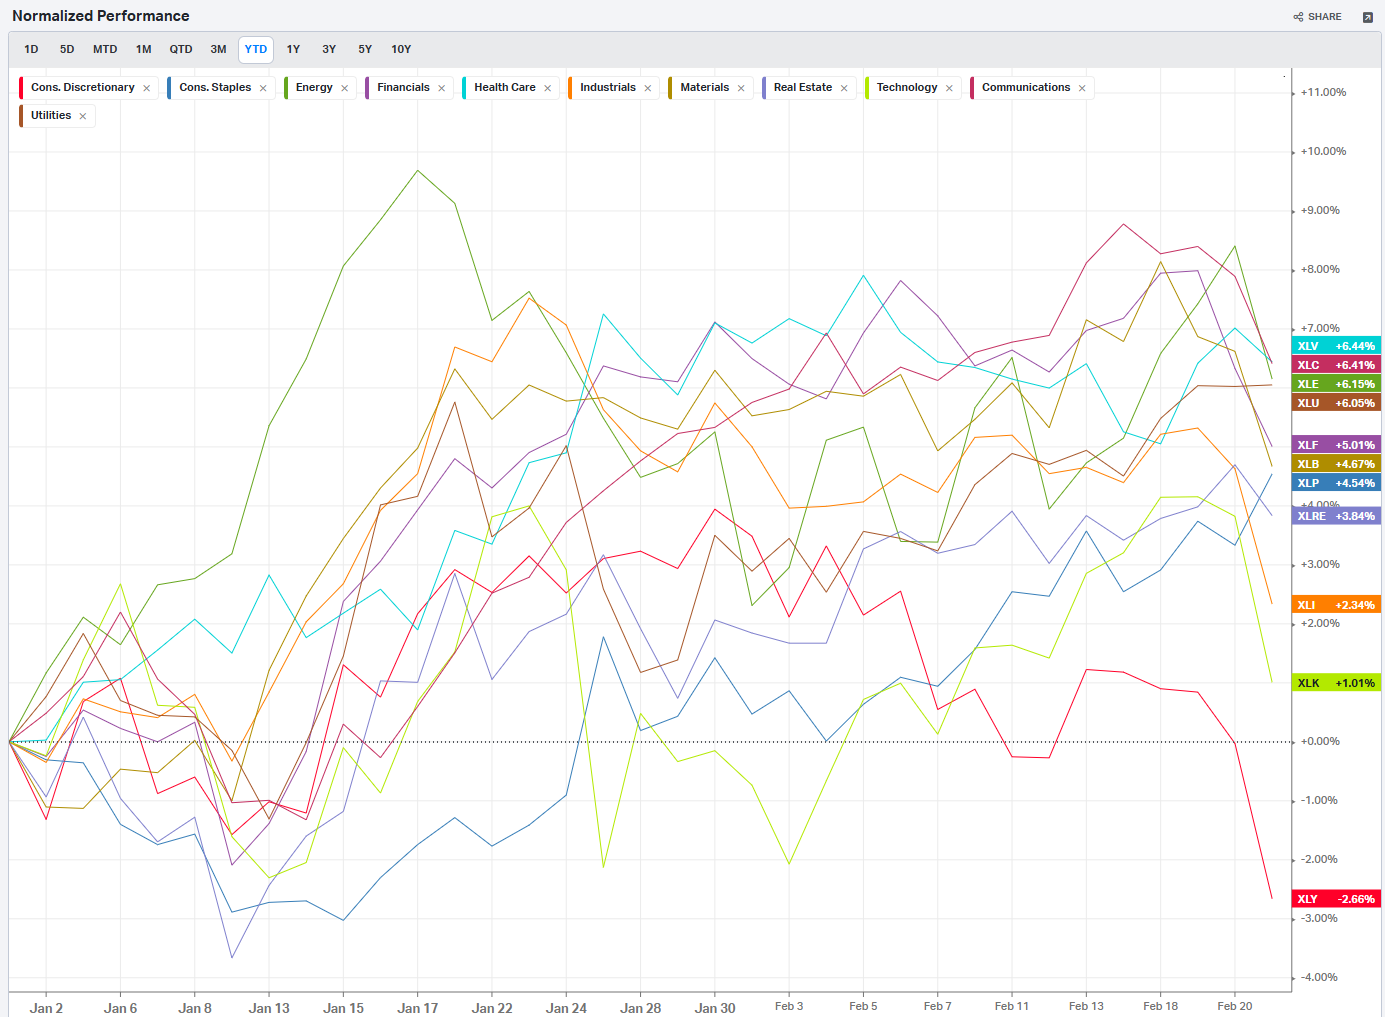
Summary Of Thematic Performance YTD
VolumeLeaders.com provides a lot of pre-built filters for thematics so that you can quickly dive into specific areas of the market. These performance overviews are provided here only for inspiration. Consider targeting leaders and/or laggards in the best and worst sectors, for example.
S&P By Sector
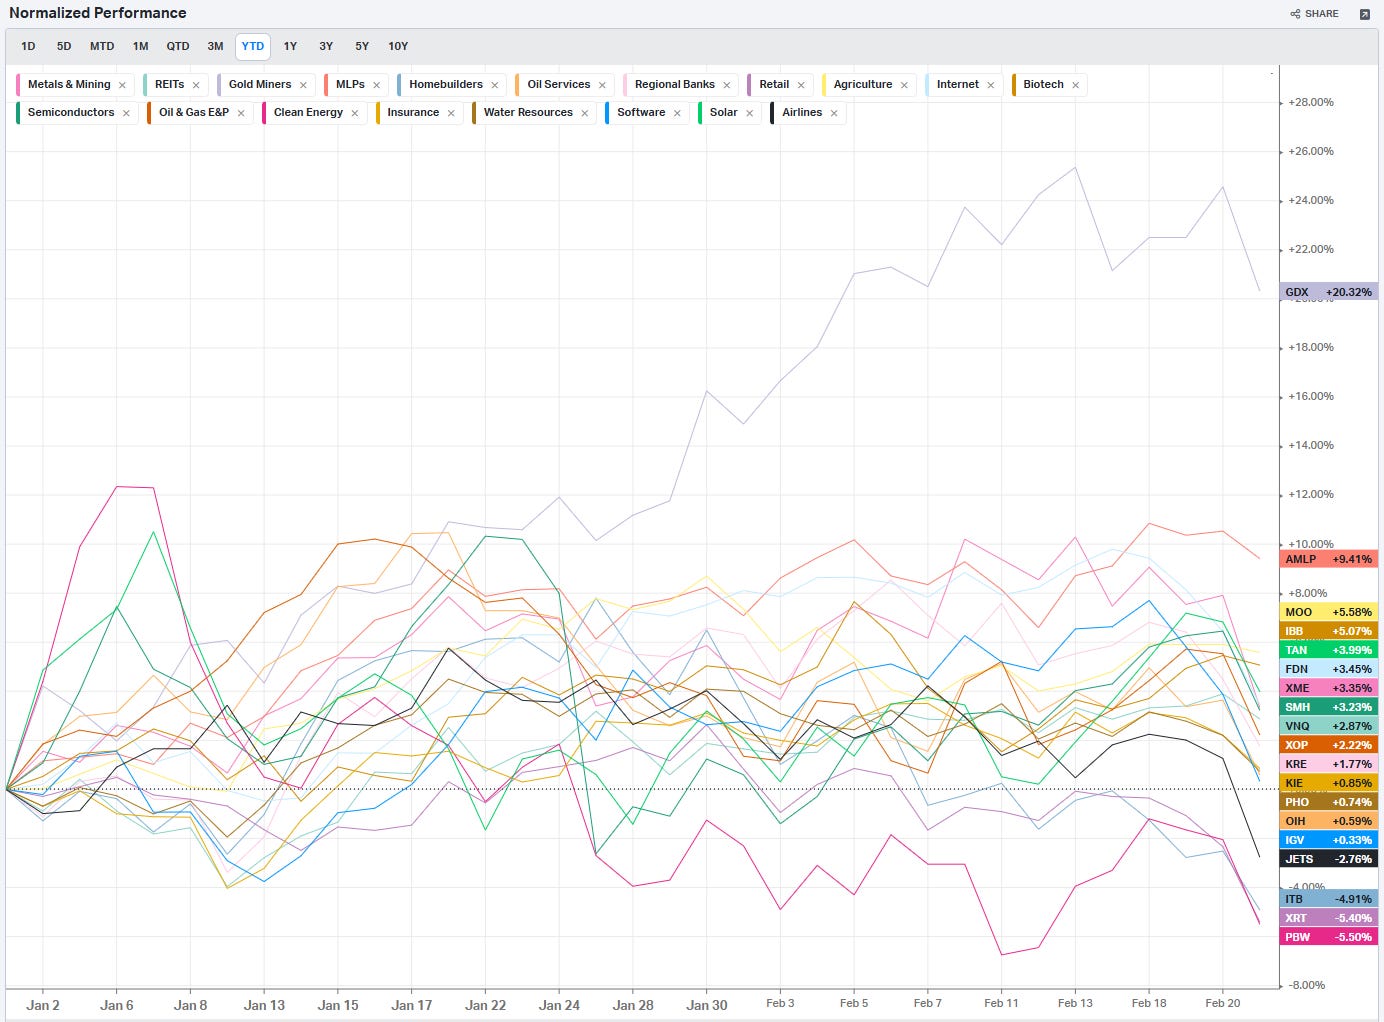
S&P By Industry
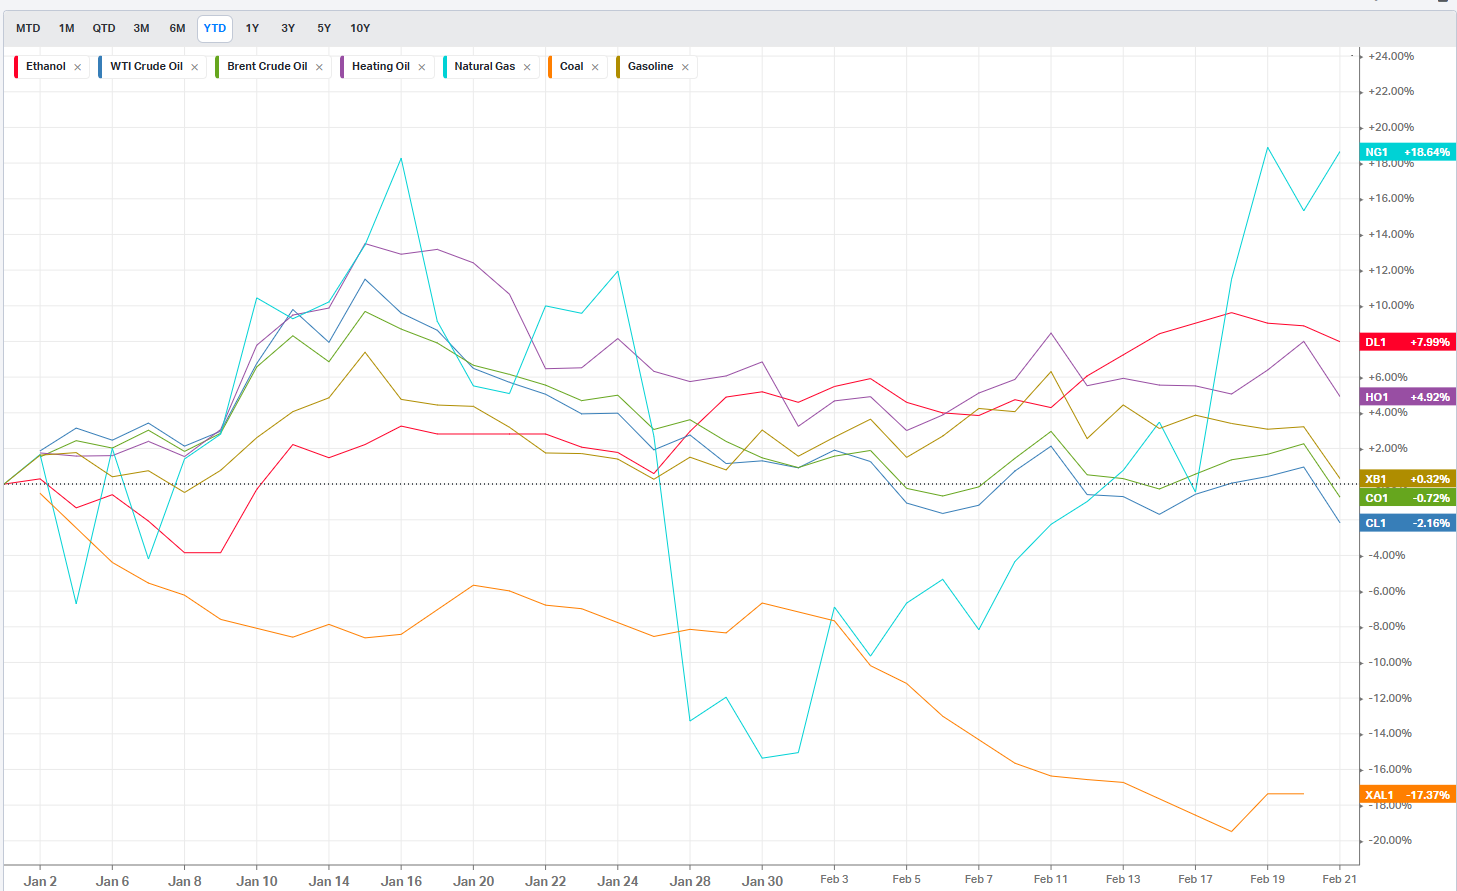
Commodities: Energy
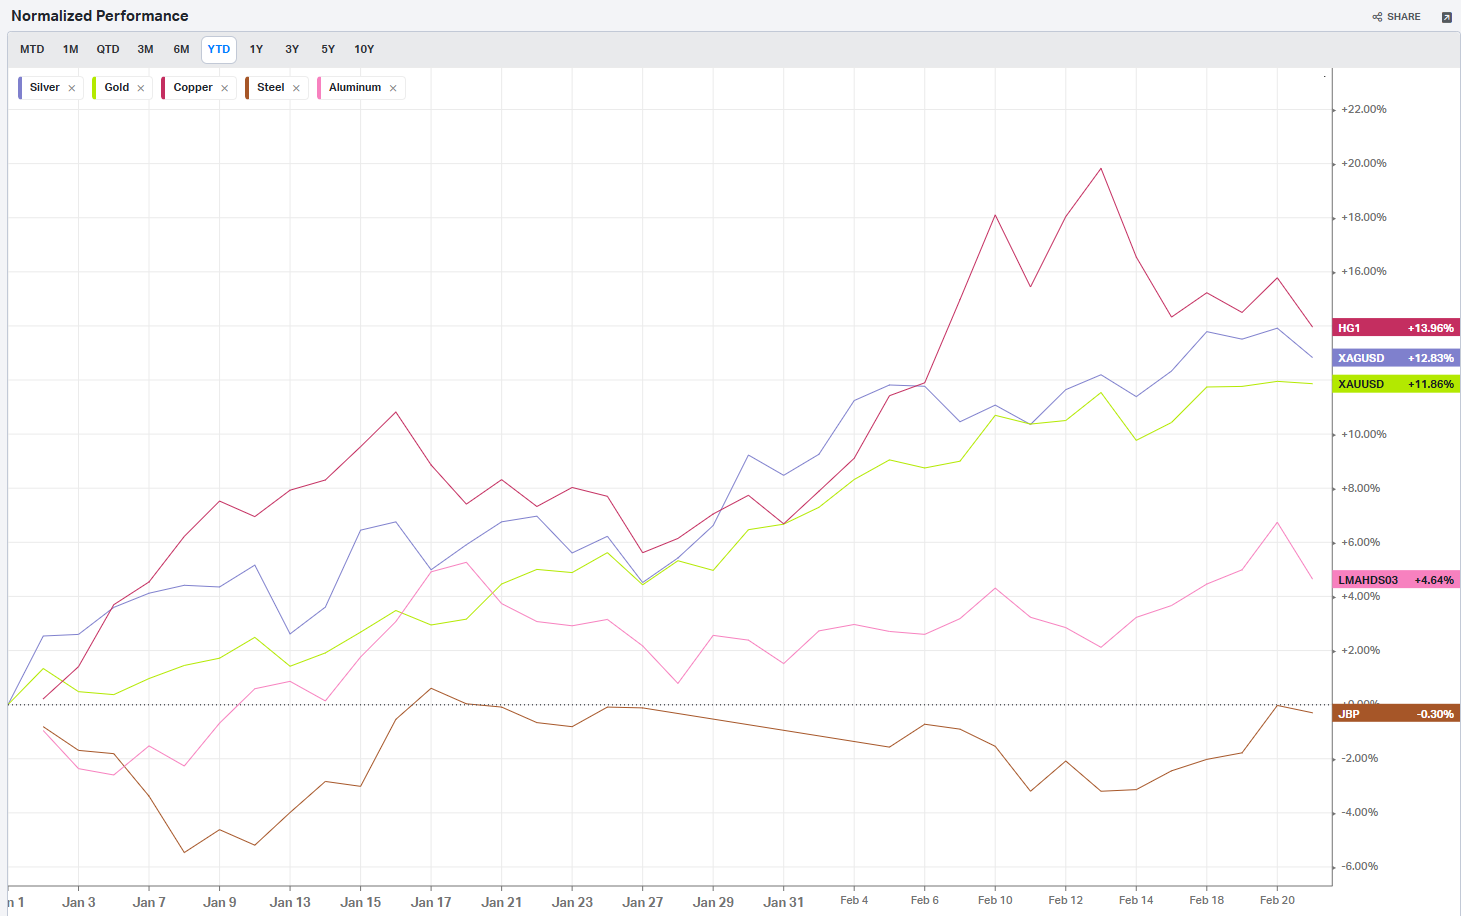
Commodities: Metals
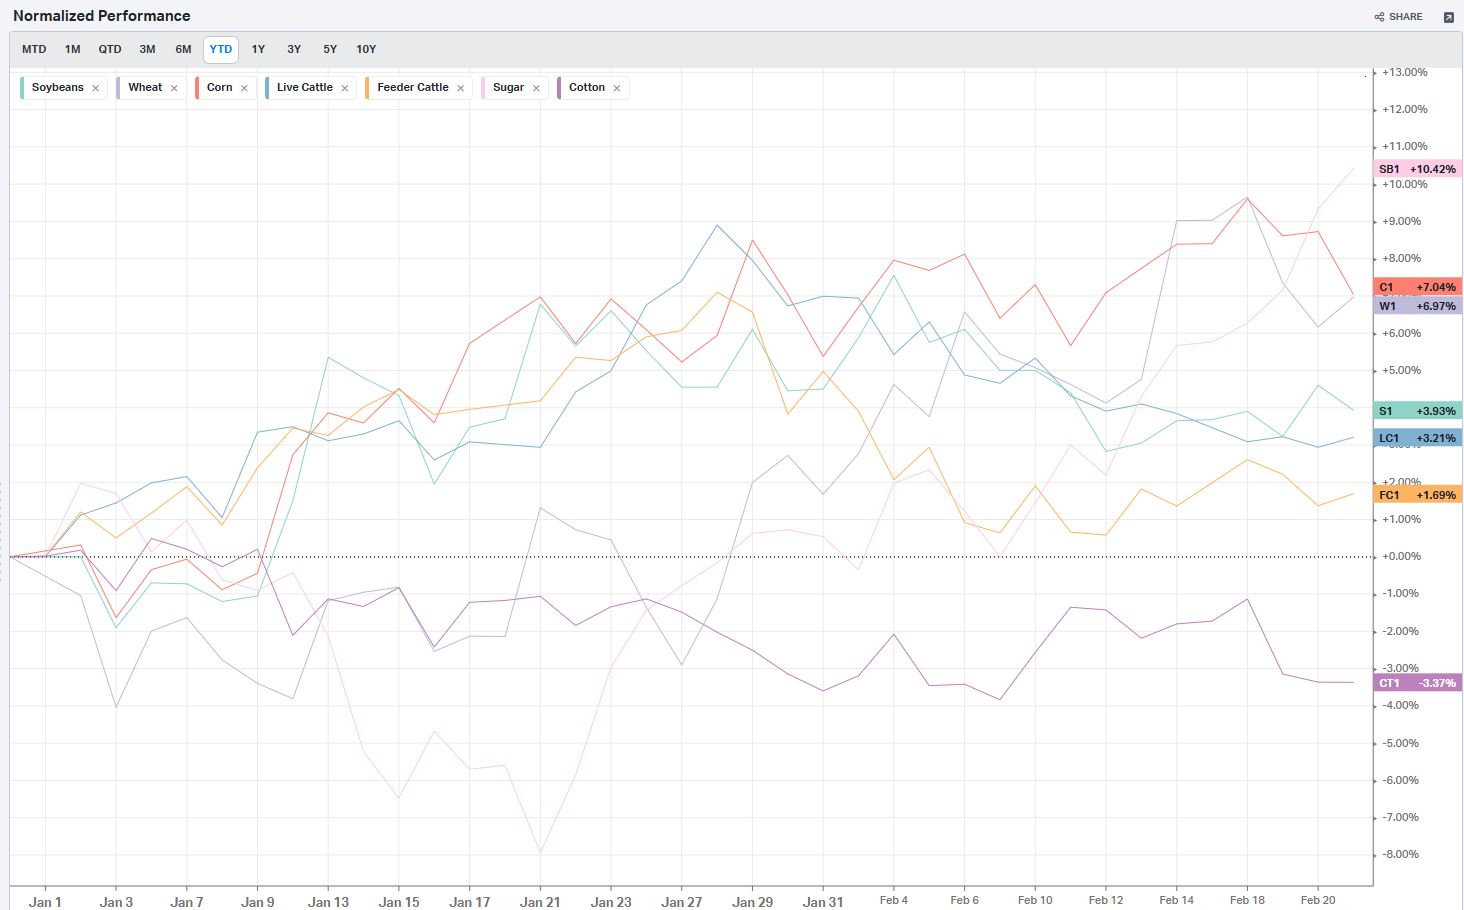
Commodities: Agriculture
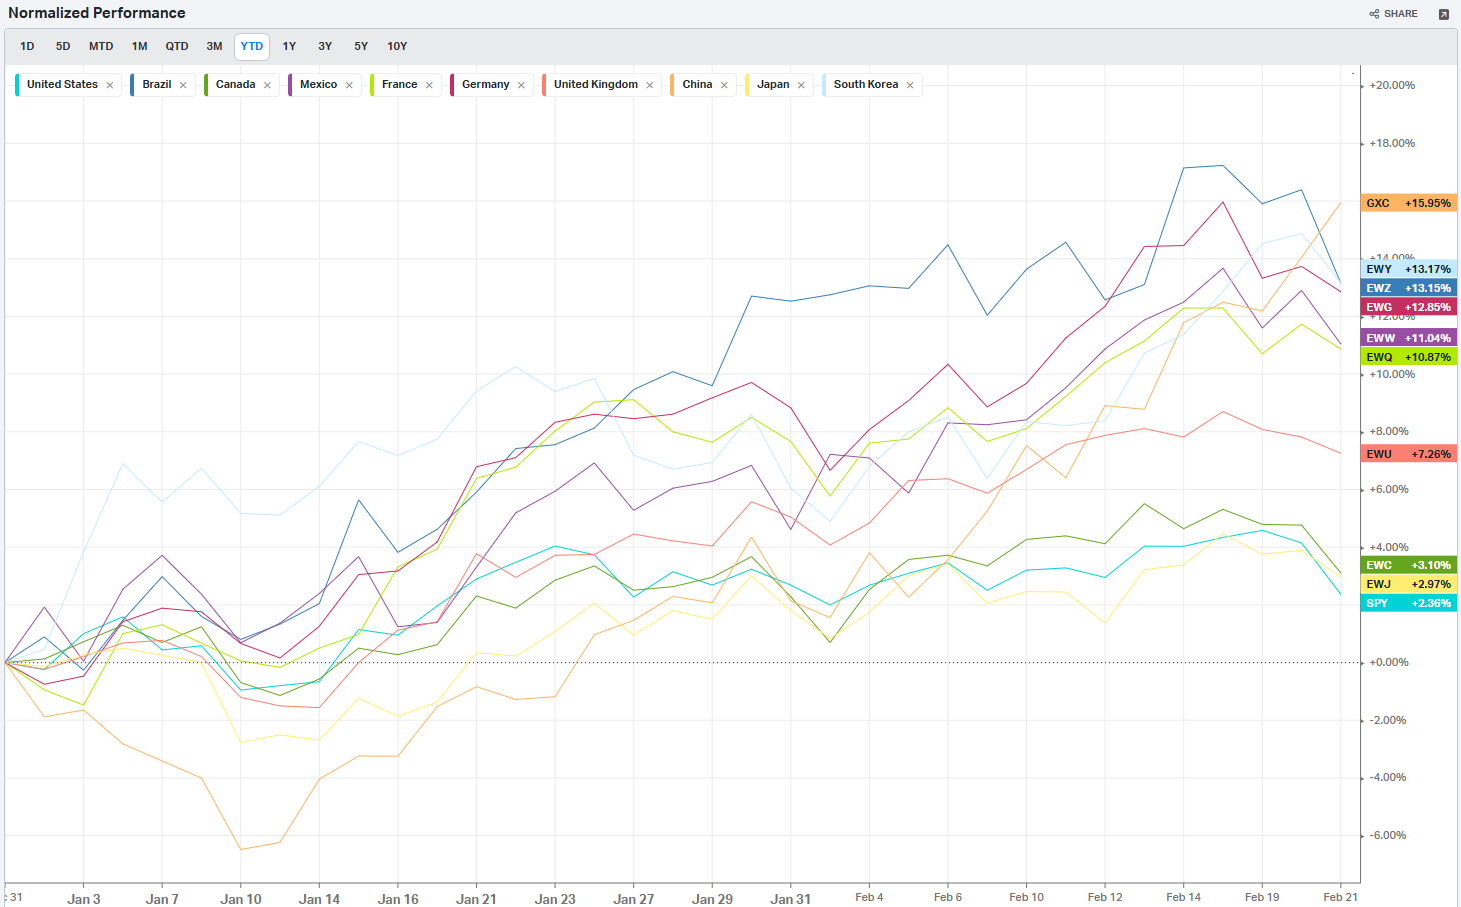
Country ETFs
Currencies
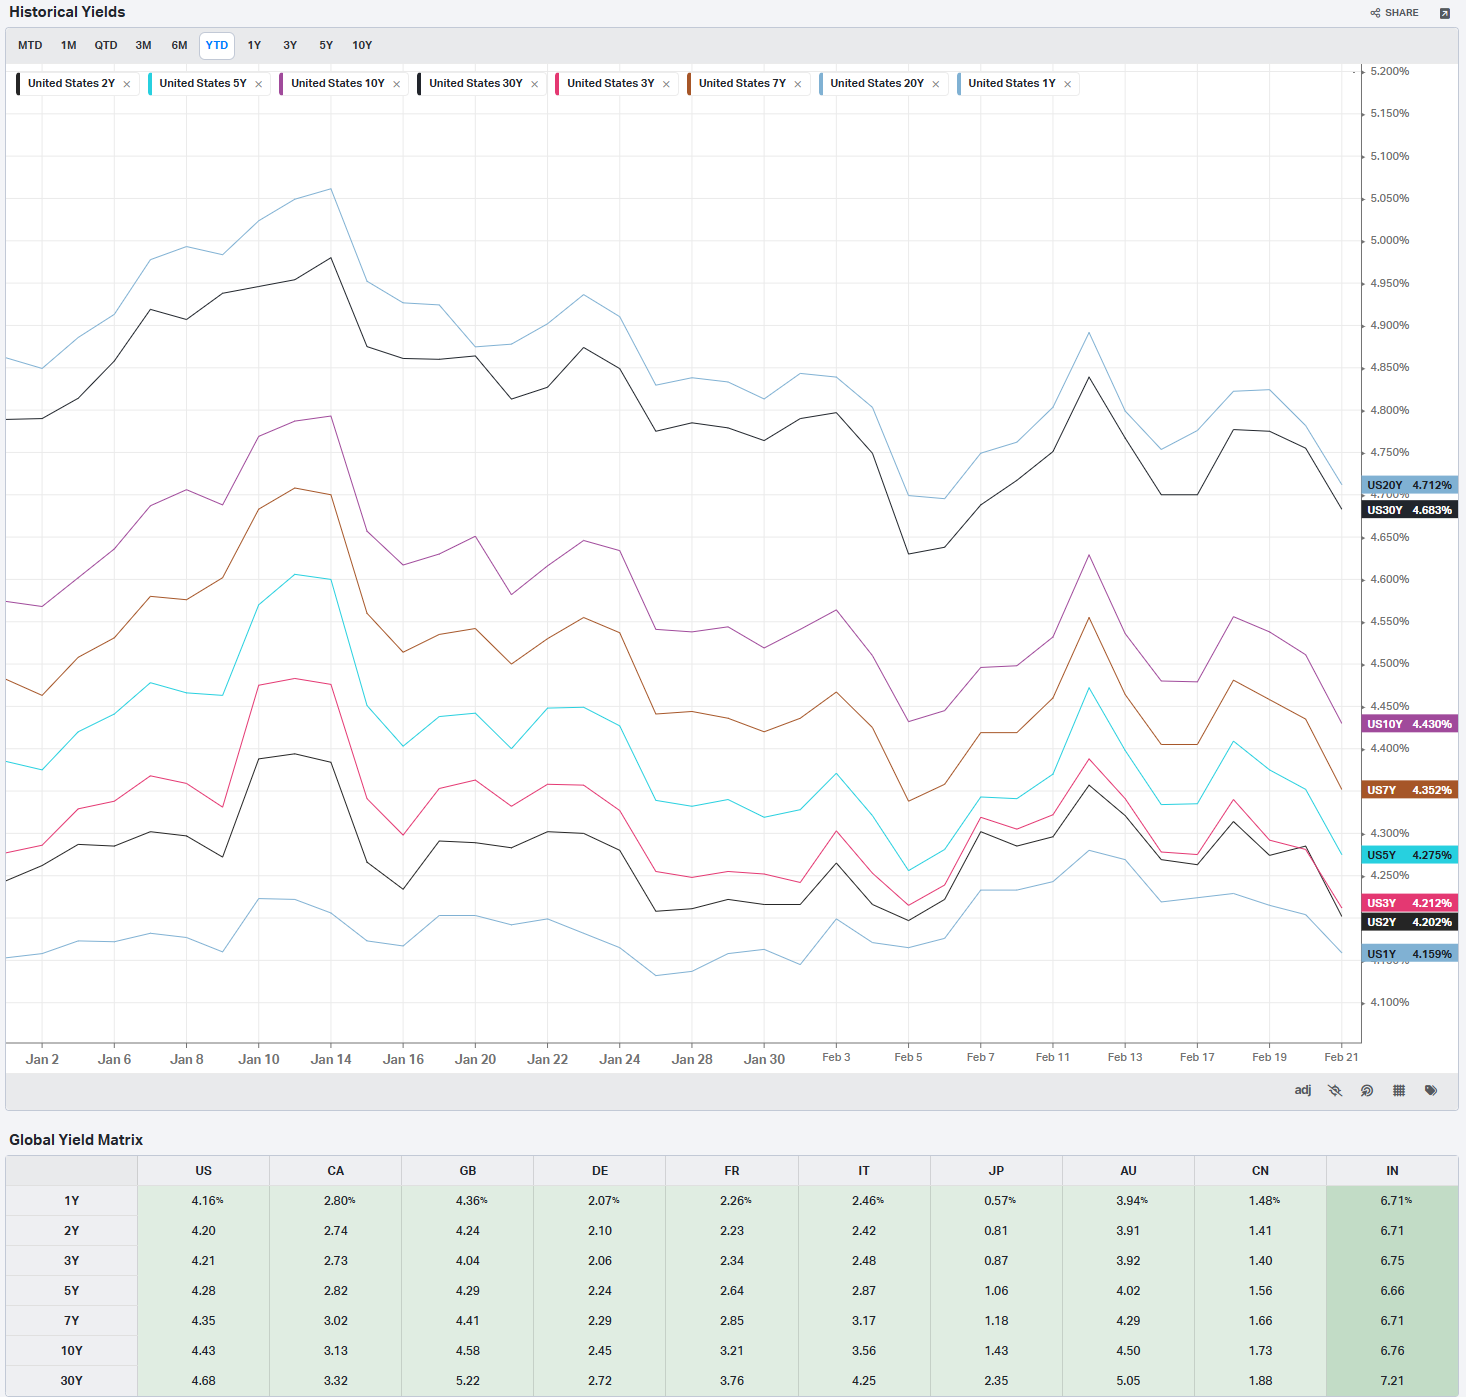
Global Yields
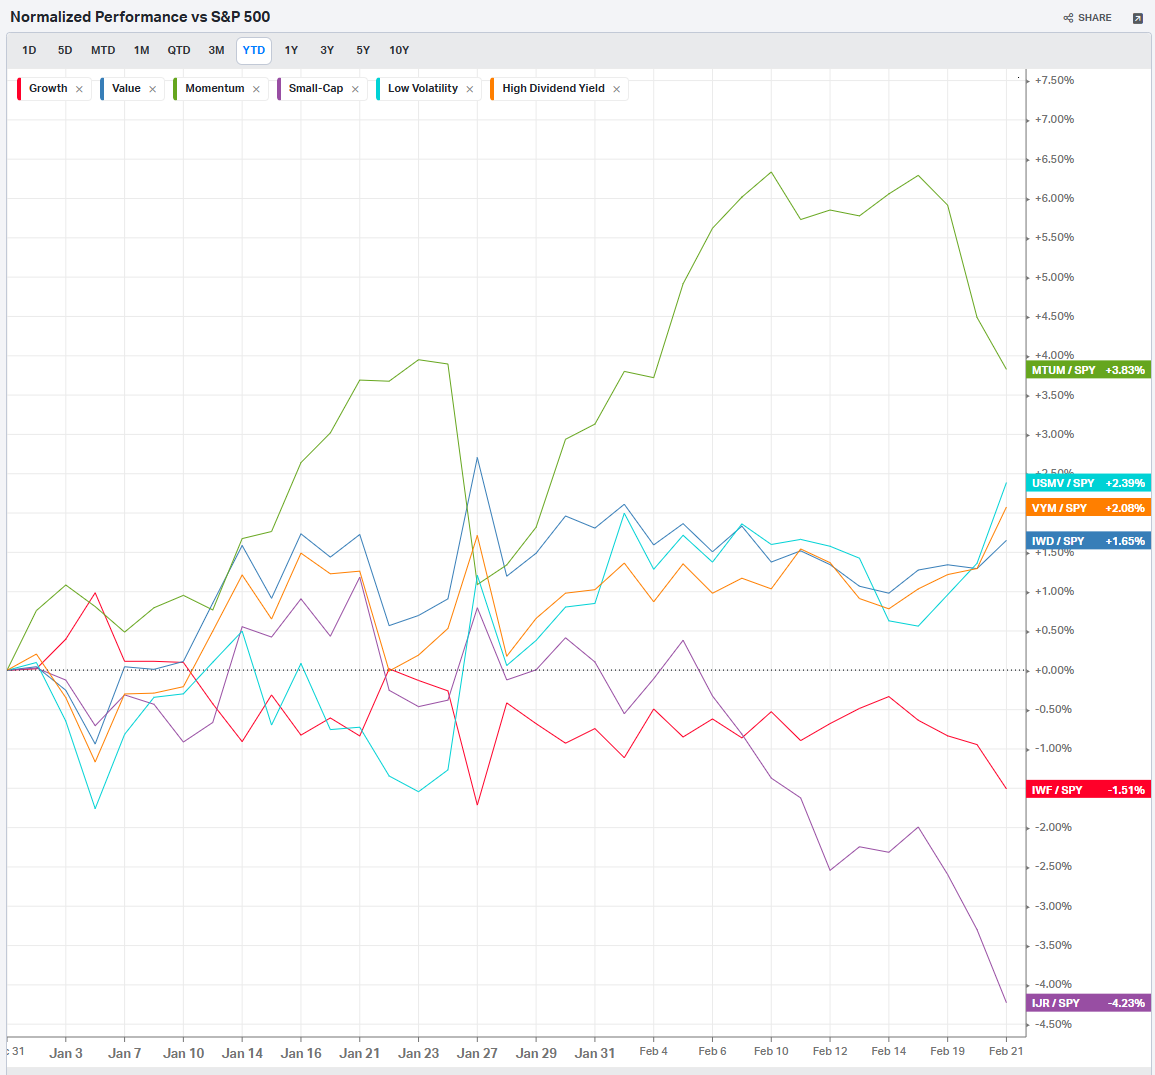
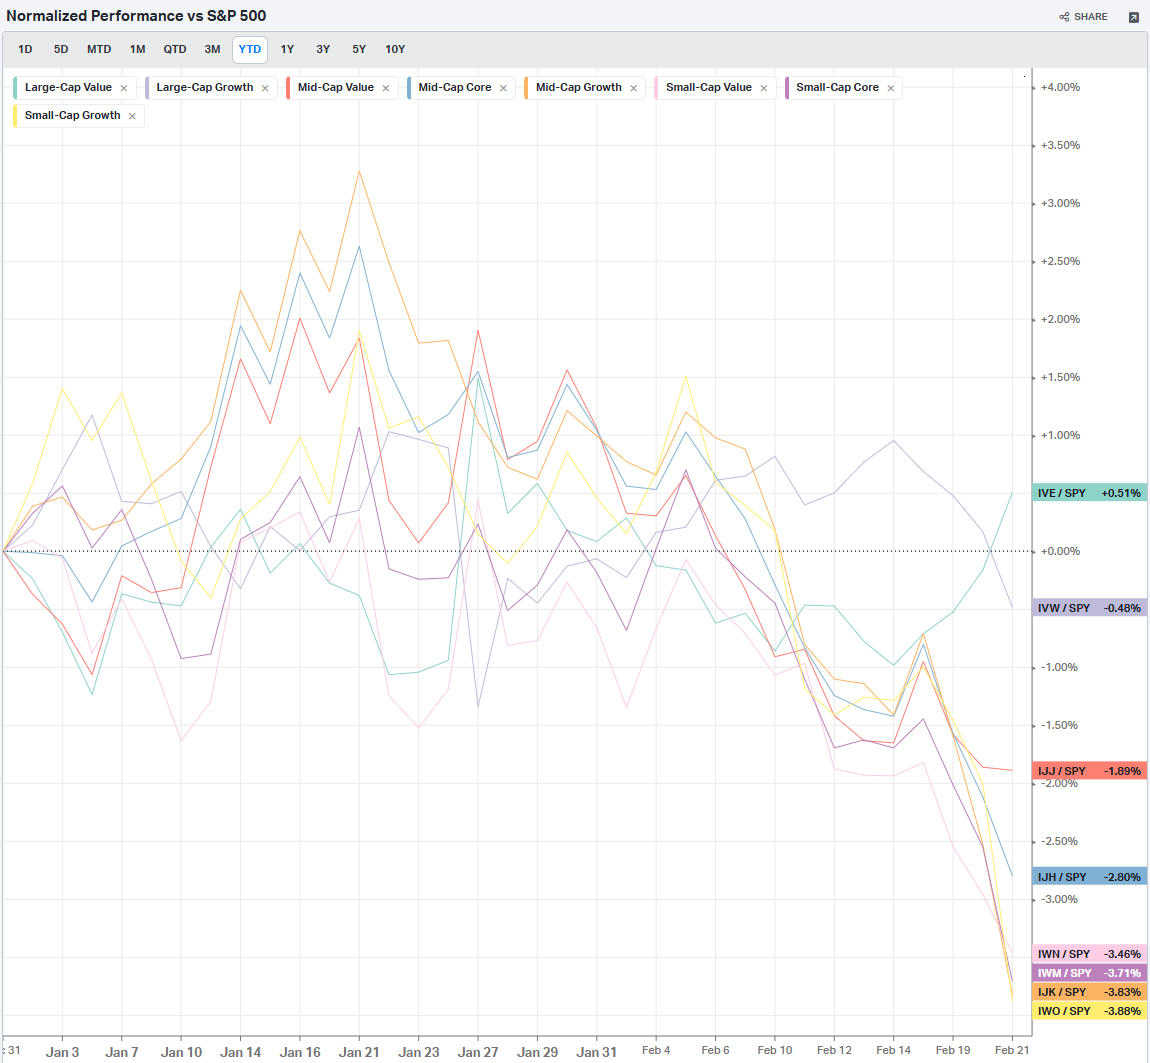
Factors: Style
Factors: Size vs Value
Factors: Qualitative
Social Media Favs
Analyzing social sentiment can provide valuable insights for investment strategies by offering a pulse on public perception, mood, and market sentiment that traditional financial indicators might not capture. Here’s how social sentiment analysis can enhance investment decisions:
Market Momentum: Positive or negative social sentiment can signal impending momentum shifts. When public opinion on a stock, sector, or asset class changes sharply, it can create buying or selling pressure, especially if that sentiment becomes widespread.
Early Detection of Trends: Social sentiment data can help investors spot trends before they show up in technical or fundamental data. For example, increased positive chatter around a particular company or sector might indicate growing interest or excitement, which could lead to price appreciation.
Gauge Retail Investor Impact: With the rise of retail investor platforms, collective sentiment on social media can lead to significant price movements (e.g., meme stocks). Understanding how retail investors view certain stocks can help in identifying high-volatility opportunities.
Event Reaction Monitoring: Social sentiment can provide real-time reactions to news events, product releases, or earnings reports. Investors can use this information to gauge market reaction quickly and adjust their strategies accordingly.
Complementing Quantitative Models: By adding a social sentiment layer to quantitative models, investors can enhance predictions. For example, a model that tracks historical price and volume data might perform even better when factoring in sentiment trends as a measure of market psychology.
Risk Management: Negative sentiment spikes can be a signal of potential downturns or increased volatility. By monitoring sentiment, investors might avoid or hedge against investments in companies experiencing a public relations crisis or facing negative perceptions.
Long-Term Sentiment Trends: Sustained sentiment trends, whether positive or negative, often mirror longer-term market cycles. Tracking sentiment trends over time can help identify shifts in investor psychology that could affect longer-term investments or sector rotations.
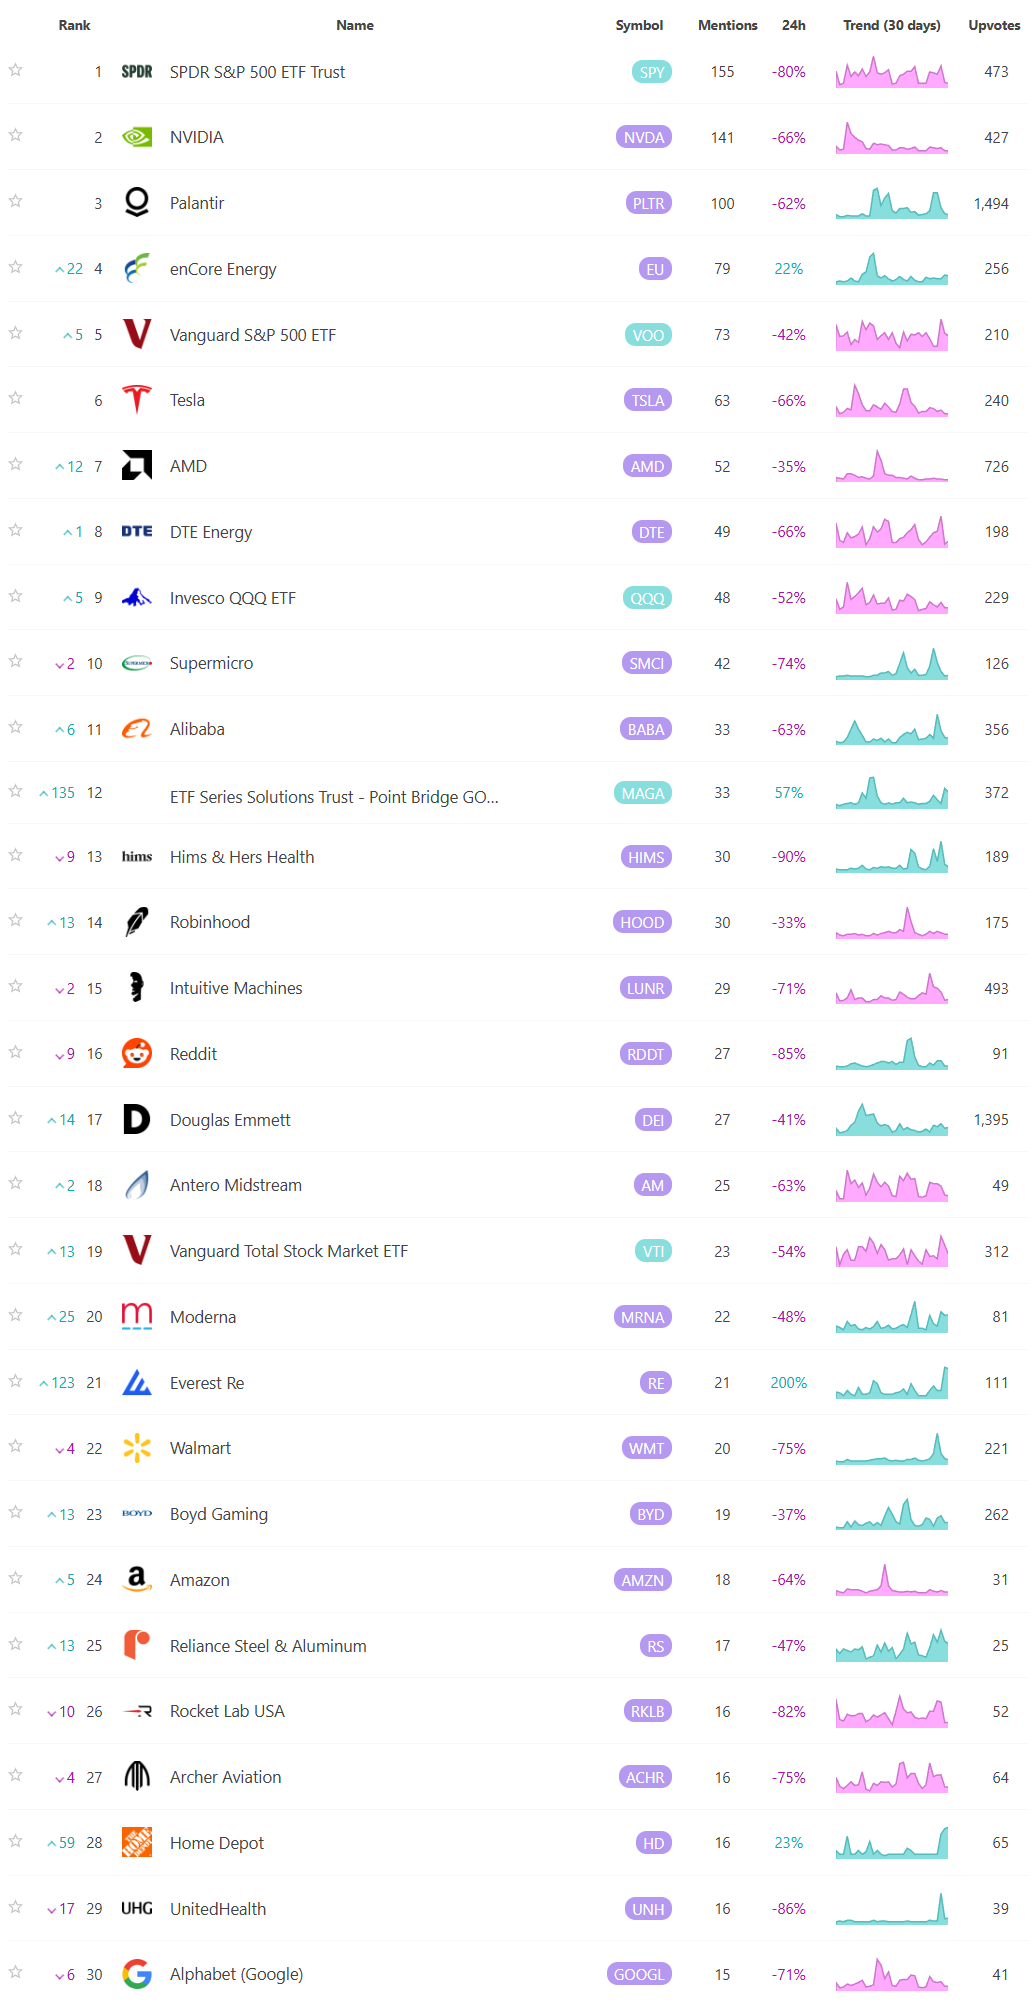
For these reasons, sentiment analysis, when combined with other tools, can provide a comprehensive view of both immediate market reactions and underlying investor attitudes, helping investors position themselves strategically across various time frames. Here are the most mentioned/discussed tickers on Reddit from some of the most active Subreddits for trading:
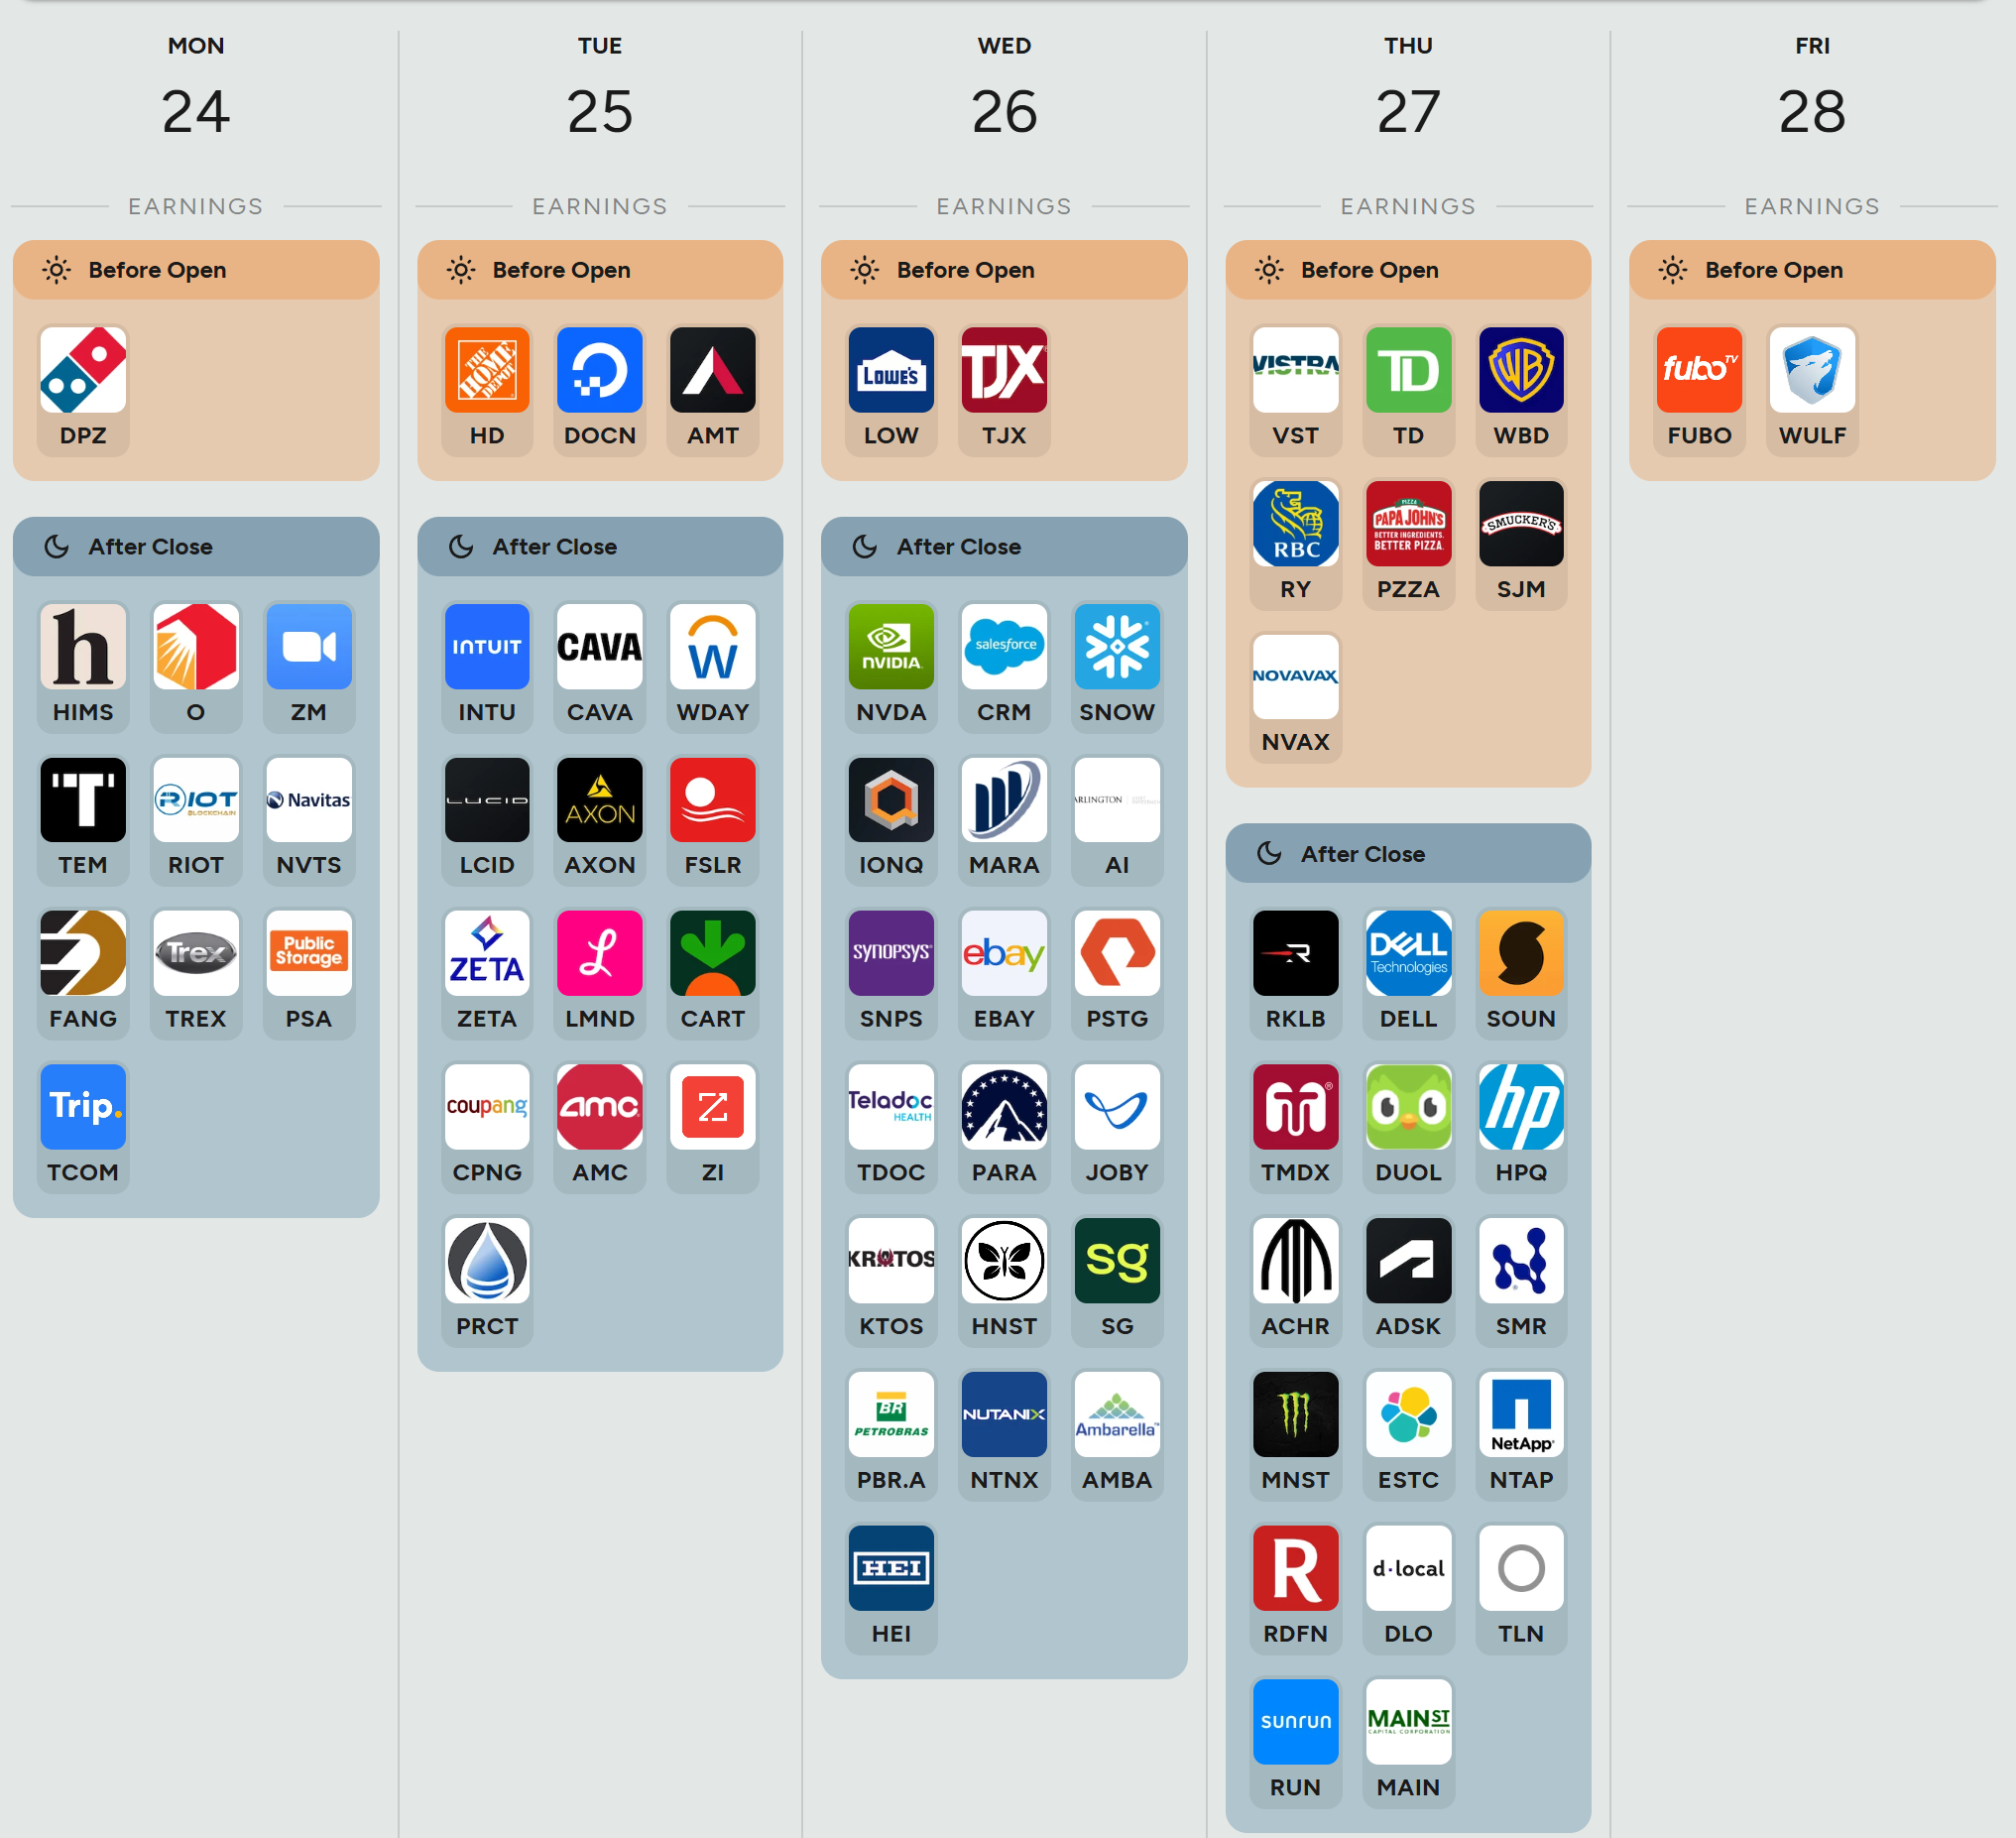
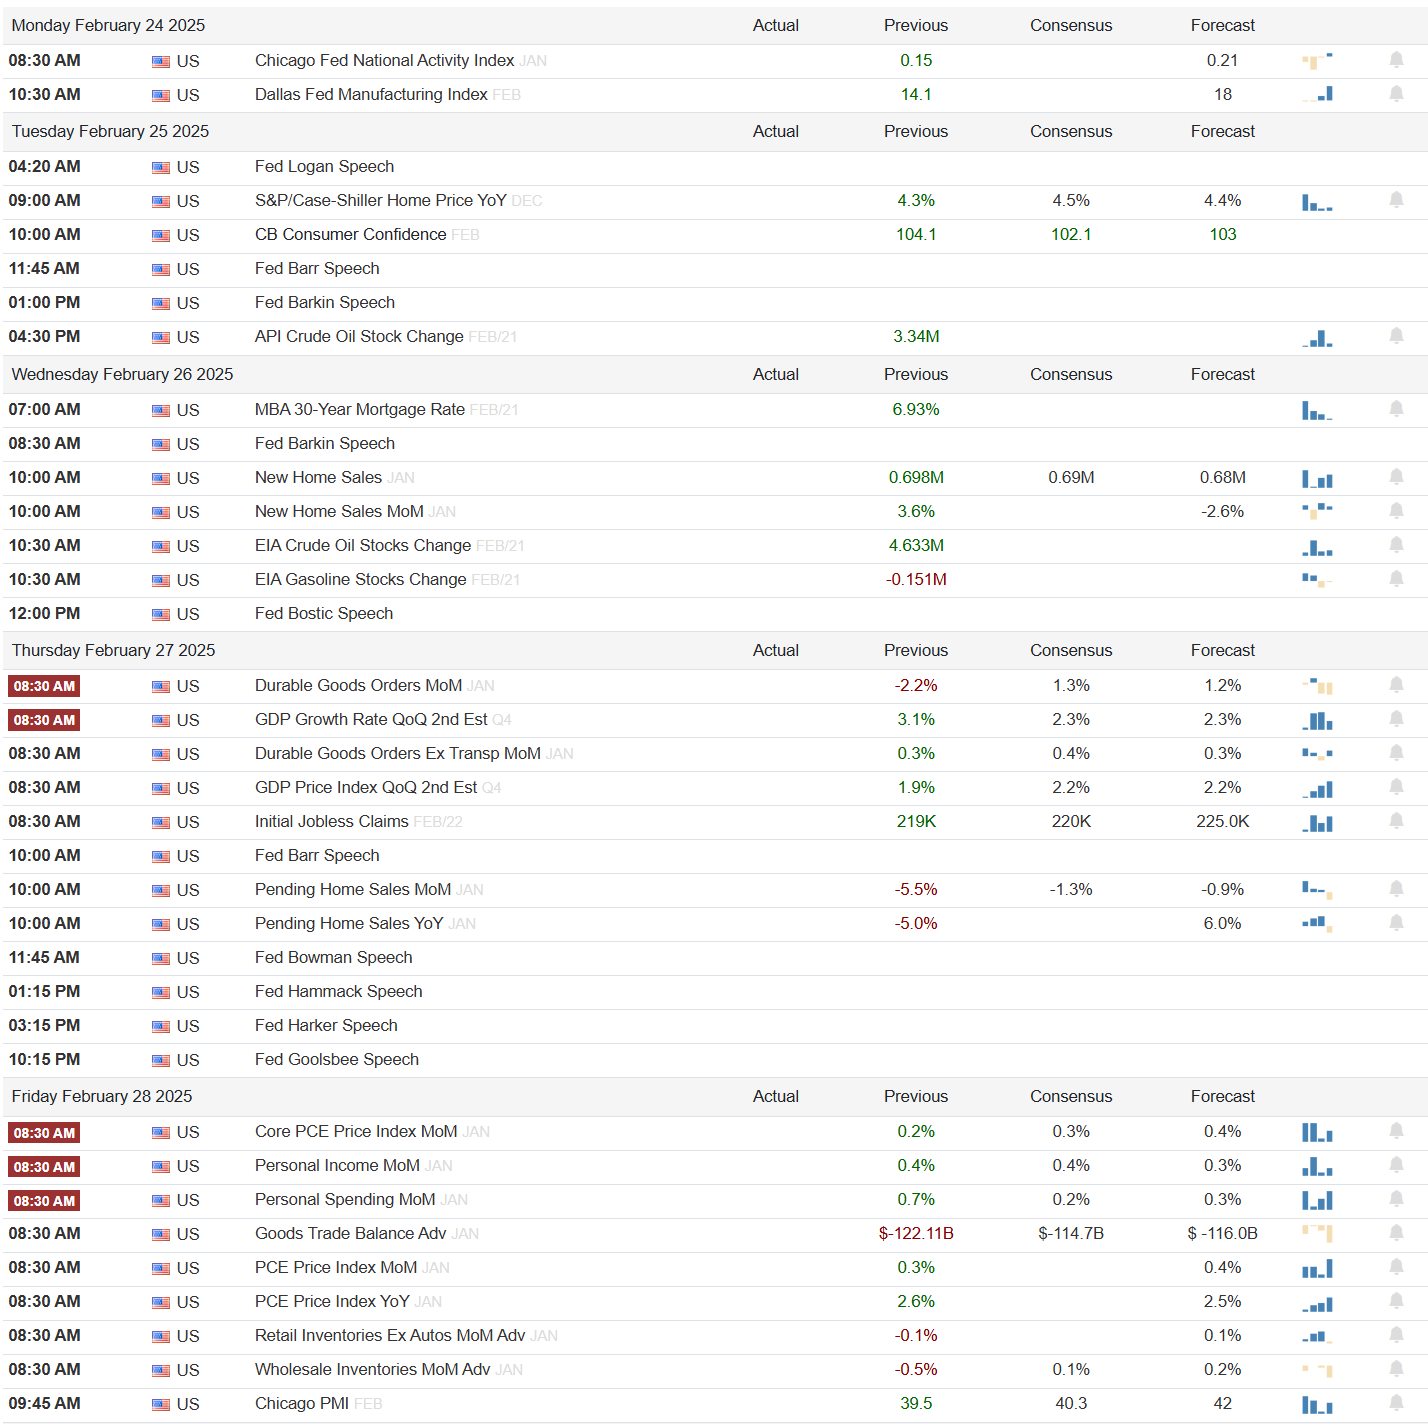
Events On Deck This Week
Here are key events happening this week that have the potential to cause outsized moves in the market or heightened short-term volatility.
Econ Events By Day of Week
Anticipated Earnings By Day of Week