Market Momentum: Your Weekly Financial Forecast & Market Prep
Issue 36 / What to expect March 10, 2025 thru March 14, 2025
In This Issue
Market-On-Close: All of last week’s market-moving news and macro context in under 5 minutes + futures-at-a-glance
The Latest Investor Sentiment Readings
Institutional Support & Resistance Levels For Major Indices: Exactly where to look for support and resistance this week in SPY, QQQ, IWM & DIA
Institutional Activity By Sector: Institutional order flow by sector including the top institutionally-backed names in those sectors. We break it all down and provide the key insights and take-aways you need to navigate institutional positioning this week.
Top Institutional Order Flow In Individual Names: All of the largest sweeps and blocks on lit exchanges and hidden dark pools
Moneyflow Charts for: SPY, QQQ, TSLA, NKE
Investments In Focus: Bull vs Bear arguments for CNX, RIO, PAYC
Top Institutionally-Backed Gainers & Losers: An explosive watchlist for day traders seeking high-volatility
Normalized Performance By Thematics YTD (Sector, Industry, Factor, Energy, Metals, Currencies, and more): which corners of the markets are beating benchmarks, which ones are overlooked and which ones are over-crowded
Key Econ Events and Earnings On-Deck For This Week

Market-On-Close
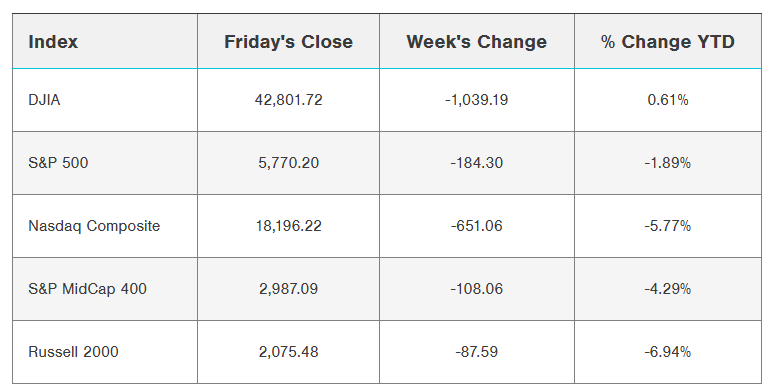
The first trading week of March 2025 presented a whirlwind of economic developments, policy shifts, and market movements that kept investors on edge. The S&P 500, Dow Jones Industrial Average, and Nasdaq Composite all experienced significant declines over the week, with the S&P 500 falling 3.1%—its worst performance since September 2024. The tech-heavy Nasdaq fared even worse, dropping 3.5% as investors rotated away from riskier assets. The Dow Jones Industrial Average shed 2.4%, erasing much of its year-to-date gains. These losses were fueled by a confluence of trade policy uncertainty, evolving Federal Reserve expectations, and a mixed labor market report that painted a complex picture of the economy.
Early in the week, market sentiment soured following President Donald Trump’s announcement of sweeping tariffs on imports from Canada and Mexico, imposing a 25% duty on goods starting March 4. Additionally, the administration doubled tariffs on select Chinese imports, increasing them from 10% to 20%. The move was justified on grounds of national security and economic self-reliance, but it sent shockwaves through financial markets. Investors had hoped for a more measured approach, and the abrupt escalation in trade tensions raised concerns about global supply chains and corporate earnings. In response, both Canada and Mexico swiftly signaled plans for retaliatory tariffs, threatening further economic disruptions.

The uncertainty surrounding trade policy took a heavy toll on equities, particularly in sectors sensitive to global commerce. Technology stocks bore the brunt of the selloff, as fears of retaliatory measures from China and other trading partners cast a shadow over an industry deeply intertwined with international supply chains. The Nasdaq’s sharp decline reflected investor anxiety over the potential for increased costs and supply constraints. Even stalwarts like Apple and NVIDIA saw their stock prices slide, while semiconductor firms, heavily reliant on Chinese manufacturing, struggled to find footing.
Meanwhile, economic data released throughout the week painted a mixed picture of the U.S. economy. The February nonfarm payrolls report showed that the U.S. added 151,000 jobs, slightly below expectations of 170,000. While employment gains in health care, financial activities, and transportation were encouraging, federal government payrolls shrank, a reflection of cost-cutting measures implemented earlier in the year. The unemployment rate ticked up to 4.1%, a modest increase that signaled some softening in labor market conditions. Wage growth, however, remained steady, rising 0.3% month over month, aligning with analyst projections. While the jobs report did not indicate a sudden economic downturn, it reinforced concerns that growth may be shifting into a lower gear.

The Federal Reserve’s stance on monetary policy remained a focal point for investors, with Fed Chair Jerome Powell offering measured comments that suggested the central bank would remain patient in adjusting interest rates. Powell reassured markets that while economic momentum had softened, the underlying fundamentals remained sound. His remarks provided a momentary boost to equities on Friday, with major indexes recovering from their intra-week lows.

However, investors continued to grapple with uncertainty regarding the Fed’s next steps, particularly as inflation expectations remained elevated. While the bond market had initially priced in no rate cuts for 2025, shifting sentiment saw futures markets begin to factor in two to three quarter-point cuts later in the year, reflecting expectations of a more accommodative stance if economic growth continued to slow.

Beyond the U.S., international developments added to the unease. China’s latest trade data showed weaker-than-expected exports and a significant contraction in imports, signaling potential headwinds for global demand. European markets were similarly under pressure, with the Euro Stoxx 50 index declining nearly 1% amid concerns over slowing economic activity and persistent inflation. In Germany, factory orders posted their steepest decline in a year, fueling speculation that the European Central Bank may reconsider its timeline for potential interest rate cuts.
Despite the turmoil, there were pockets of strength in the markets. The energy sector provided a rare bright spot, bolstered by a 2% rise in crude oil prices. Supply constraints, coupled with geopolitical tensions in key oil-producing regions, lifted energy stocks even as broader equity markets struggled. Additionally, semiconductor giant Broadcom defied the market downturn, surging more than 8% after reporting better-than-expected quarterly earnings and issuing an optimistic outlook for AI-related demand. Broadcom’s performance highlighted the resilience of certain high-growth areas within the market, even amid broader volatility.
As the week drew to a close, investor sentiment remained cautious. Defensive sectors, including health care and consumer staples, saw increased inflows as market participants sought safety. Meanwhile, U.S. Treasury bonds experienced heightened demand, with the 10-year yield dipping to 4.31% before stabilizing. The flight to safety underscored lingering concerns about economic growth and policy uncertainty.

Looking ahead, all eyes will be on upcoming inflation data and further developments in trade negotiations. While markets have adjusted to a more defensive posture, historical patterns suggest that pullbacks of this magnitude often create buying opportunities for patient investors. While risks remain—particularly around trade policy and potential government shutdown threats—the underlying strength of the economy, coupled with the possibility of Fed intervention if conditions deteriorate, provides a measure of reassurance. Investors will need to remain nimble, balancing caution with the potential for strategic positioning as new information emerges.
In sum, the first week of March 2025 was defined by heightened volatility and a reevaluation of market risks. The interplay of trade policy, monetary expectations, and economic data ensured that investors remained on high alert. While uncertainty persists, disciplined market participants may find opportunities amid the turbulence, as periods of volatility have historically led to long-term gains for those who remain steadfast in their investment approach.
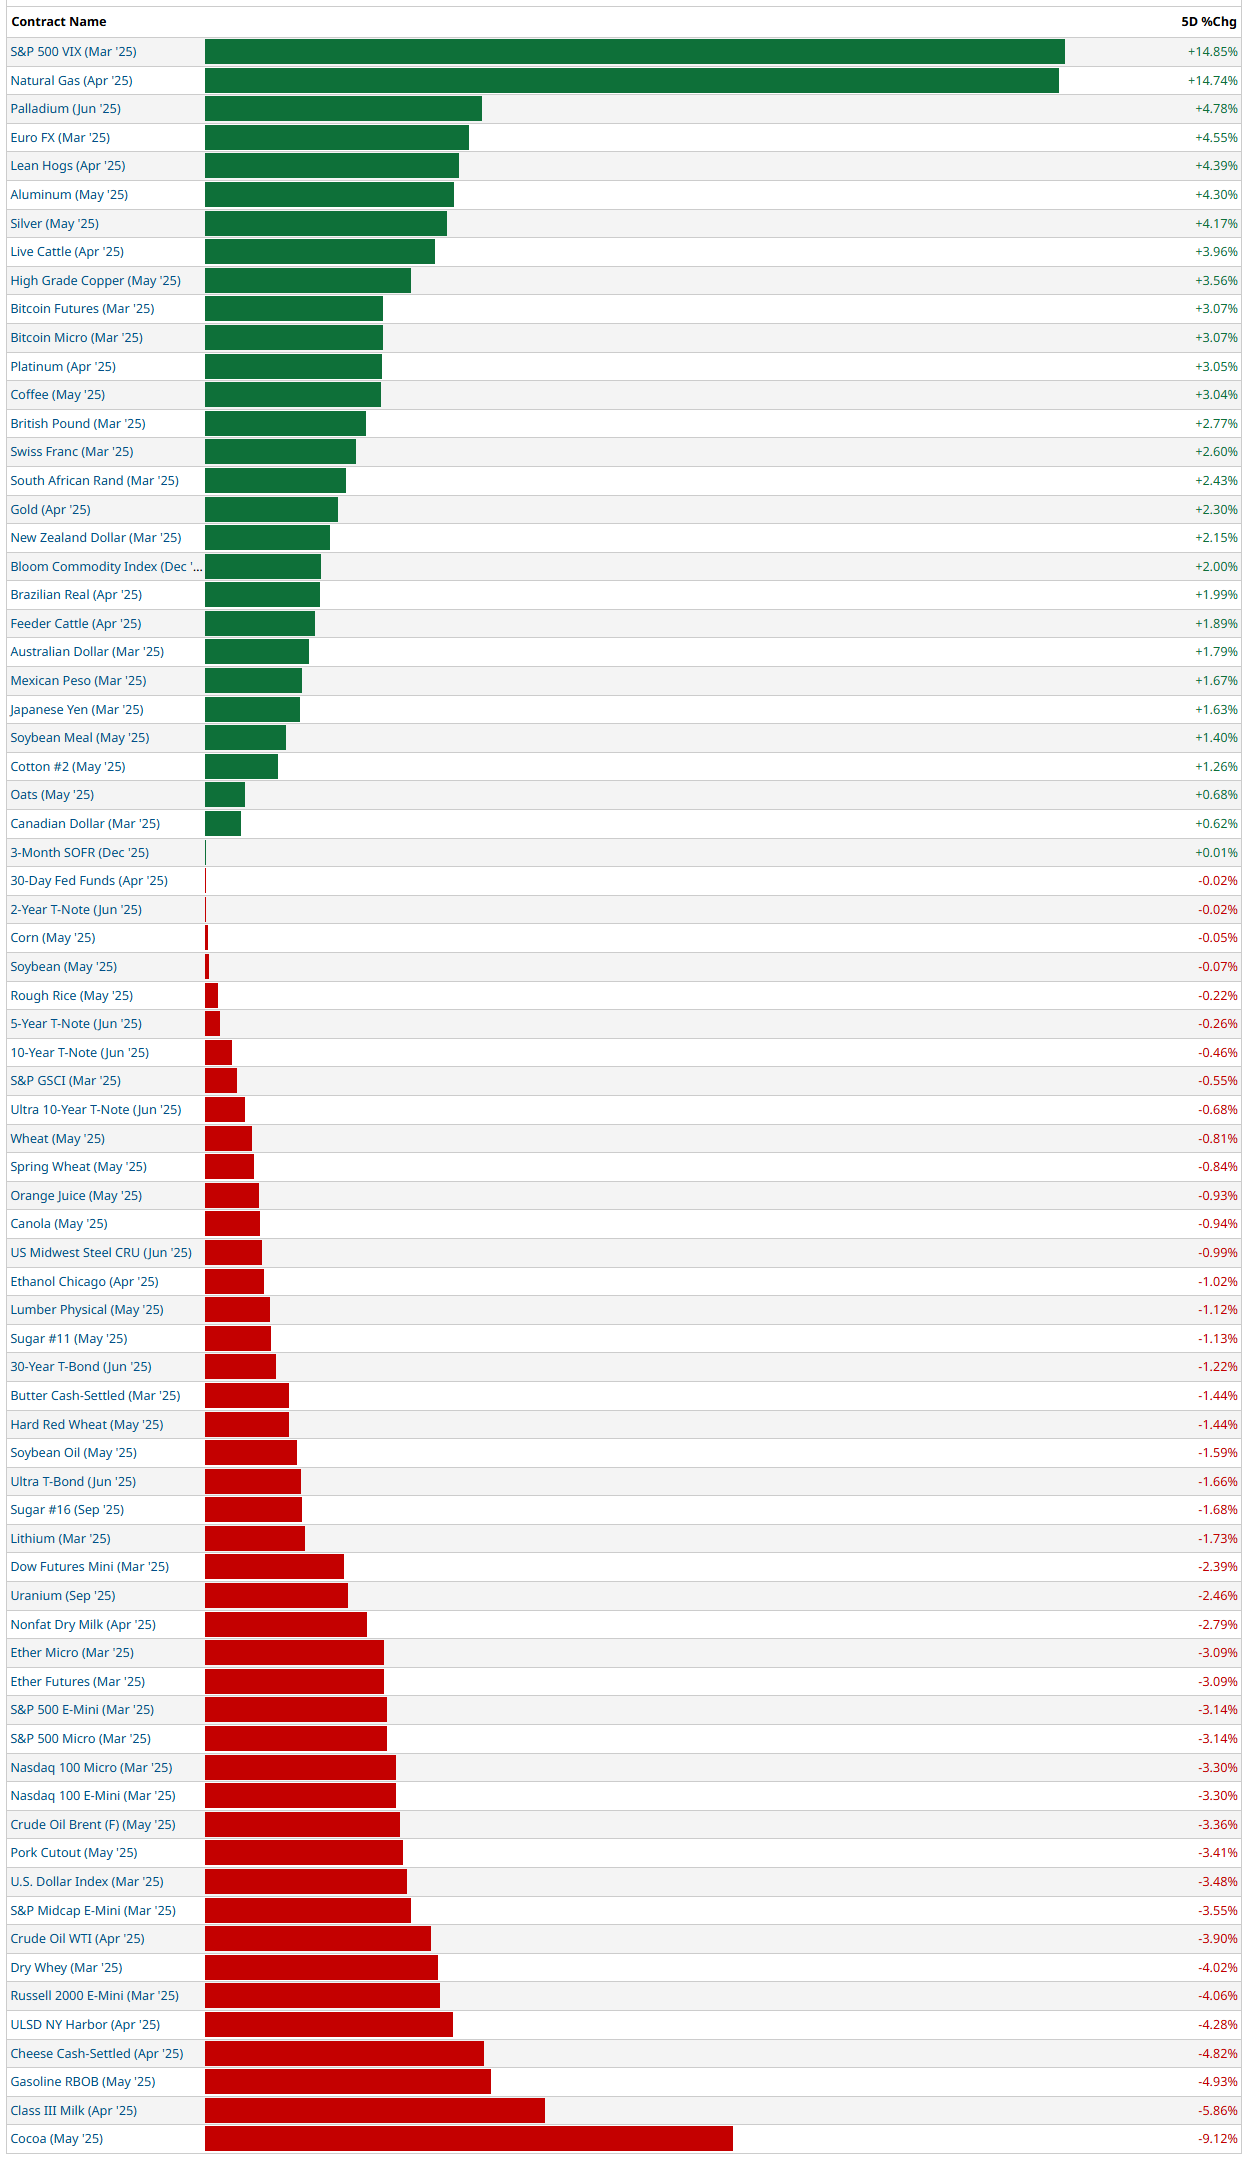
5-Day Futures Performance Leaders
S&P 500 Sector Insights
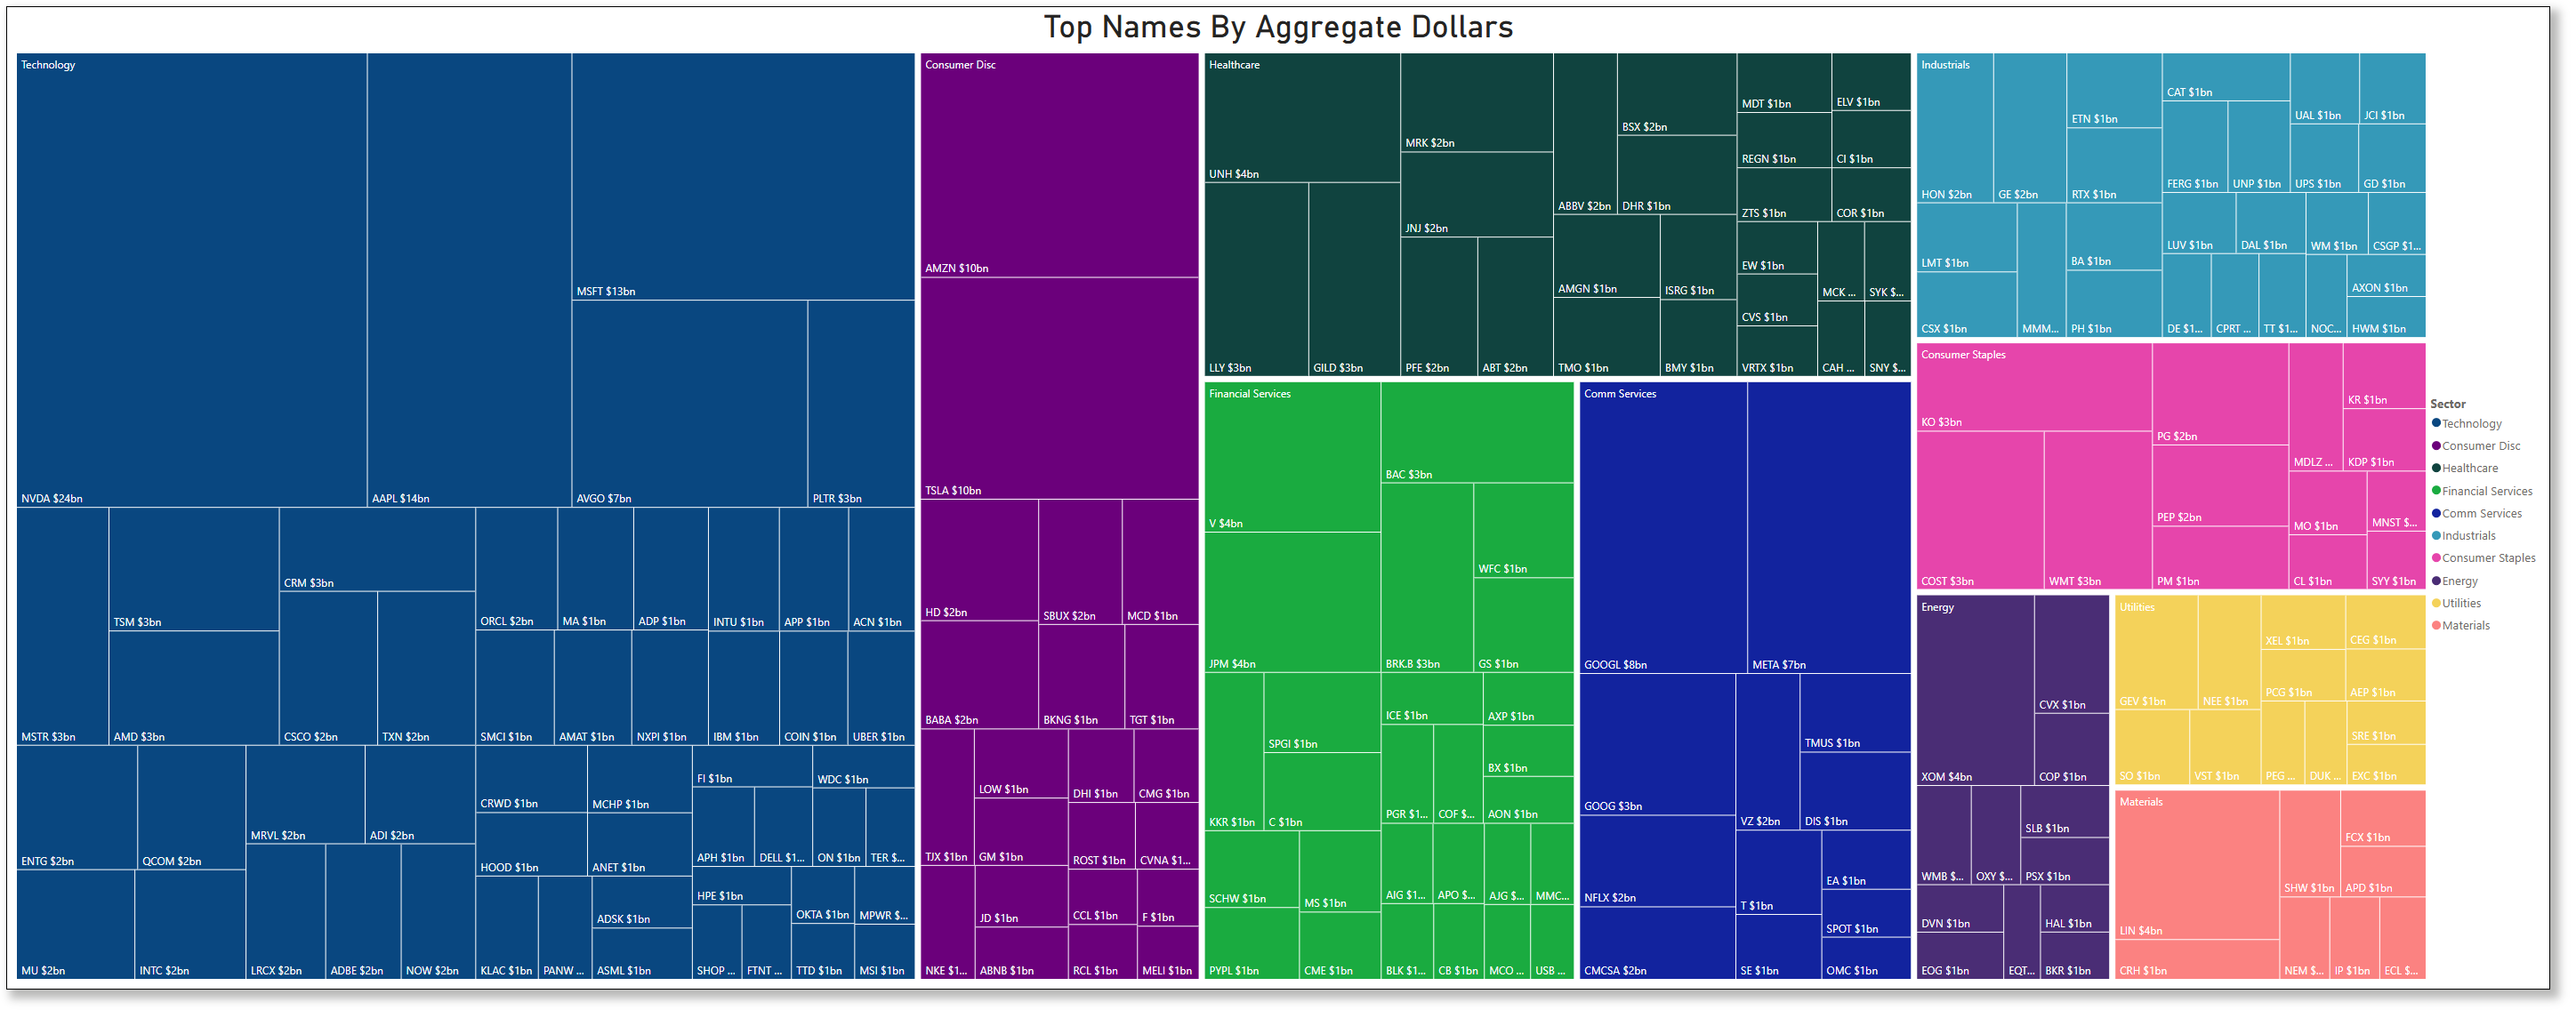
Sector Overview With Individual Names By Market Cap
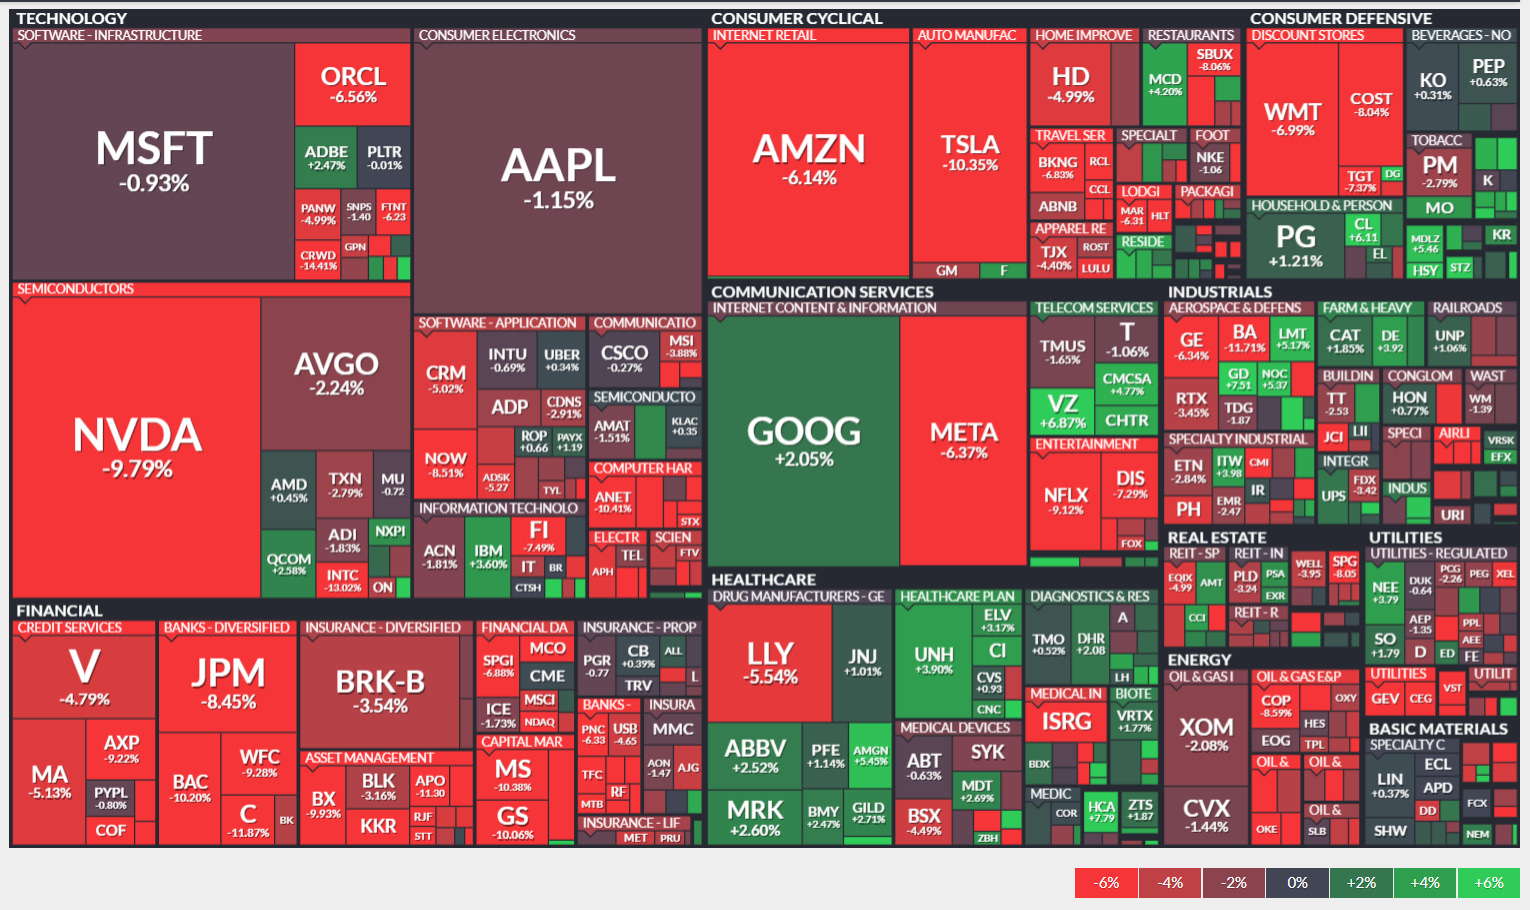
Technology Sector Hit Hard:
NVIDIA ( NVDA 0.00%↑ ) down 9.79%
Major tech names like AAPL 0.02%↑ (-1.15%), MSFT -0.03%↓ (-0.93%), AMZN -0.05%↓ (-6.14%), and META 0.00%↑ (-6.37%) all declining
Oracle ( ORCL 0.03%↑ ) down 6.56%
Financial Sector Under Pressure:
JPMorgan (JPM) down 8.45%
Visa (V) down 4.79%
Berkshire Hathaway (BRK-B) down 3.54%
Bank of America (BAC) down 10.20%
Consumer Cyclical Weakness:
Tesla ( TSLA 0.00%↑ ) among the worst performers at -10.35%
Home Depot ( HD 0.00%↑ ) down 4.99%
Walmart ( WMT -0.10%↓ ) down 6.99%
Costco ( COST -0.13%↓ ) down 8.04%
Relative Strength in Healthcare:
Several green boxes in healthcare including JNJ 0.00%↑ (+1.01%), ABBV 0.00%↑ (+2.52%), and MRK 0.00%↑ (+2.60%)
Selective Strength in Consumer Staples:
Procter & Gamble ( PG 0.00%↑ ) up 1.21%
Pepsi ( PEP 0.00%↑ ) up 0.63%
Coca-Cola ( KO 0.00%↑ ) up 0.31%
Energy and Industrials Mixed:
XOM 0.00%↑ down 0.26%
Some green in industrials like GE 0.00%↑ (+1.06%) and CAT -0.11%↓ (+1.85%)
Biggest Decliners:
TSLA 0.00%↑ : -10.35%
BAC 0.00%↑ : -10.20%
NVDA 0.00%↑ : -9.79%
AXP 0.00%↑ : -9.22%
JPM 0.00%↑ : -8.45%
COST -0.13%↓ : -8.04%
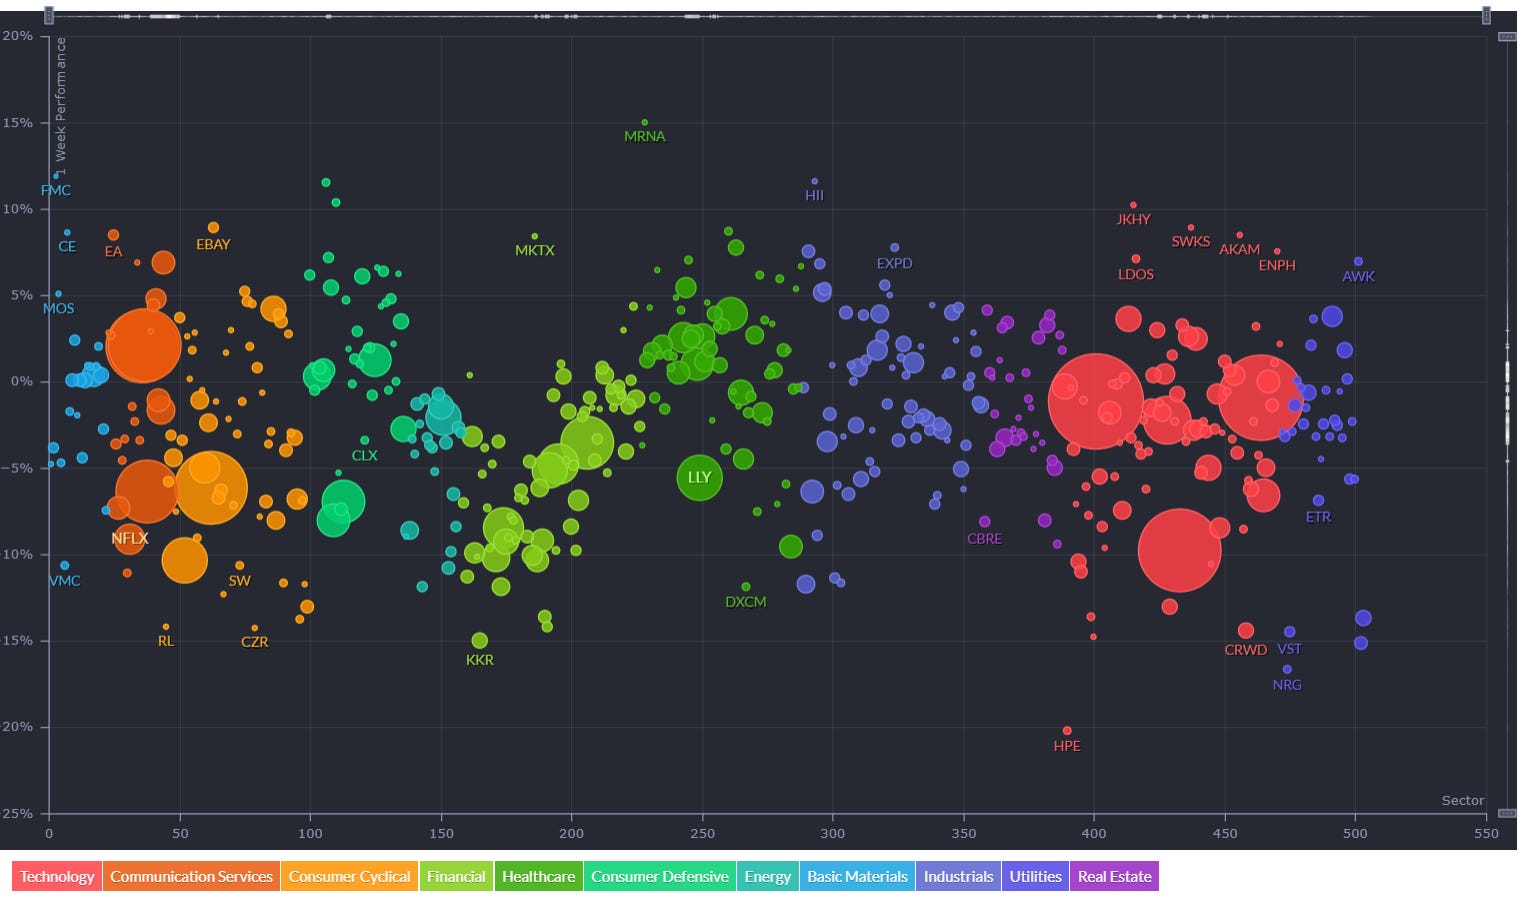
Notable Gainers:
Verizon ( VZ 0.00%↑ ): +16.87% (standout performer)
McDonald's ( MCD 0.00%↑ ): +4.20%
Gilead ( GILD 0.00%↑ ): +2.71%
Google ( GOOG -0.10%↓ ): +2.05%
Netflix ( NFLX -0.19%↓ ): +1.12%
The heatmap largely shows a defensive rotation with investors moving from growth/tech into:
Defensive consumer staples ( PG 0.00%↑ , KO 0.00%↑ , PEP 0.00%↑ )
Select healthcare names ( MRK 0.00%↑ , ABBV 0.00%↑ , JNJ 0.00%↑ )
Utilities
Telecom ( VZ 0.00%↑ as the standout winner)
This pattern suggests investors are seeking safety in dividend-paying stocks and traditionally defensive sectors amid broader market uncertainty.
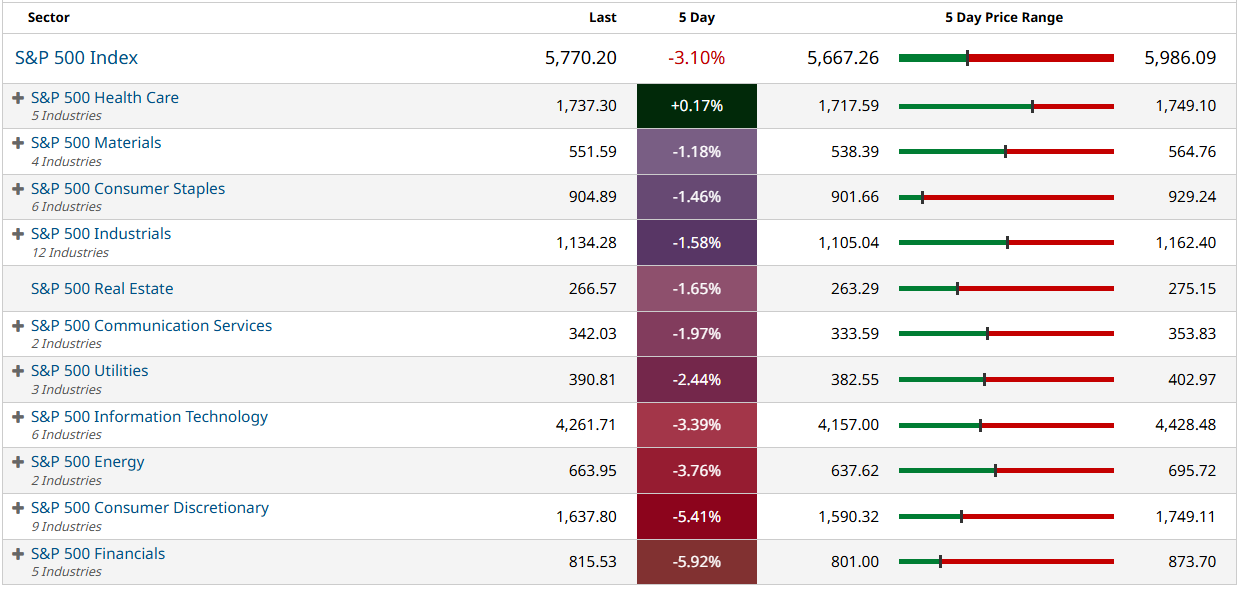
5-Day Sector Leaderboard
5-Day Individual Performance Grouped By Sector (Size By Market Cap)
ETF Insights
Reviewing a heatmap like this weekly can be incredibly helpful for investors as it provides a quick and visual summary of market performance across various sectors, asset classes, and geographies.
1. Sector and Asset Class Trends
Identify Strong and Weak Sectors: Investors can quickly spot which sectors (e.g., technology, energy, healthcare) are performing well or underperforming.
Asset Class Diversification: Seeing how commodities, fixed income, equities, and cryptocurrencies performed helps assess diversification.
2. Market Sentiment
Risk-On or Risk-Off: A green-dominated map suggests bullish sentiment, while red indicates bearish sentiment. Investors can align their strategies accordingly.
Volatility Indicators: Observing movements in volatility indices (e.g., VIX) can highlight changing market dynamics.
3. Regional Analysis
Global Insights: Performance in developed and emerging markets (e.g., Europe, China, Asia-Pacific) helps in gauging international investment opportunities or risks.
Currency Impacts: Movements in forex or country-specific ETFs can indicate currency-driven market trends.
4. Thematic Trends
Growth vs. Value: Comparing the performance of growth ETFs (e.g., VUG) versus value ETFs (e.g., VTV) reveals the prevailing market preference.
Industry Leadership: Highlighting leadership within industries (e.g., gold miners, semiconductors) can inform thematic plays.
5. Monitoring Investments
Portfolio Alignment: Investors can track how their existing investments or watchlist align with broader market trends.
Rotation Signals: Seeing week-over-week changes in sector dominance may signal sector rotation opportunities.
6. Risk Management
Recognizing Overbought/Oversold Conditions: Consistent underperformance or overperformance in specific areas may indicate potential mean-reversion trades.
Correlation Awareness: By observing how different asset classes move, investors can manage portfolio correlation and risk.
7. Decision Support
Identify Outperformers/Underperformers: ETFs, sectors, or indices that repeatedly outperform or underperform can help refine trading or investment strategies.
Macro Perspective: Weekly trends highlight macroeconomic or geopolitical influences affecting markets.
Regularly reviewing a heatmap like this is a strategic practice that supports data-driven decision-making while fostering a holistic understanding of market dynamics.
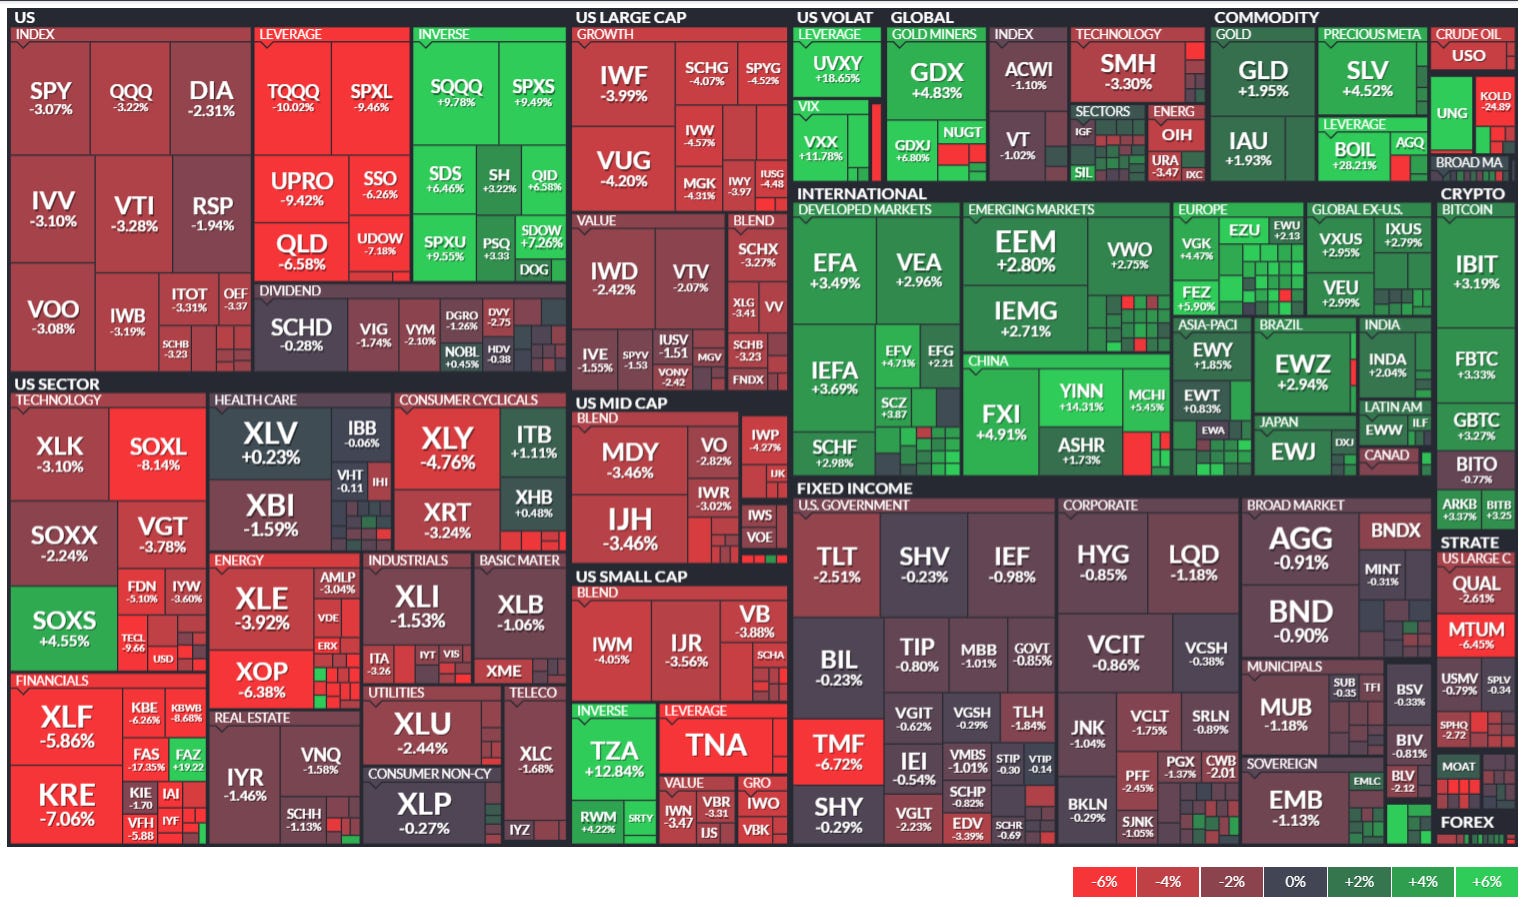
Broad Market & Sector Trends
Overall Market Weakness:
Major indices are down: SPY (-3.07%), QQQ (-3.22%), DIA (-2.81%)
Inverse ETFs Shining:
Significant outperformance of inverse ETFs: SDS (+6.46%), SQQQ (+17.71%), TZA (+12.84%)
Agile traders are profiting from the market declines and volatility
Sector Performance Breakdown:
Technology: XLK (-3.10%), SOXX (-2.24%) - continuing the tech weakness
Financials: XLF (-5.86%), KRE (-7.06%) - financial sector hit especially hard
Healthcare: XLV (+0.23%) - slight positive, confirming healthcare's relative strength
Energy: XLE (-3.92%), XOP (-4.55%) - energy sector underperforming
Consumer: XLY (-4.76%) for cyclicals, XLP (-0.27%) for staples - defensive staples holding up better
Real Estate: IYR (-1.46%) - moderate decline
Volatility Spike:
VIX-related products up significantly (VXX +16.80%, UVXY showing strong gains) indicating significant market fear and uncertainty
International Markets & Fixed Income
International Markets Mixed:
Emerging markets showing some resilience: EEM (-2.80%), VWO (-2.75%)
European markets: EZU (+2.15%), FEZ (+3.00%) - European markets outperforming US
Asian markets showing strength: EWJ (+1.85%), EWZ (+2.94%)
Fixed Income Under Pressure:
Most bond ETFs in red: TLT (-2.51%), BND (-0.90%)
Limited safe haven effect in traditional bond markets
Alternative Investments
Precious Metals Strong:
Gold and gold miners outperforming: GLD (+1.95%), GDX (+4.83%)
Silver even stronger: SLV (+4.52%)
Shows classic flight to precious metals during market uncertainty
Crypto Assets Mixed:
Bitcoin-related ETFs showing some strength: IBIT (+3.19%), FBTC (+3.35%)
Crypto performing better than equities in this pullback
Key Takeaways
Defensive Positioning:
Clear rotation from risk assets to defensive positions
Precious metals, inverse ETFs, and volatility products leading
Global Divergence:
US markets underperforming international markets, especially Europe and some Asian markets
Sector Rotation:
Movement from growth/tech/financial sectors toward defensive sectors
Healthcare holding up relatively well compared to other sectors
Leverage Magnifying Losses:
Leveraged ETFs showing outsized moves (both up and down)
TQQQ (-10.02%), UPRO (-9.42%) vs. inverse leveraged ETFs up significantly
This ETF heatmap confirms the defensive rotation we saw in individual stocks, with investors seeking safety in gold, volatility hedges, and inverse positions while reducing exposure to US equities, particularly in financials and technology.
Global Overview
Foreign ADR stocks listed on NYSE, NASDAQ & AMEX categorized by geographic location. Reviewing a global heatmap like this weekly is valuable for investors because it offers insights into international markets, helping to:
Identify Global Trends: Spot which regions or countries are performing well or underperforming.
Assess Sector and Regional Performance: Understand how industries are faring across different regions.
Diversify Portfolios: Uncover opportunities in emerging or developed markets for greater diversification.
Gauge Global Sentiment: Recognize the impact of macroeconomic events on specific regions.
Align with Global Strategies: Refine investment strategies based on regional strengths or weaknesses.
This overview ensures investors stay informed about global opportunities and risks, complementing their domestic market analysis.
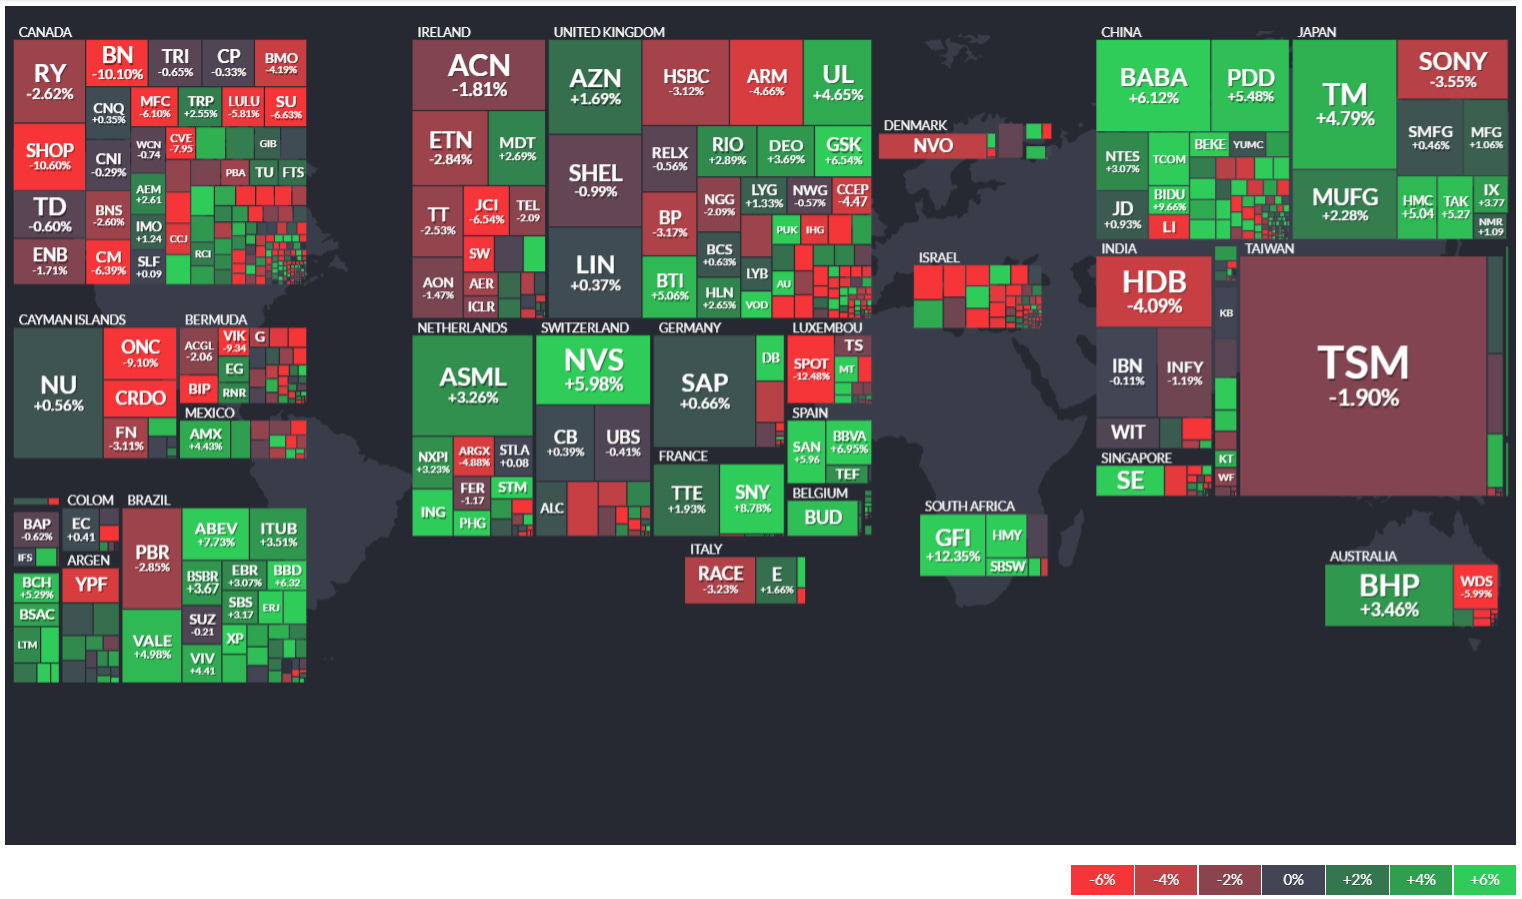
Based on this global ADR heatmap, here are the key insights about international stock performance by region:
Regional Trends
Canada Under Pressure:
Significant weakness with Royal Bank (RY -2.62%), TD (-0.60%)
Bank of Nova Scotia (BN) particularly hard hit at -10.10%
Shopify (SHOP) down sharply at -10.60%
Energy names like Canadian Natural (CNQ) holding up better (+0.35%)
Europe Showing Strength:
Netherlands: ASML (+3.26%) - semiconductor equipment maker outperforming
Switzerland: Novartis (NVS +5.98%) - healthcare strength continues globally
United Kingdom: AstraZeneca (AZN +1.69%), Unilever (UL +4.65%) - defensive names performing well
Germany: SAP (+0.66%) showing modest gains
China Mixed but with Bright Spots:
Alibaba (BABA +6.12%) - significant outperformance
PDD Holdings (PDD +5.48%) - Chinese e-commerce showing strength
JD.com (JD) and others showing mixed performance
Japan Mixed:
Toyota (TM +4.79%) and MUFG (+2.28%) performing well
Sony (SONY -3.55%) underperforming
Taiwan Semiconductor (TSM -1.90%) - slight weakness in line with global chip sector
Brazil/Latin America Strong:
VALE (+4.98%) - mining giant outperforming
ABEV (+7.75%) - Brazilian beverage company showing strength
Sector Insights Across Regions
Global Banking Mixed:
Canadian banks weak (BN, RY)
European banks varied (HSBC -3.12%, UBS -0.41%)
Japanese banks stronger (MUFG +2.28%)
Healthcare/Pharma Strong Globally:
NVS (+5.98%), AZN (+1.69%), GSK (+6.54%)
Confirms the defensive healthcare trend seen in US markets
Technology Divergence:
European tech stronger (ASML +3.26%)
Asian tech mixed (BABA +6.12%, TSM -1.90%, SONY -3.55%)
Natural Resources Outperforming:
Mining and commodities companies showing strength globally
VALE (+4.98%), BHP (+3.46%), RIO (+2.89%)
Aligns with strength in gold and materials seen in US markets
Key Takeaways
Geographic Rotation:
Emerging markets (particularly China, Brazil) showing more strength than North America
European defensive names outperforming
Canadian Weakness:
Canadian market notably weaker, especially in financials and tech (SHOP)
Global Sector Consistency:
The healthcare and consumer staples strength seen in US markets is consistent globally
Mining and materials showing strength worldwide
Banking sector under pressure in multiple regions
Chinese Internet Rebound:
Chinese tech/internet names like BABA and PDD showing significant strength, bucking the global tech selloff
European Resilience:
European markets generally outperforming, with pharmaceutical and consumer staples names leading
This global heatmap confirms that the market uncertainty is worldwide but with notable geographic differences - with North American markets (US and Canada) experiencing more pressure while parts of Europe, China, and Brazil are showing relative strength. The sector rotation into defensives, healthcare, and precious metals/mining appears to be a global phenomenon.

US Investor Sentiment
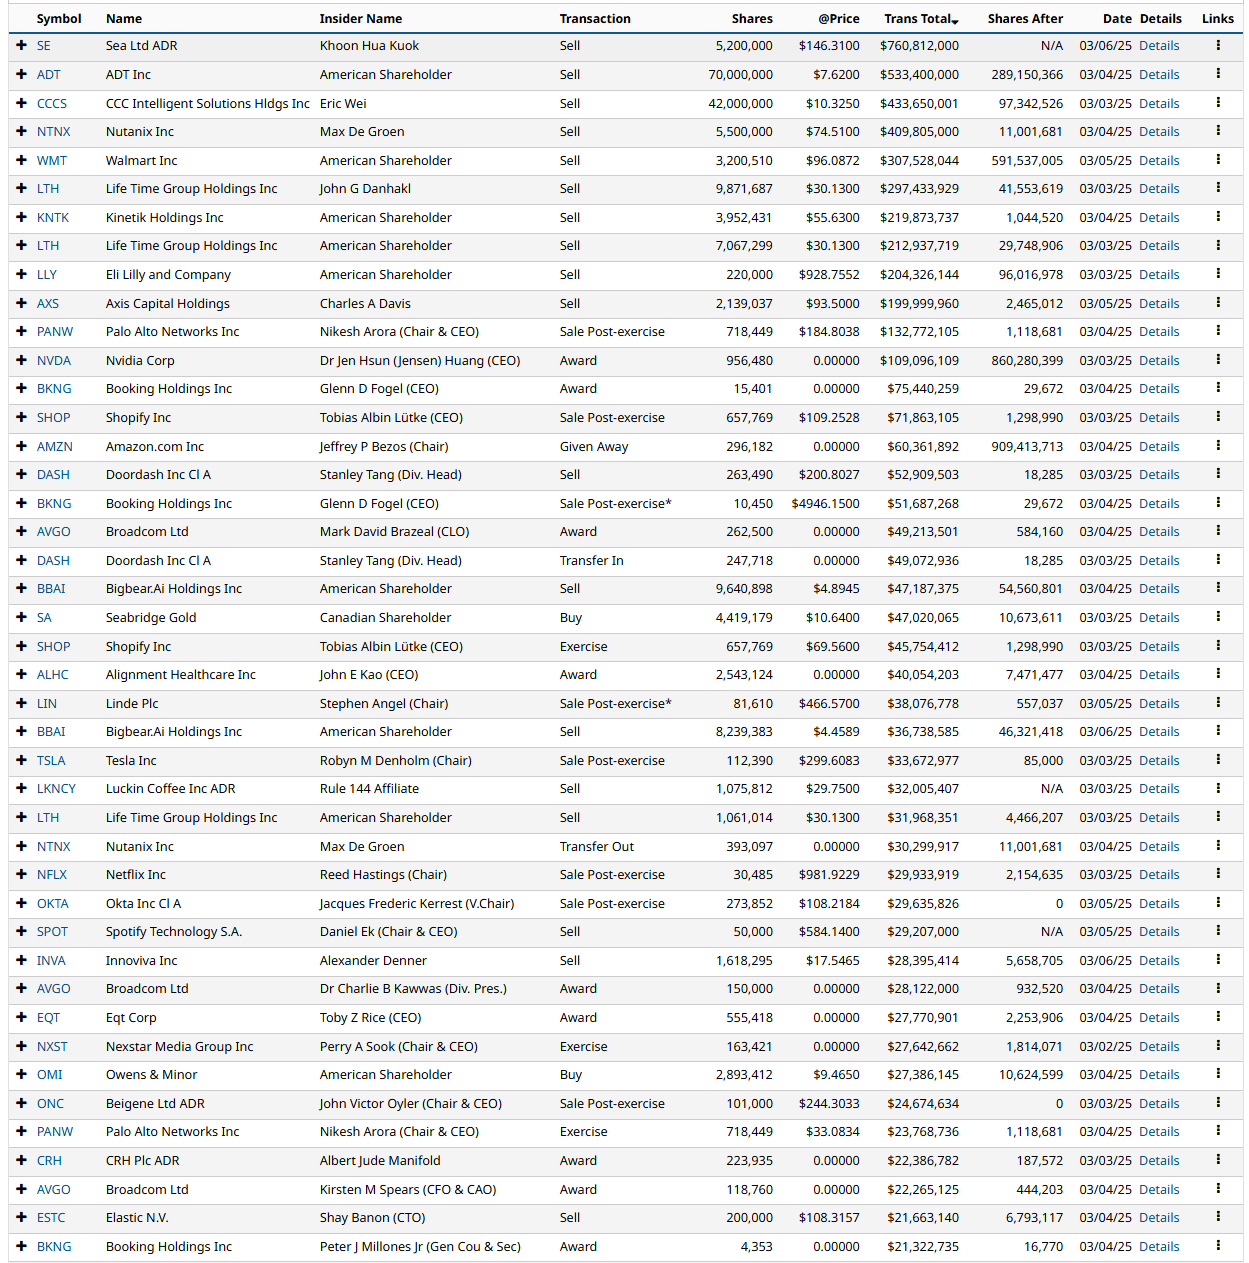
Insider Trading
Insider trading occurs when a company’s leaders or major shareholders trade stock based on non-public information. Tracking these trades can reveal insider expectations about the company’s future. For example, large purchases before an earnings report or drug trial results might indicate confidence in upcoming good news.
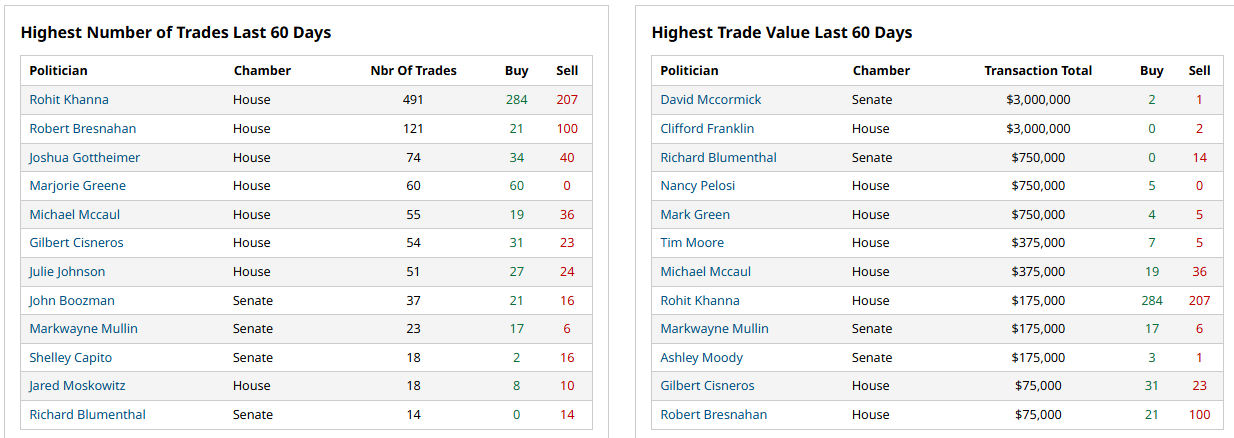
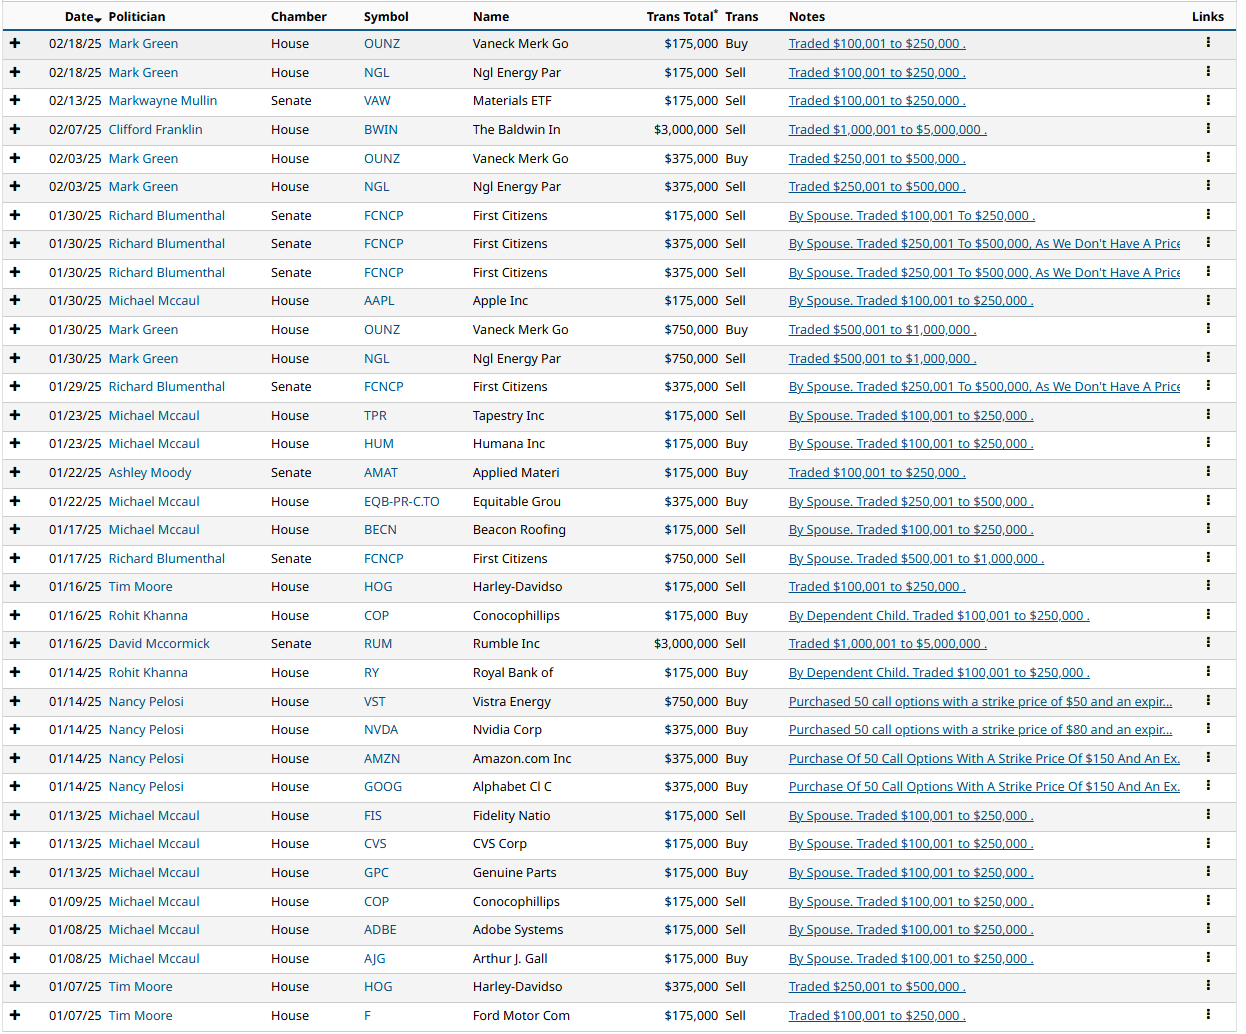
Politician Trading
Tracking stock trades by members of Congress and other elected officials can provide valuable market insights, as politicians often have access to privileged information about upcoming legislation, regulatory changes, and government contracts that may impact specific companies or entire sectors. While officials are prohibited from trading directly on non-public information, their investment patterns may still reflect broader knowledge of policy directions and economic trends before these become widely known. For example, significant purchases in defense stocks before a military spending bill or healthcare positions ahead of industry regulation can signal potential market movements. Monitoring these trading patterns may help investors identify sectors poised for policy-driven growth or headwinds.
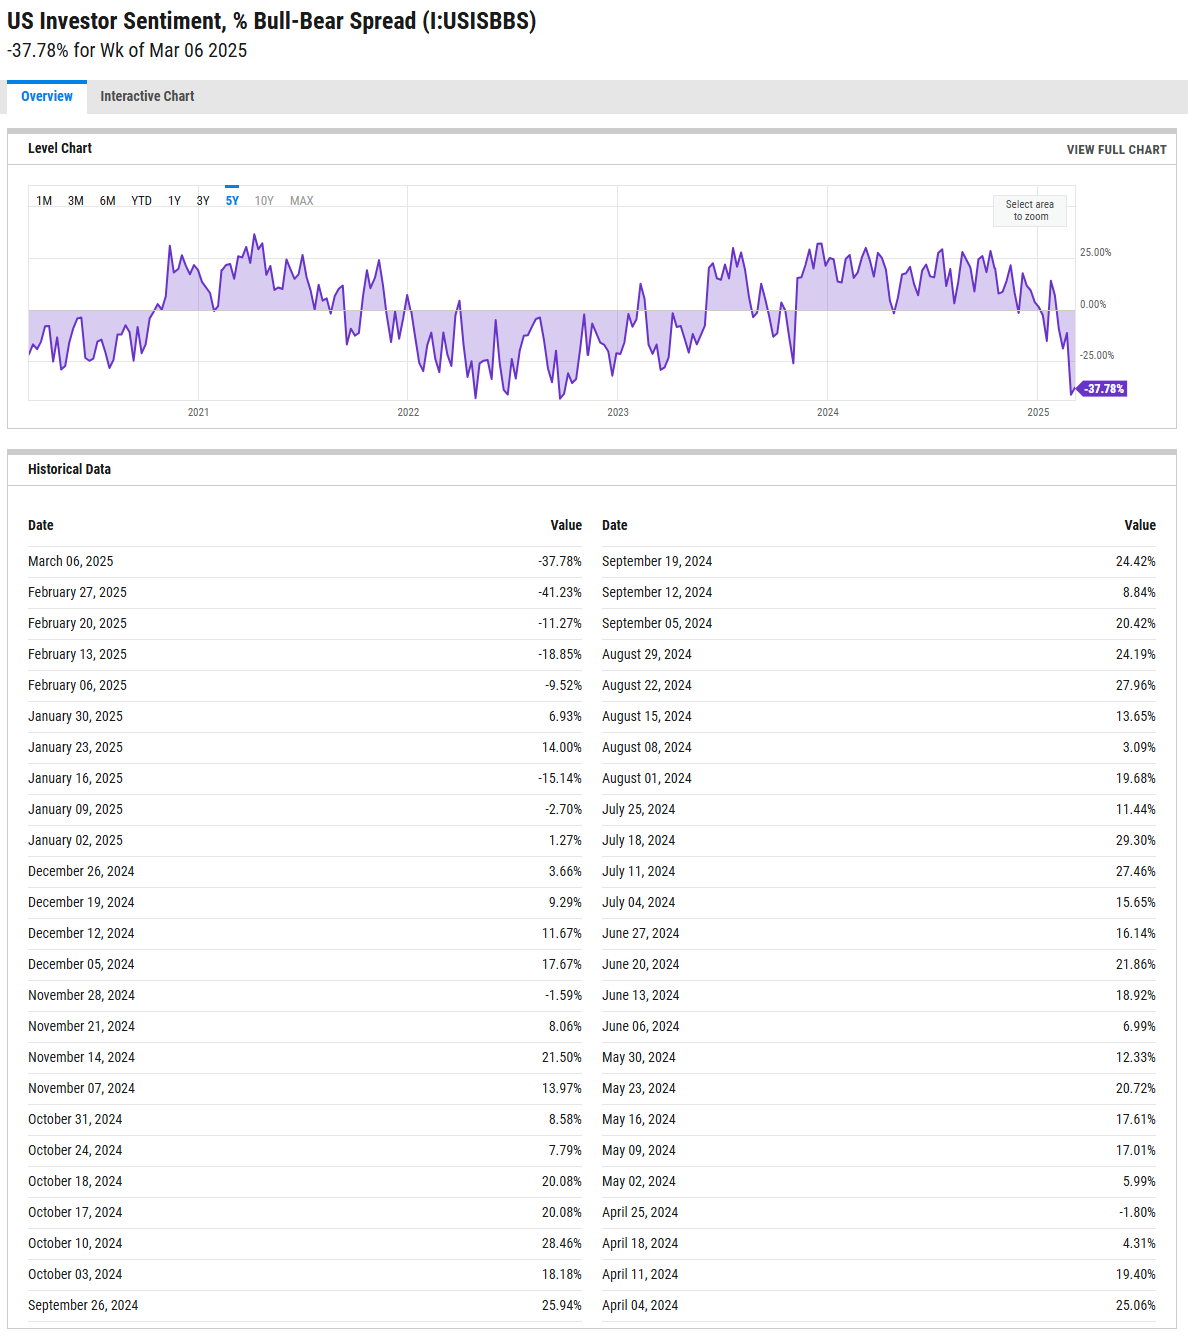
%Bull-Bear Spread
The %Bull-Bear Spread chart is a sentiment indicator that shows the difference between the percentage of bullish and bearish investors, often derived from surveys or sentiment data, such as the AAII (American Association of Individual Investors) sentiment survey. This spread tells investors about the prevailing mood in the market and can provide insights into market extremes and potential turning points.
Bullish or Bearish Sentiment:
When the spread is positive, it means more investors are bullish than bearish, indicating optimism about the market’s direction.
A negative spread indicates more bearish sentiment, meaning more investors expect the market to decline.
Contrarian Indicator:
The %Bull-Bear Spread is often used as a contrarian indicator. For example, extremely high levels of bullish sentiment might suggest that the market is overly optimistic and could be due for a correction.
Similarly, when bearish sentiment is extremely high, it might indicate that the market is overly pessimistic, and a rally could be on the horizon.
Market Extremes and Reversals:
Historically, extreme values of the spread (both positive and negative) can signal turning points in the market. A very high positive spread can signal market exuberance, while a very low or negative spread may indicate fear or capitulation.
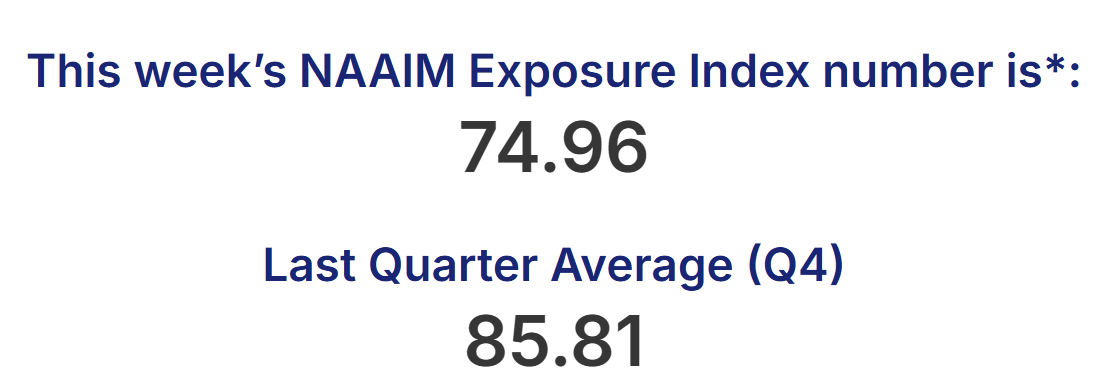
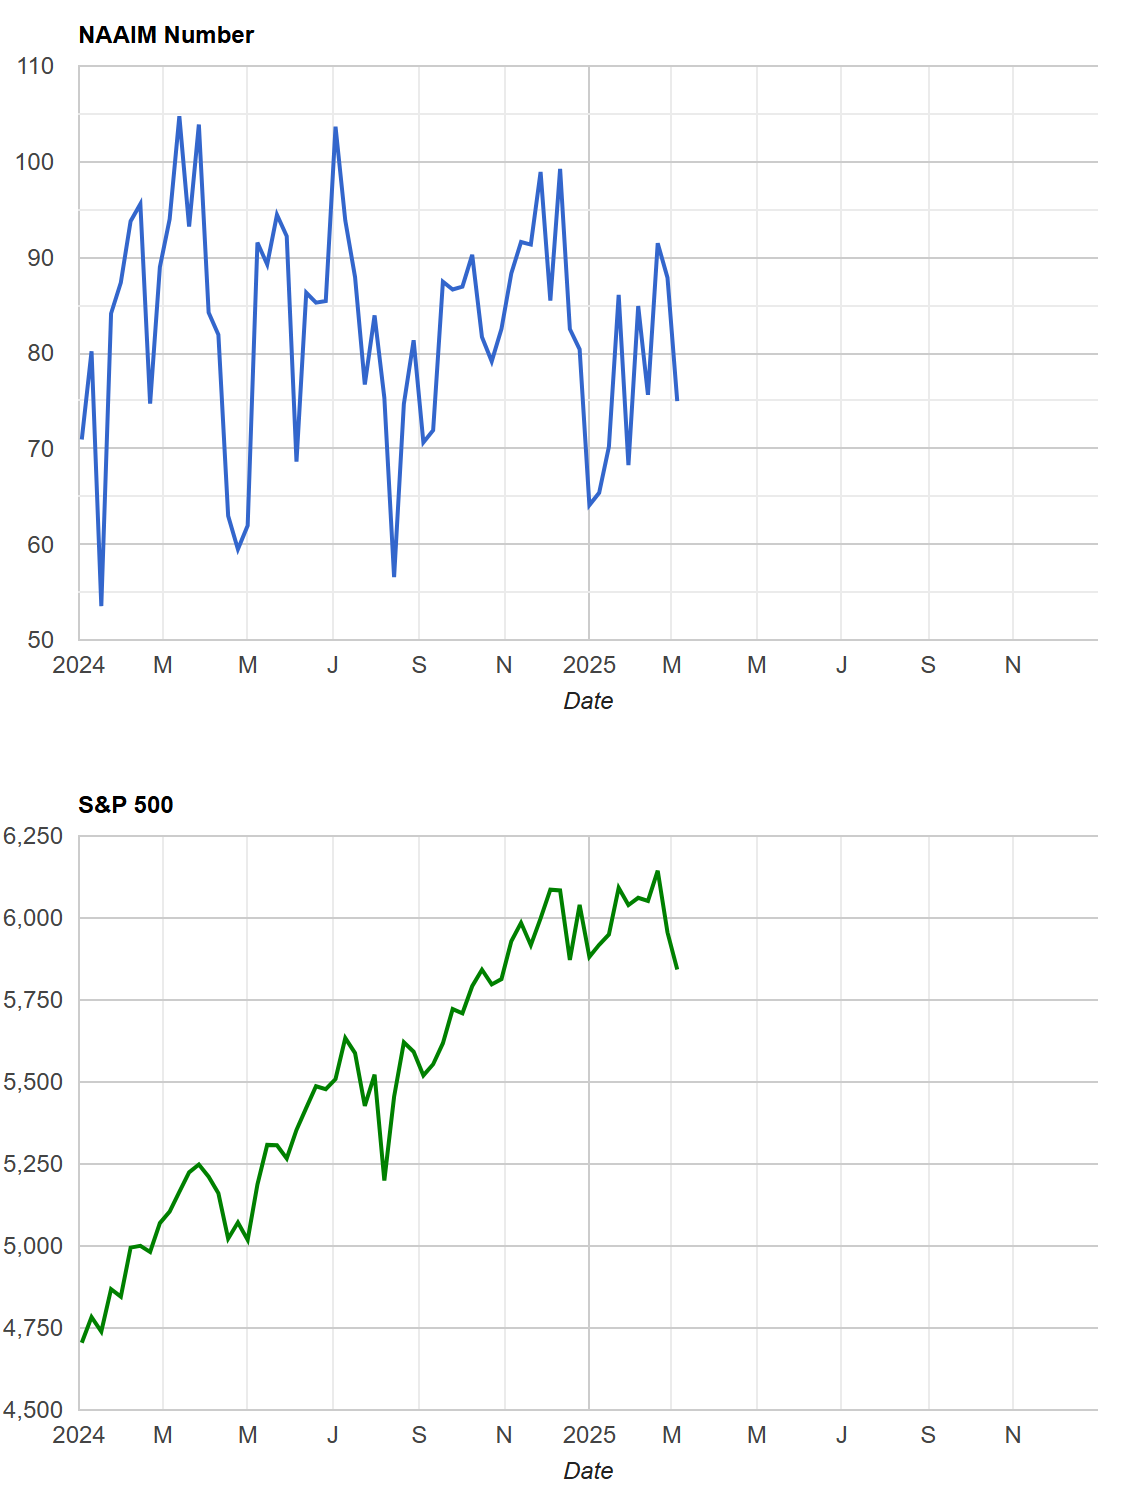
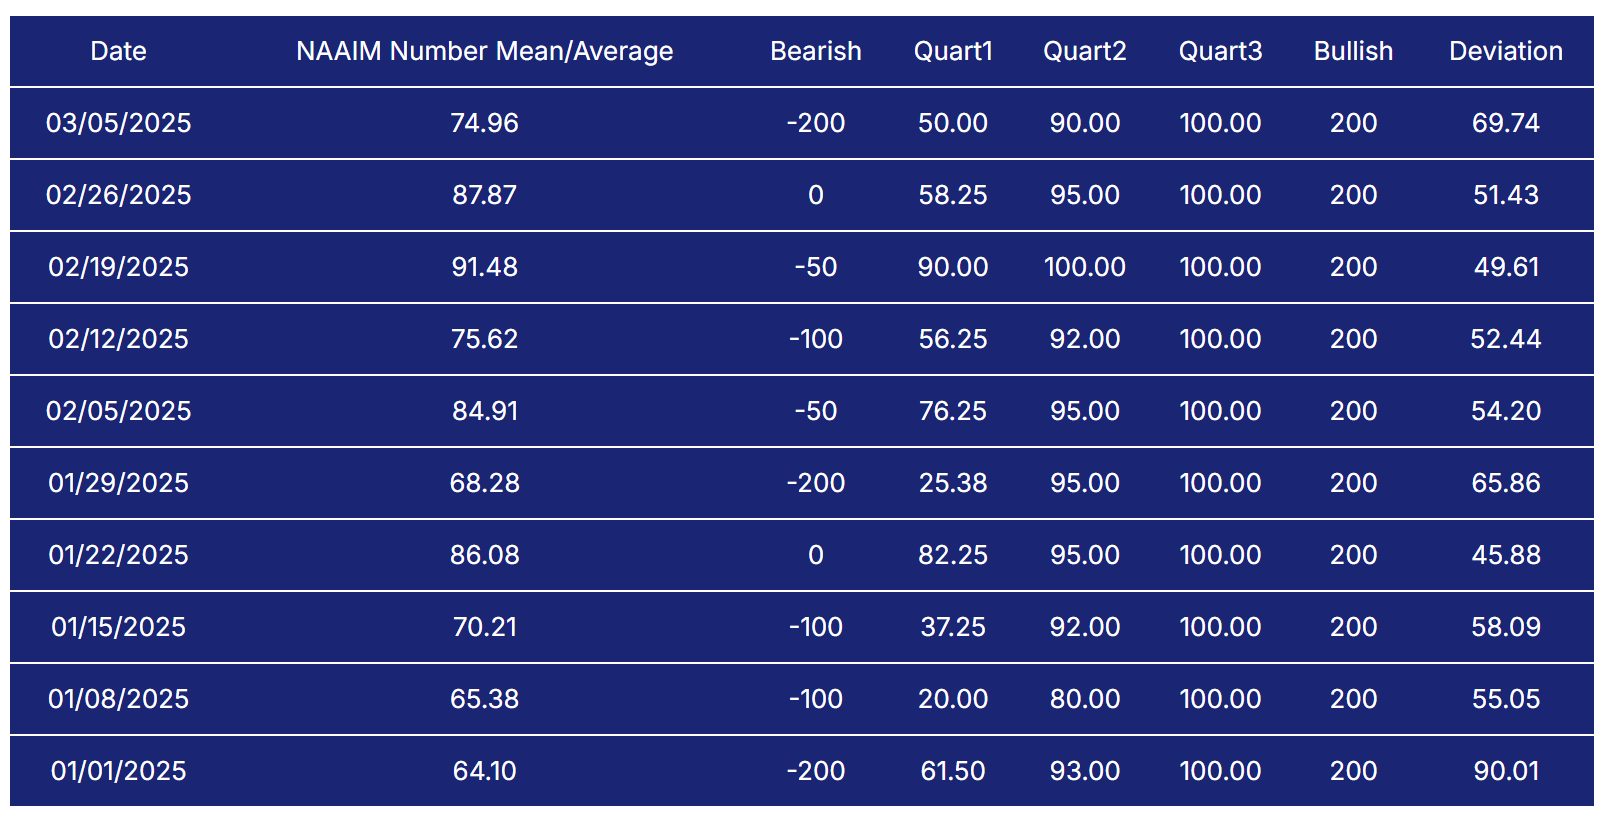
NAAIM Exposure Index
The NAAIM Exposure Index (National Association of Active Investment Managers Exposure Index) measures the average exposure to U.S. equity markets as reported by its member firms. These are typically active money managers who provide their equity exposure levels weekly. The index offers insight into how much these managers are investing in equities at any given time, ranging from being fully short (-100%) to leveraged long (up to +200%).
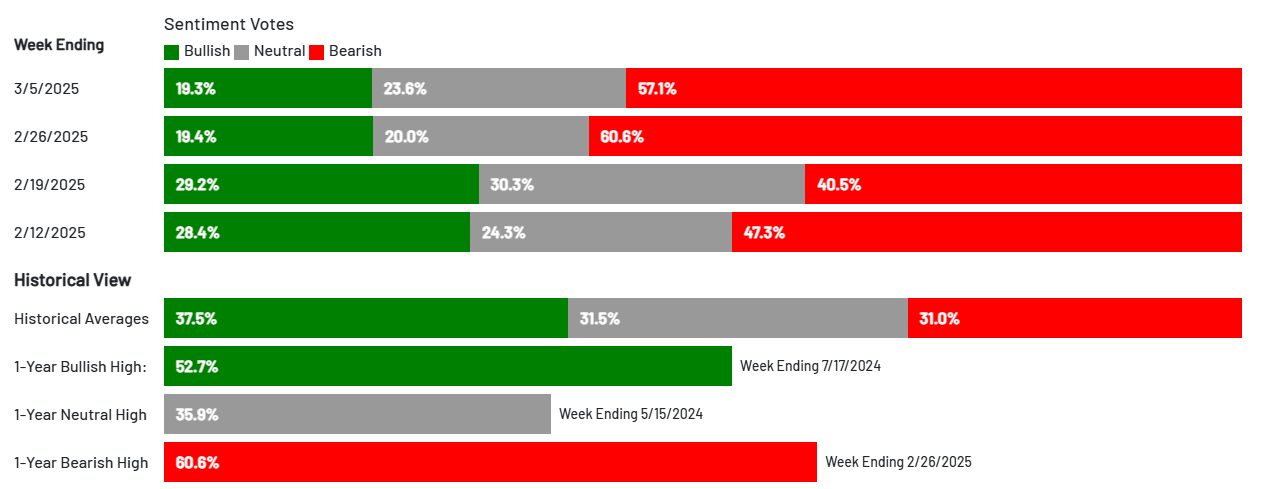
AAII Investor Sentiment Survey
The AAII Investor Sentiment Survey is a weekly survey conducted by the American Association of Individual Investors (AAII) to gauge the mood of individual investors regarding the direction of the stock market over the next six months. It provides insights into whether investors are feeling bullish (expecting the market to rise), bearish (expecting the market to fall), or neutral (expecting the market to stay about the same).
Key Points:
Bullish Sentiment: Reflects the percentage of investors who believe the stock market will rise in the next six months.
Bearish Sentiment: Represents those who expect a decline.
Neutral Sentiment: Reflects investors who anticipate little to no market movement.
The survey is widely followed as a contrarian indicator, meaning that extreme levels of bullishness or bearishness can sometimes signal market turning points. For example, when a large number of investors are overly optimistic (high bullish sentiment), it could suggest a market top, while excessive pessimism (high bearish sentiment) may indicate a market bottom is near.
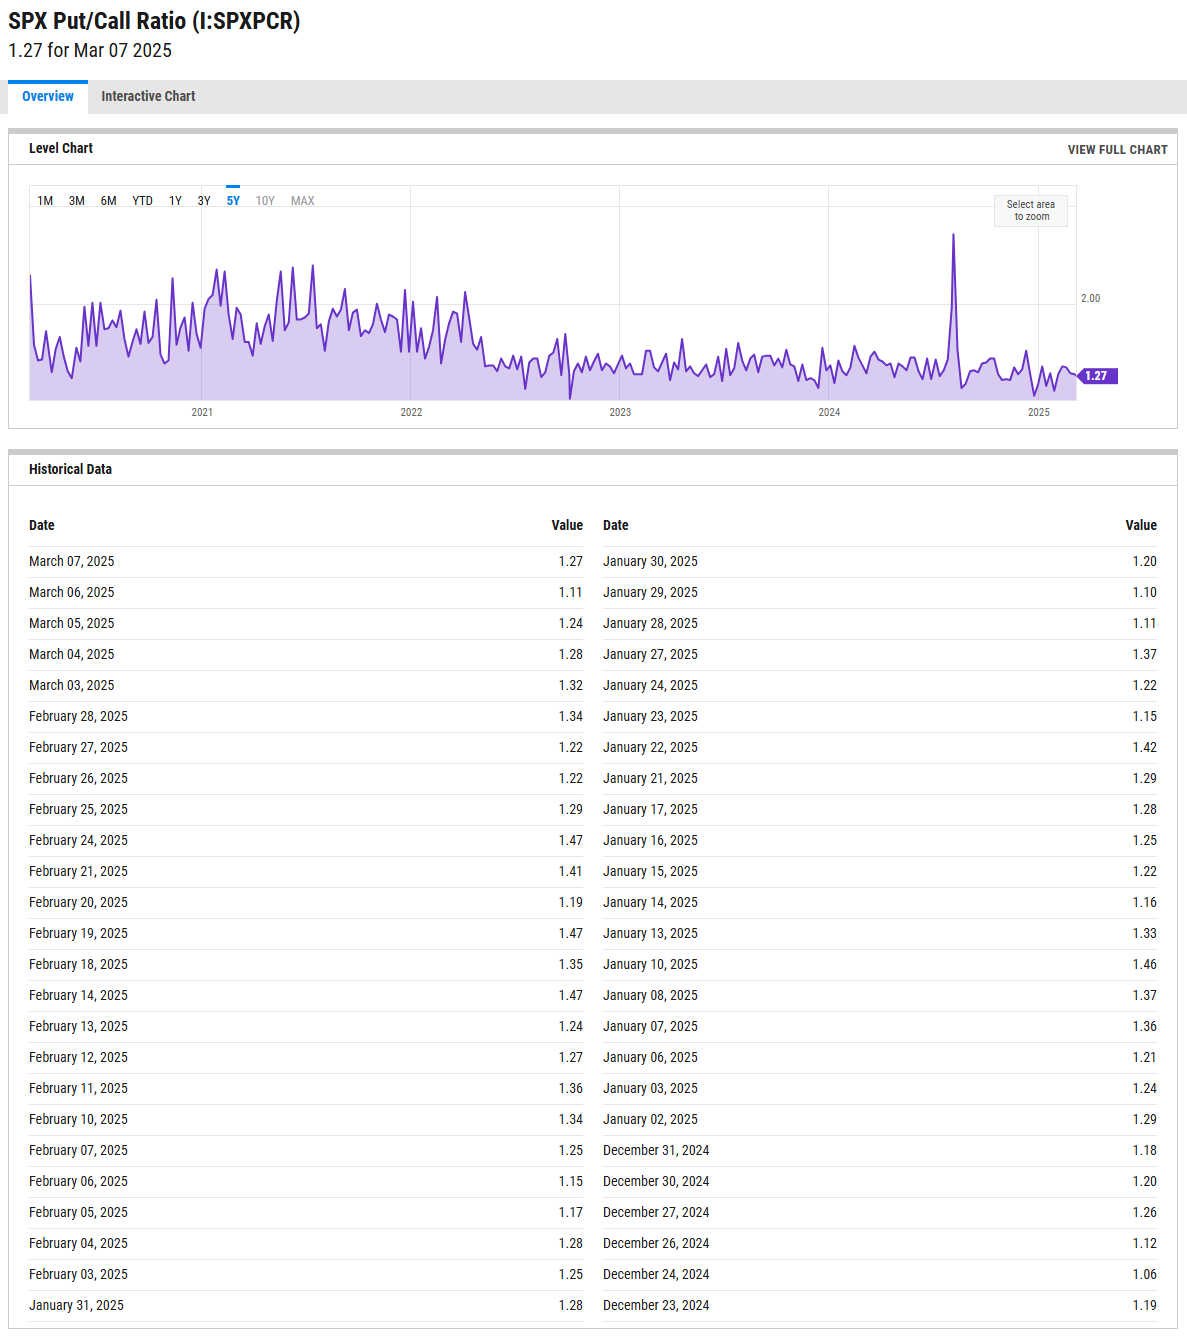
SPX Put/Call Ratio
The SPX Put/Call Ratio is an indicator that is used to gauge market sentiment. This is calculated as the ratio between trading S&P 500 put options and S&P call options. A high put/call ratio can indicate fear in the markets, while a low ratio indicates confidence. For example, in 2015, the Put-Call ratio was as high as 3.77 because of market fears stemming from various global economic issues like a GDP growth slowdown in China and a Greek debt default.
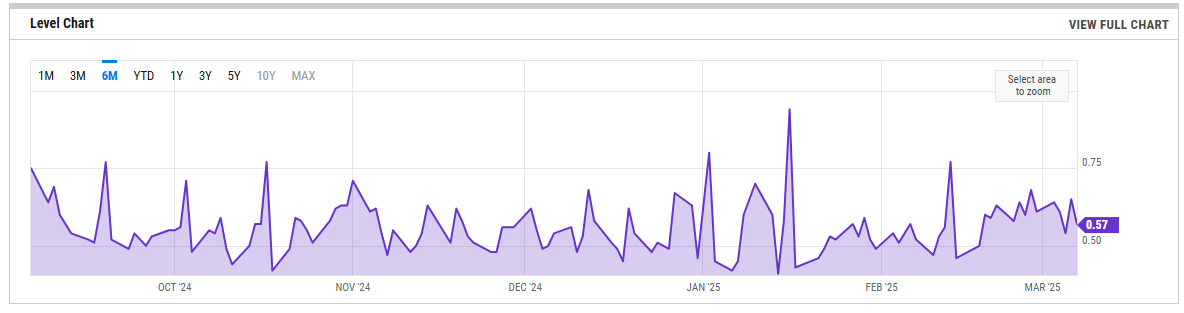
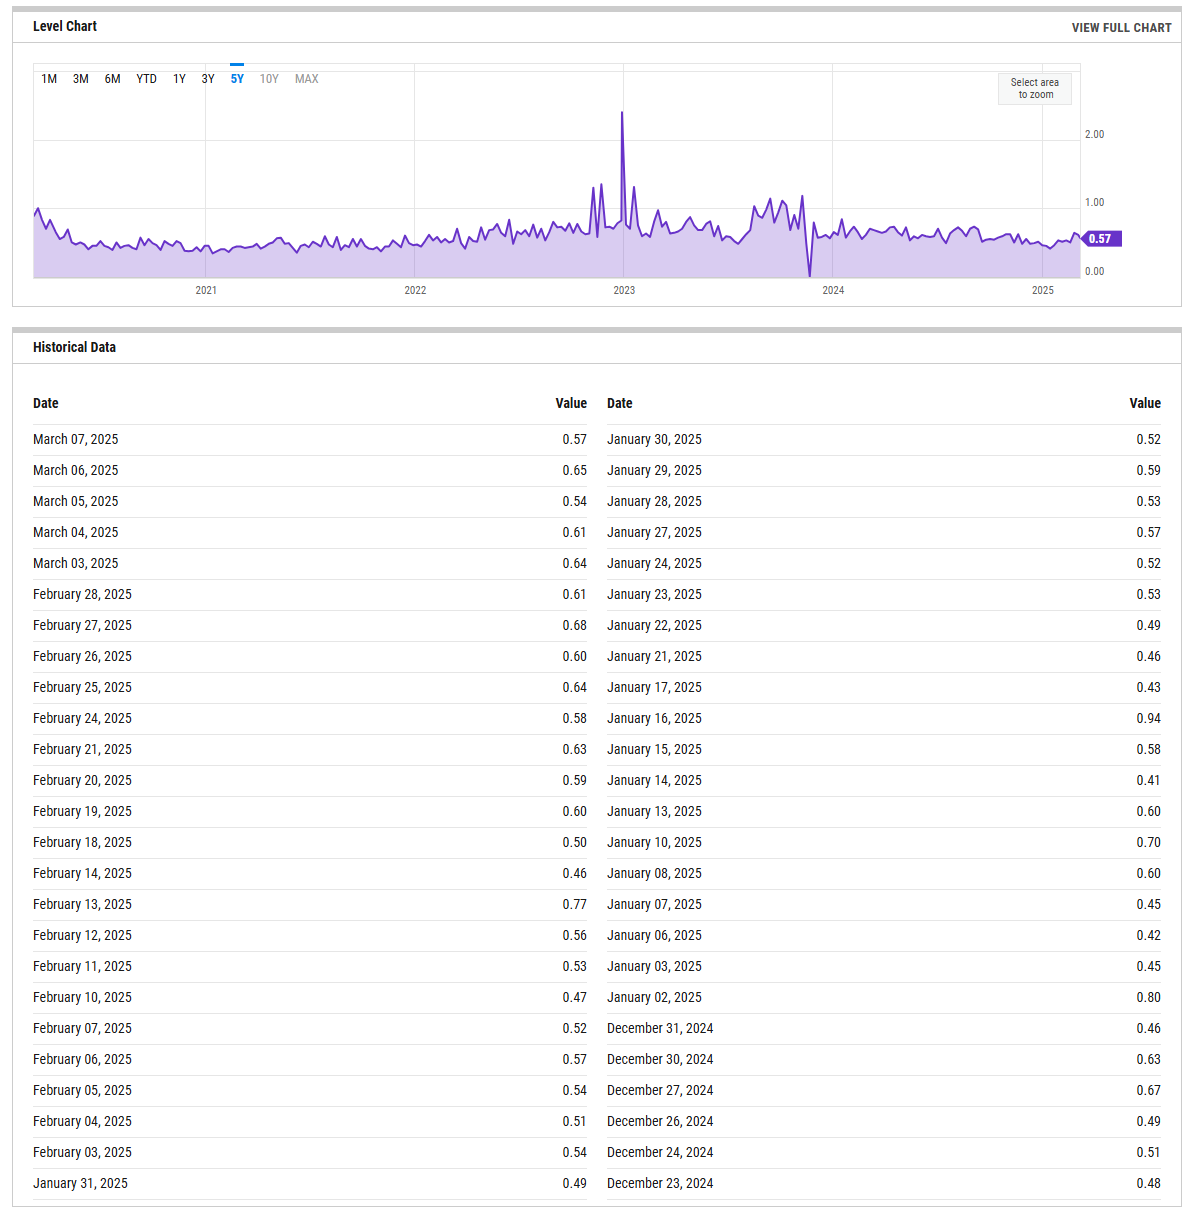
CBOE Equity Put/Call Ratio
The CBOE (Chicago Board Options Exchange) equity put/call ratio is a sentiment indicator used by traders and analysts to gauge market sentiment and potential shifts in investor behavior. It is calculated by dividing the volume of put options by the volume of call options on equities. Here’s what it reveals and how it is generally interpreted:
High Put/Call Ratio: When the put/call ratio is high (above 1.0), it suggests that there is more demand for put options than call options. This typically reflects a more bearish sentiment, as investors may be hedging against potential declines or expecting the market to fall.
Low Put/Call Ratio: Conversely, a low put/call ratio (below 0.7) indicates a higher volume of call options compared to puts, reflecting bullish sentiment. Investors may be expecting upward momentum and are positioning themselves to profit from price gains
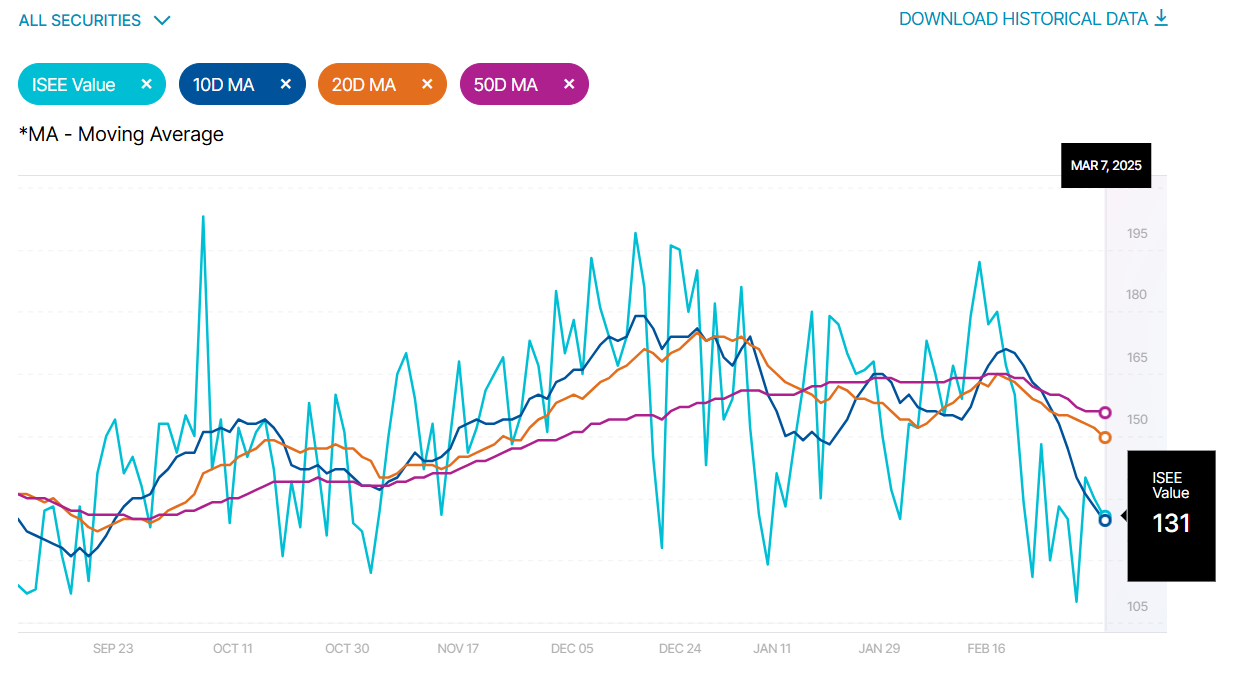
ISEE Sentiment Index
The ISEE (International Securities Exchange Sentiment) Index is a measure of investor sentiment derived from options trading. Unlike traditional put/call ratios, the ISEE Index focuses only on opening long customer transactions and is adjusted to remove market-maker and firm trades, providing a purer sentiment reading.
The ISEE Index typically ranges from 0 to 200, with readings above 100 indicating more call options being bought relative to put options, suggesting bullish sentiment. Conversely, readings below 100 suggest bearish sentiment, with more puts being purchased relative to calls.
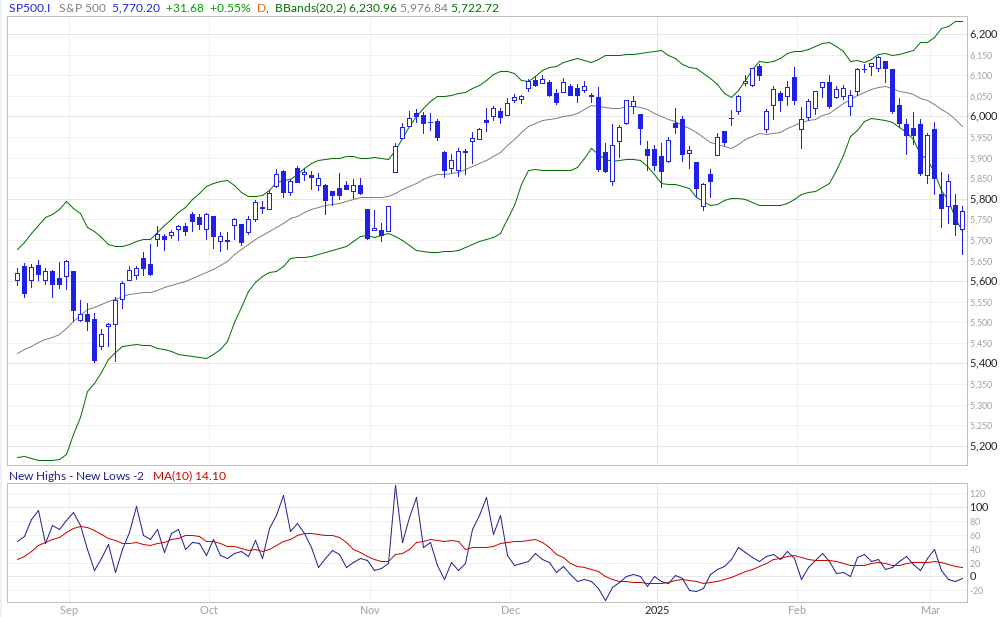
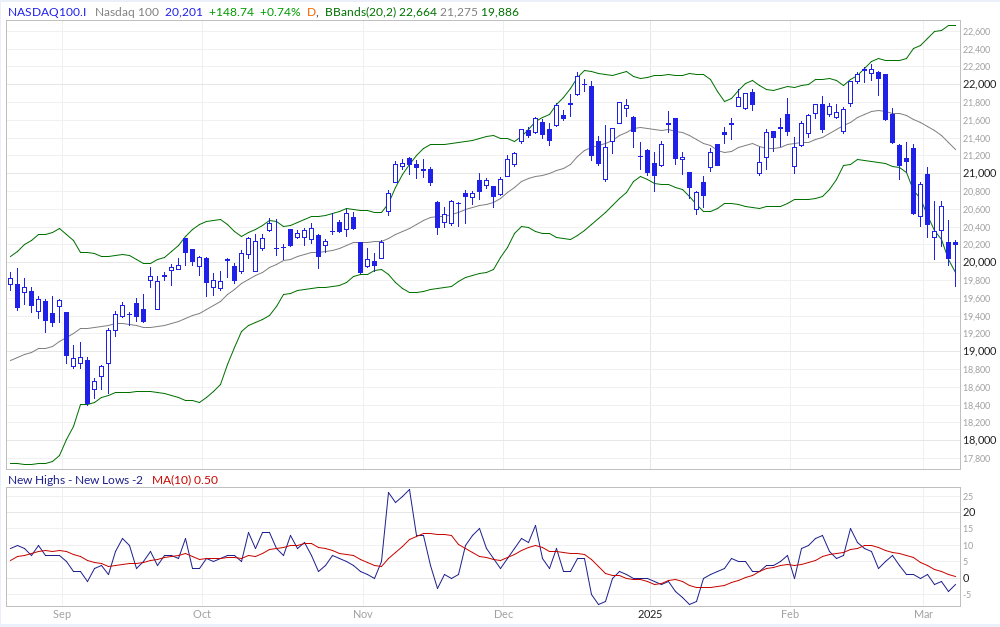
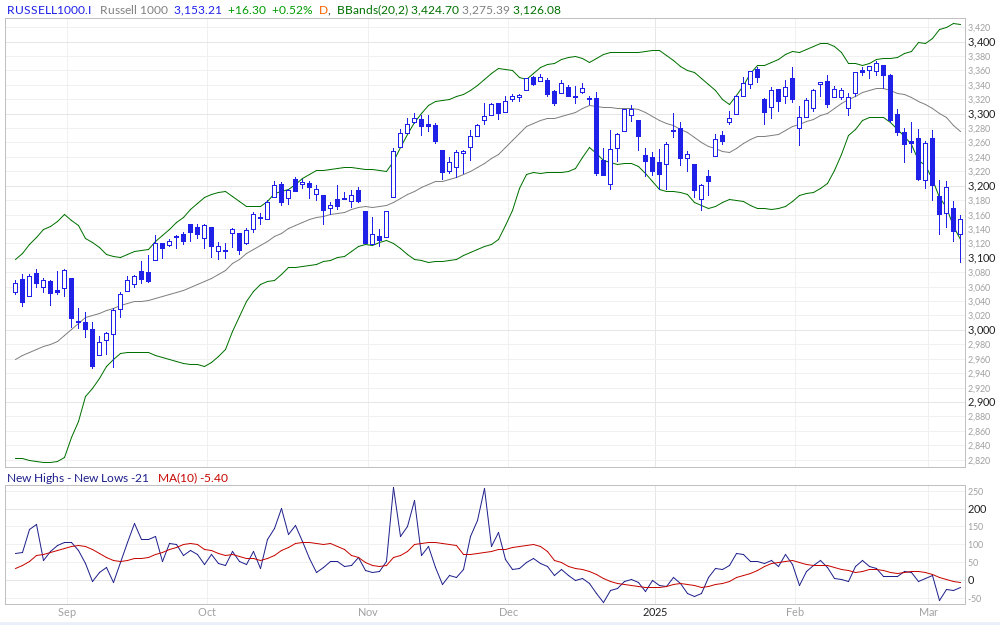
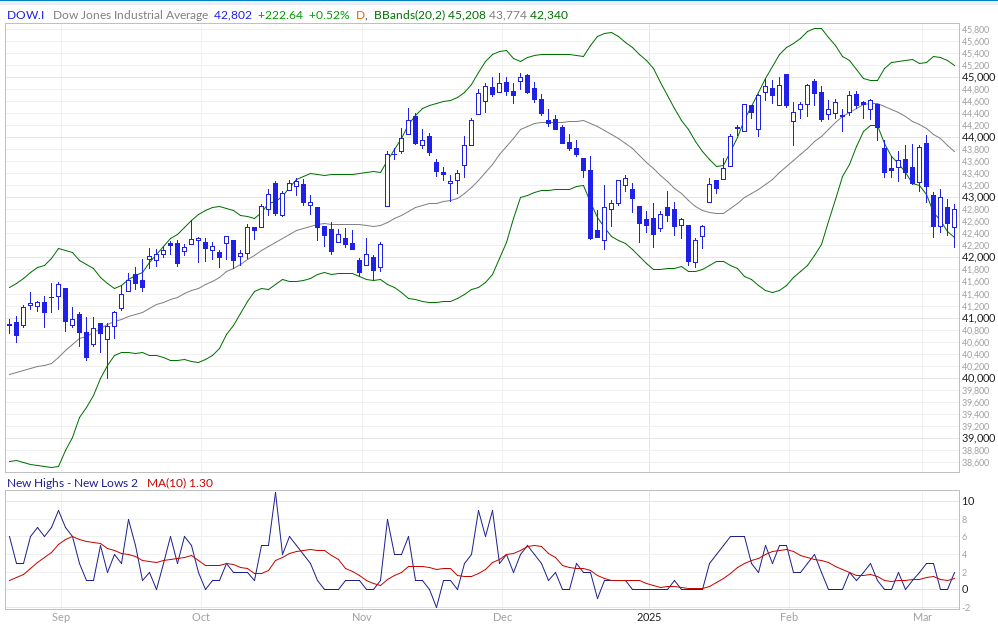
New Highs - New Lows
The New Highs - New Lows indicator (NH-NL) displays the daily difference between the number of stocks reaching new 52-week highs and the number of stocks reaching new 52-week lows. The NH-NL indicator generally reaches its extreme lows slightly before a major market bottom. As the market then turns up from the major bottom, the indicator jumps up rapidly. During this period, many new stocks are making new highs because it's easy to make a new high when prices have been depressed for a long time. The NH-NL indicator oscillates around zero. If the indicator is positive, the bulls are in control. If it is negative, the bears are in control. As the cycle matures, a divergence often occurs as fewer and fewer stocks are making new highs (the indicator falls), yet the market indices continue to reach new highs. This is a classic bearish divergence that indicates that the current upward trend is weak and may reverse.
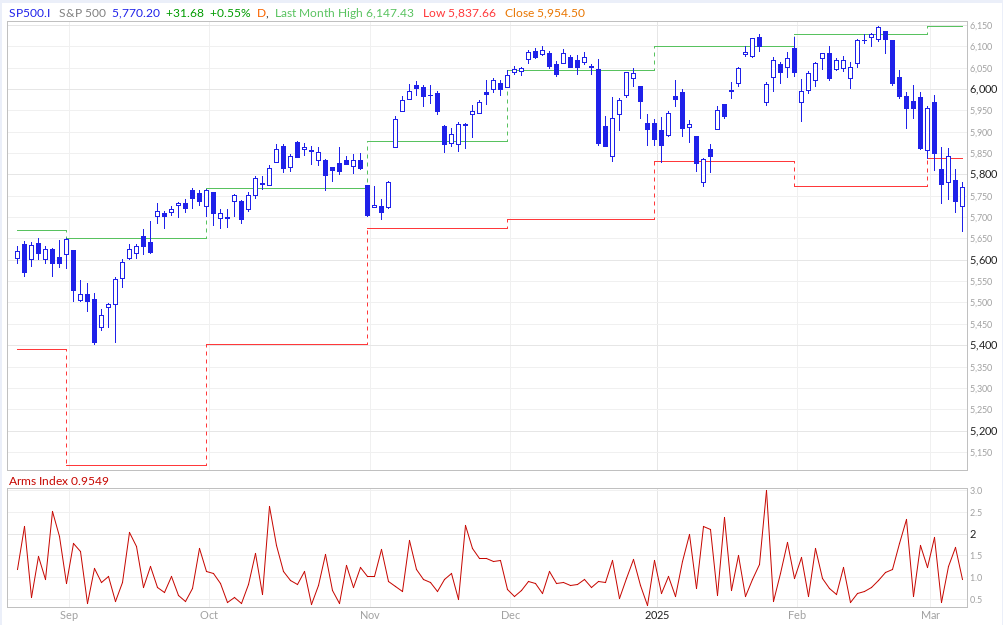
ARMS Index
The Arms Index, also known as the TRIN (Short-Term TRading INdex), was developed by Richard Arms in the 1960s. It is calculated by dividing the ratio of advancing stocks to declining stocks by the ratio of advancing volume to declining volume. Interpreting the Arms Index involves looking at its value in relation to certain thresholds. A value below "1" is considered bullish, indicating that advancing stocks and volume dominate the market. Conversely, a value above "1" is considered bearish, suggesting that declining stocks and volume are more prevalent. Extremely low values (below 0.5) or high values (above 2) are often seen as potential reversal signals.
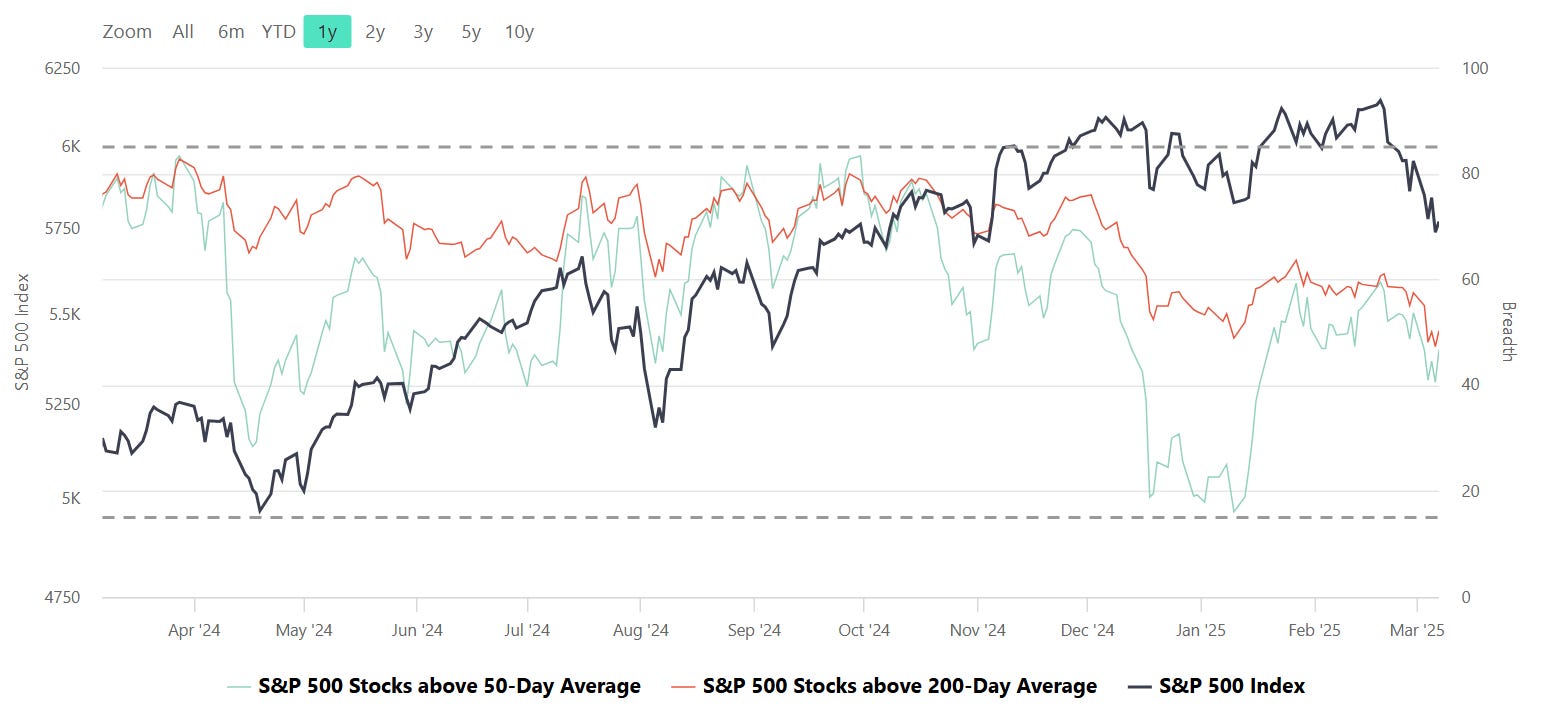
S&P Breadth
Breadth, in the context of stock market analysis, refers to the measure of how many stocks in a given index (such as the S&P 500) are participating in a trend, such as advancing or declining relative to a certain moving average (e.g., 50-day or 200-day).
Market Strength Assessment:
Breadth provides insight into whether a market rally or decline is broad-based or driven by only a few large-cap stocks. A rally supported by a high percentage of stocks above their 50-day or 200-day averages is generally considered healthier and more sustainable.
Early Warning Signals:
Divergences between breadth indicators and the index price can signal potential reversals. For example:
If the index is rising, but the number of stocks above their moving averages is declining, it may indicate weakening underlying strength and potential for a pullback.
Conversely, if breadth improves while the index remains flat or declines, it may suggest accumulating strength for a future rally.
Trend Confirmation:
Breadth indicators can confirm trends. For instance, a strong majority of stocks above their moving averages signals robust market momentum, providing confidence in the prevailing trend.
Identifying Overbought or Oversold Conditions:
Extremely high or low breadth readings can signal overbought or oversold conditions, which might lead to mean reversion. For example:
If nearly all stocks are above their 50-day or 200-day averages, it may suggest overbought conditions.
Conversely, extremely low levels indicate oversold conditions and potential for a bounce.
Breadth and Timing Investments:
Entry Points:
When breadth improves (e.g., more stocks move above their 50-day or 200-day moving averages) after a market pullback, it can indicate a good time to start building positions as the broader market is regaining strength.
Exit Points:
Breadth deterioration during a rally may suggest it’s time to reduce exposure, especially if only a small number of stocks are driving index gains. This is often a warning sign of an impending correction.
Volatility and Risk Management:
Weak breadth in volatile markets may prompt caution or defensive positioning. Conversely, improving breadth can justify taking on more risk during uptrends.
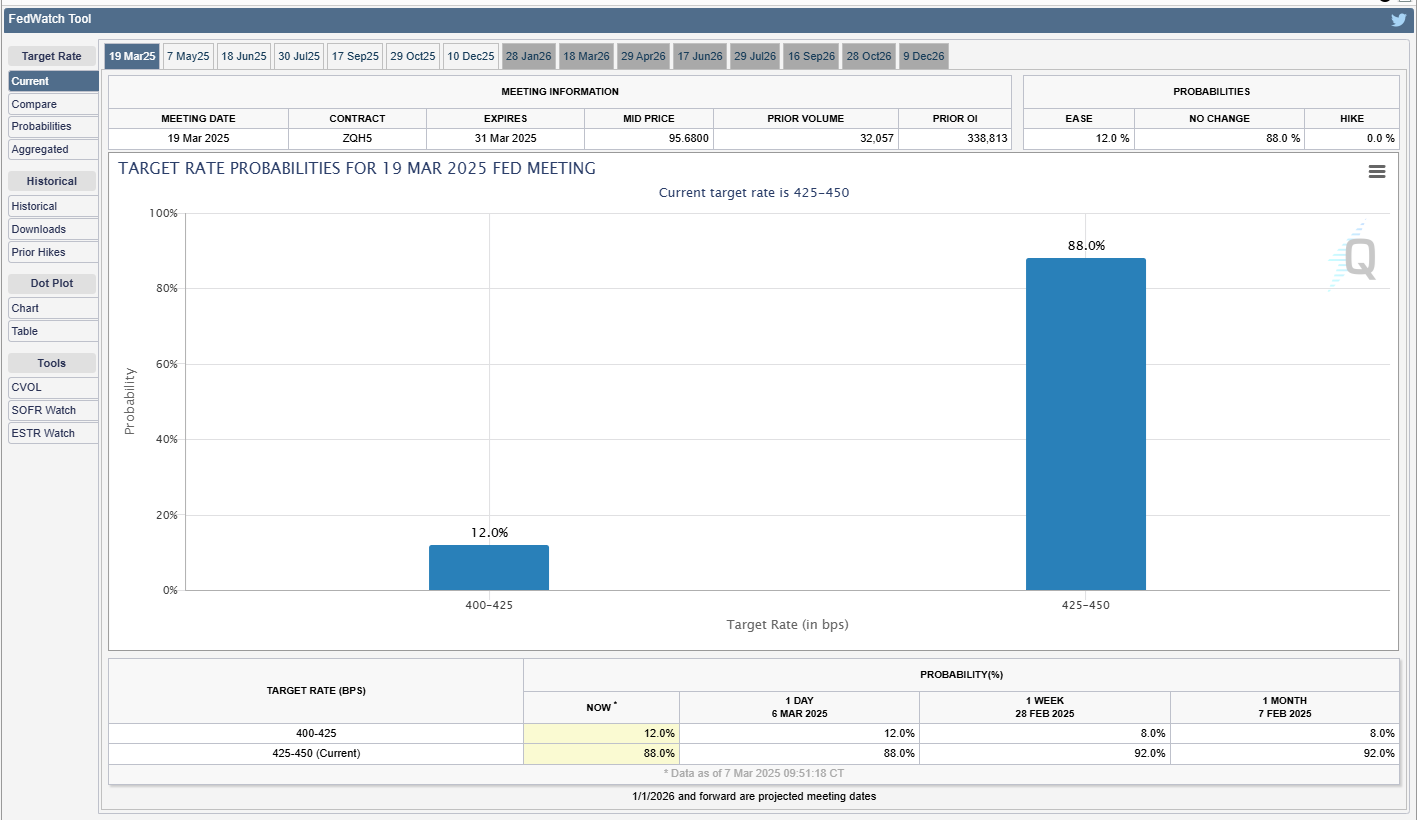
CME Fedwatch
What is the likelihood that the Fed will change the Federal target rate at upcoming FOMC meetings, according to interest rate traders? Use CME FedWatch to track the probabilities of changes to the Fed rate, as implied by 30-Day Fed Funds futures prices.
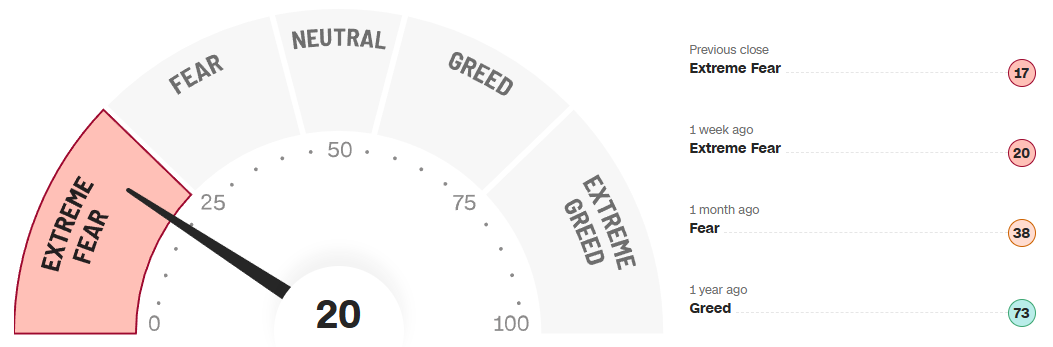
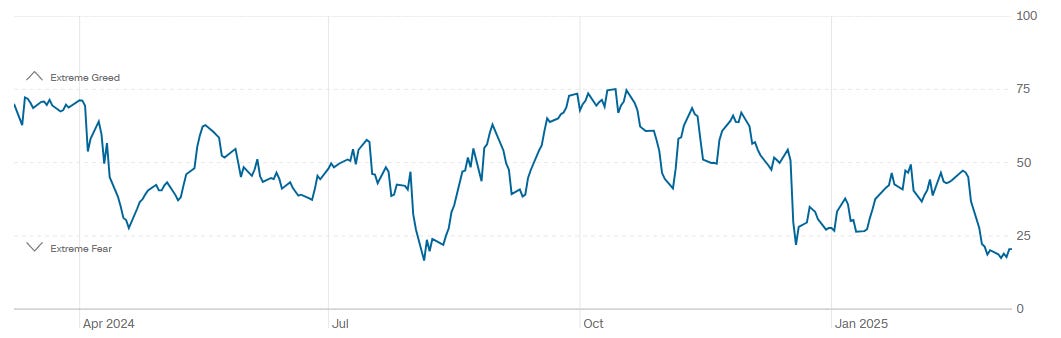
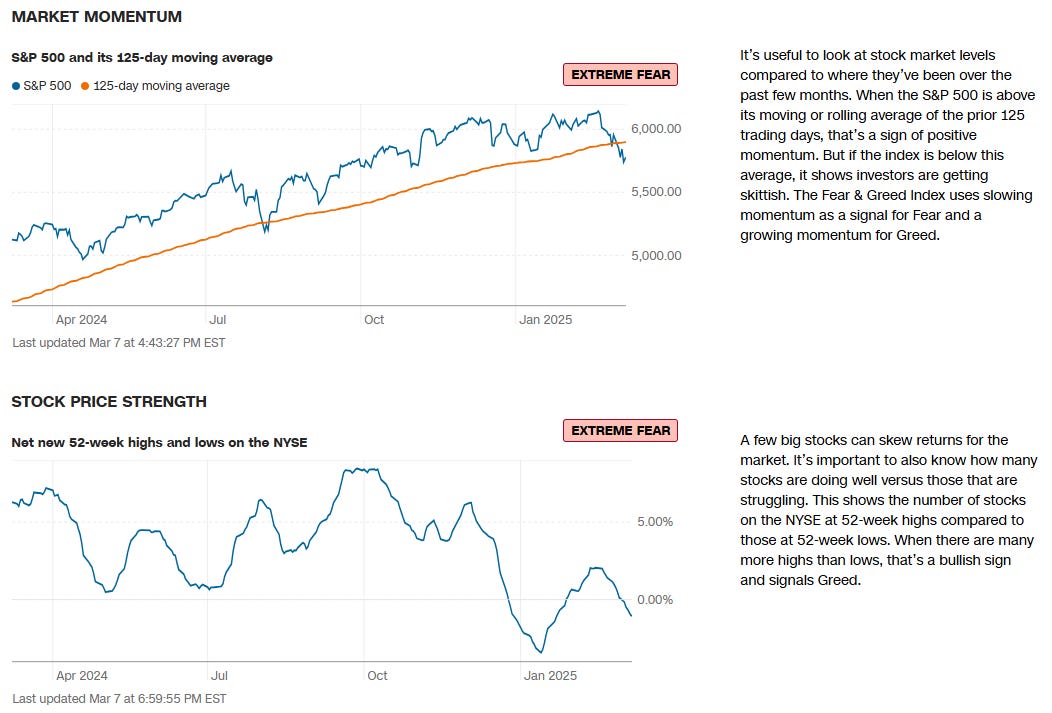
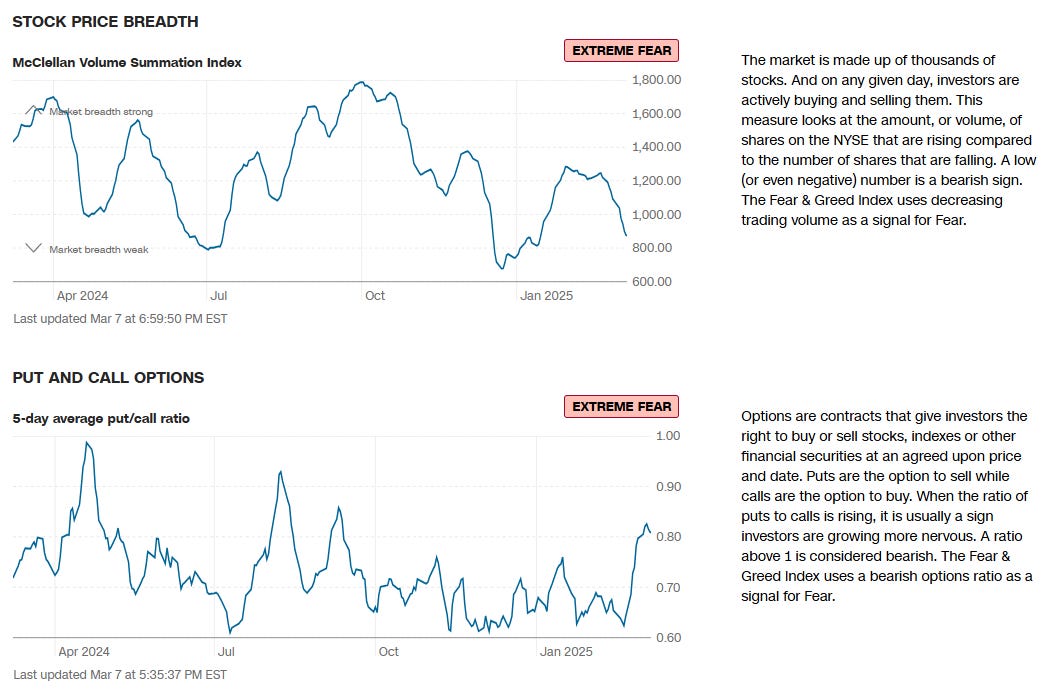
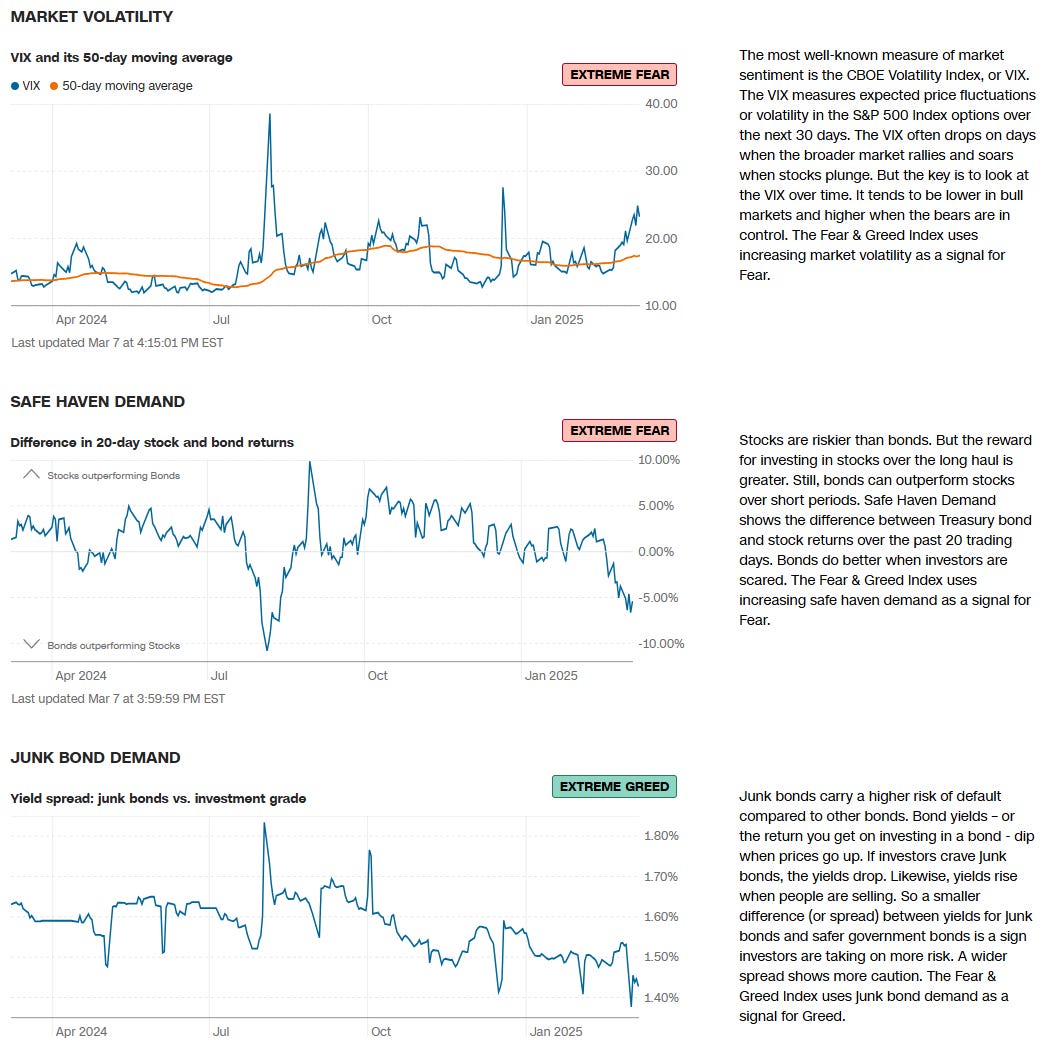
CNN Fear & Greed Constituent Data Points & Composite Index
Institutional S/R Levels for Major Indices
When you’re a large institutional player, your primary goal is to find liquidity - places to do a ton of business with the least amount of slippage possible. VolumeLeaders.com automatically identifies and visually plots the exact spots where institutions are doing business and where they are likely to return for more. It’s one of the primary reasons “support” and “resistance” concepts work and truly one of the reasons “price has memory”.
Levels from the VolumeLeaders.com platform can help you formulate trades theses about:
Where to add or take profit
Where to de-risk or hedge
What strikes to target for options
Where to expect support or resistance
And this is just a small sample; there are countless ways to leverage this information into trades that express your views on the market. The platform covers thousands of tickers on multiple timeframes to accommodate all types of traders.
SPY -0.06%↓
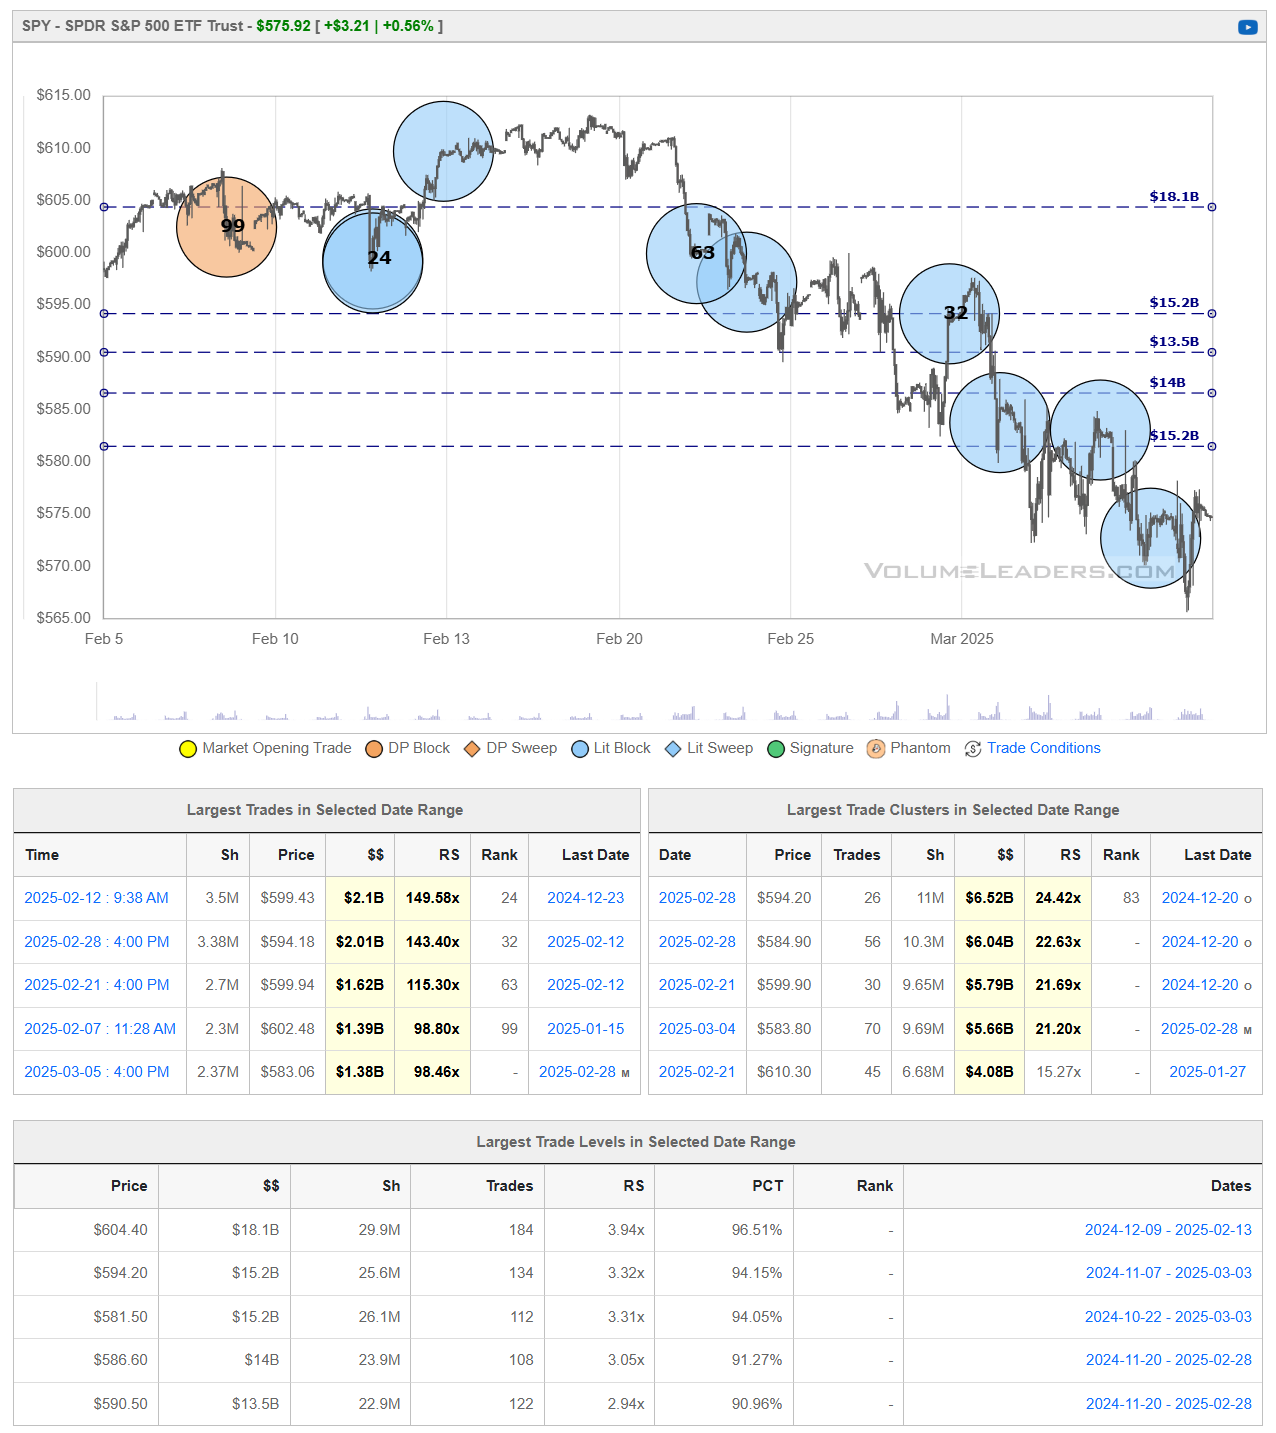
SPY extended its February sell‐off into early March, dropping from the $610 area down toward the mid‐$570s before finding a bid. The recent bounce has lifted price back into the upper‐$570s to low‐$580s, but remains below heavier supply levels in the $585–$590 zone—areas where prior high‐volume trades may act as resistance.
If buyers can push SPY convincingly above $590, it would suggest the recent bout of selling pressure has been absorbed, opening the door for a test of the $600–$605 region. Conversely, a failure to reclaim $590—or a slip back below support at $575—would signal that sellers remain in control, raising the likelihood of another leg down toward the recent lows.
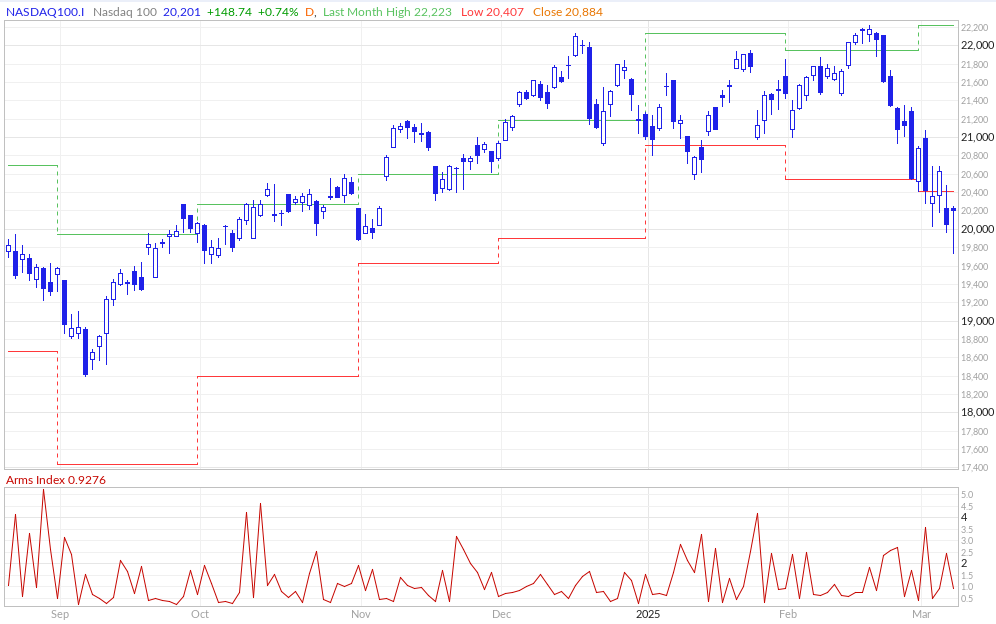
QQQ -0.05%↓
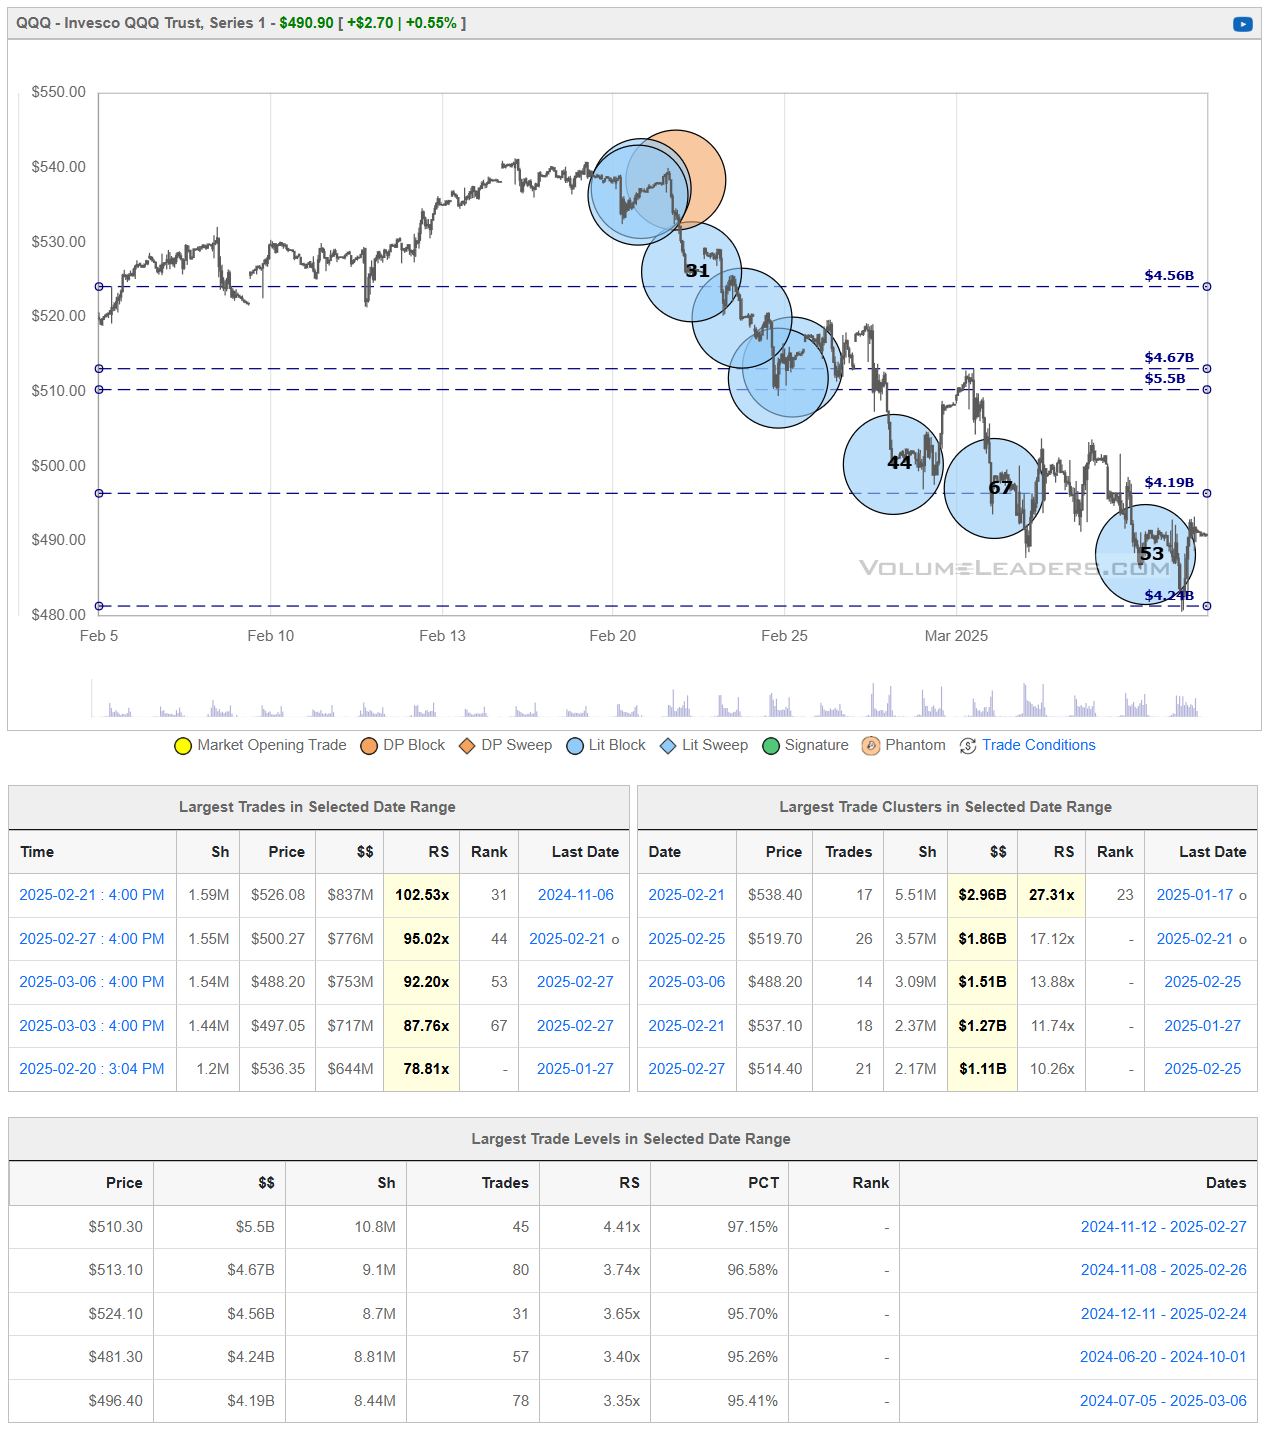
QQQ has cascaded lower since peaking near $540 in mid‐February, slicing through multiple volume‐based support zones on its way down toward the $480–$485 region. After finding a short‐term floor there, the ETF is attempting to stabilize, but remains under clear overhead supply around $500–$505, where prior institutional participation could act as strong resistance.
A meaningful push back above $505 would indicate that buyers have absorbed the selling pressure and might spur a more significant rebound. Conversely, failure to reclaim $500–$505—or a slip back under $480—would reinforce the bearish momentum and raise the odds of retesting or undercutting the recent lows.
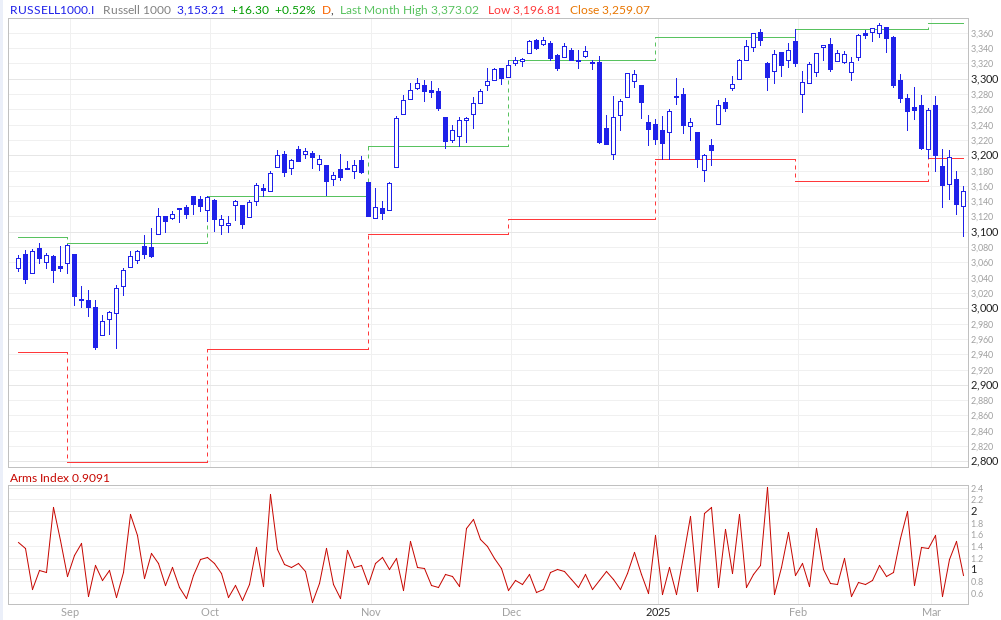
IWM 0.00%↑
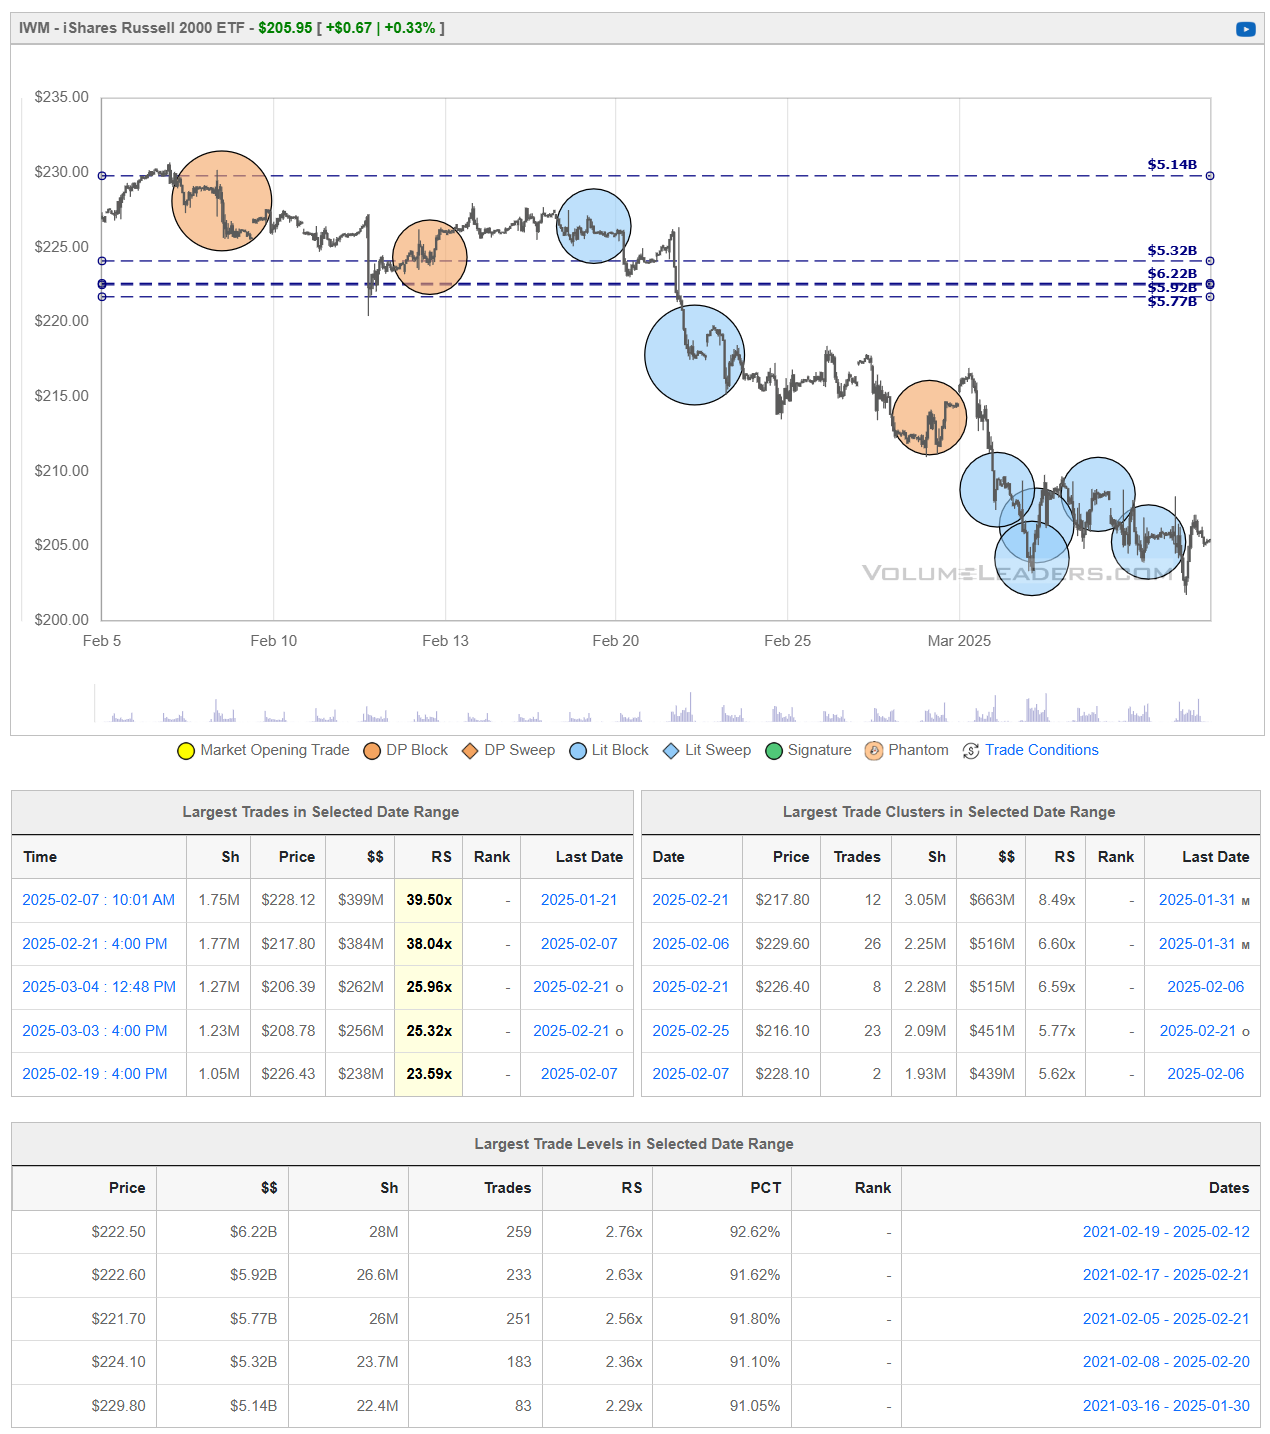
IWM extended its downtrend from around $230 in mid‐February and recently tested the low $200s, where buyers have tentatively stepped in. Despite the current bounce toward $205–$210, the ETF remains below major volume‐based resistance near $215–$220—previous support now acting as overhead supply. If IWM can reclaim and hold above that band, it would suggest a potential trend reversal. Otherwise, continued weakness below the recent lows could open the door to further downside exploration.
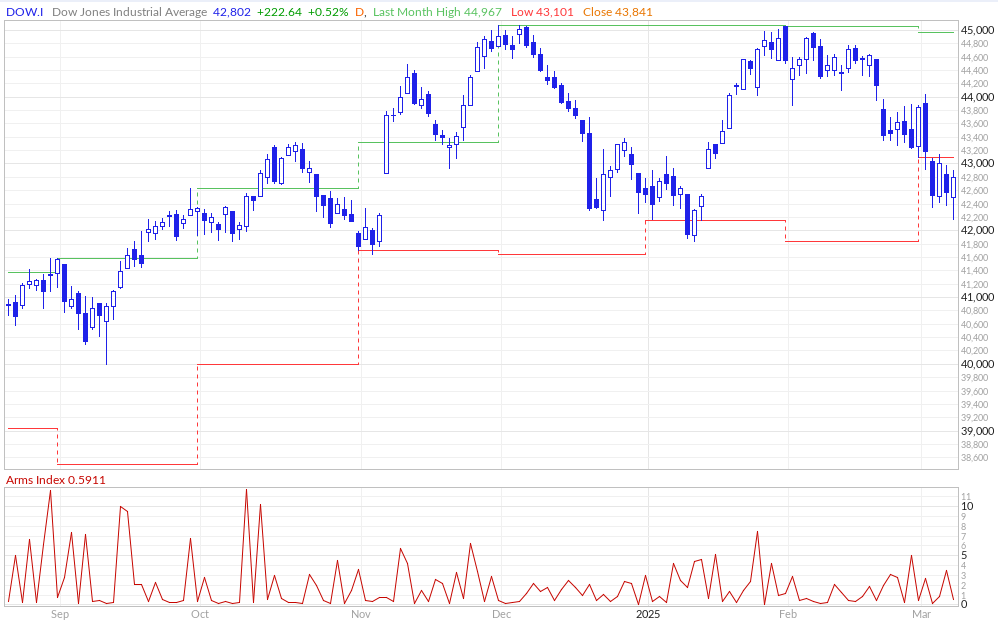
DIA 0.00%↑
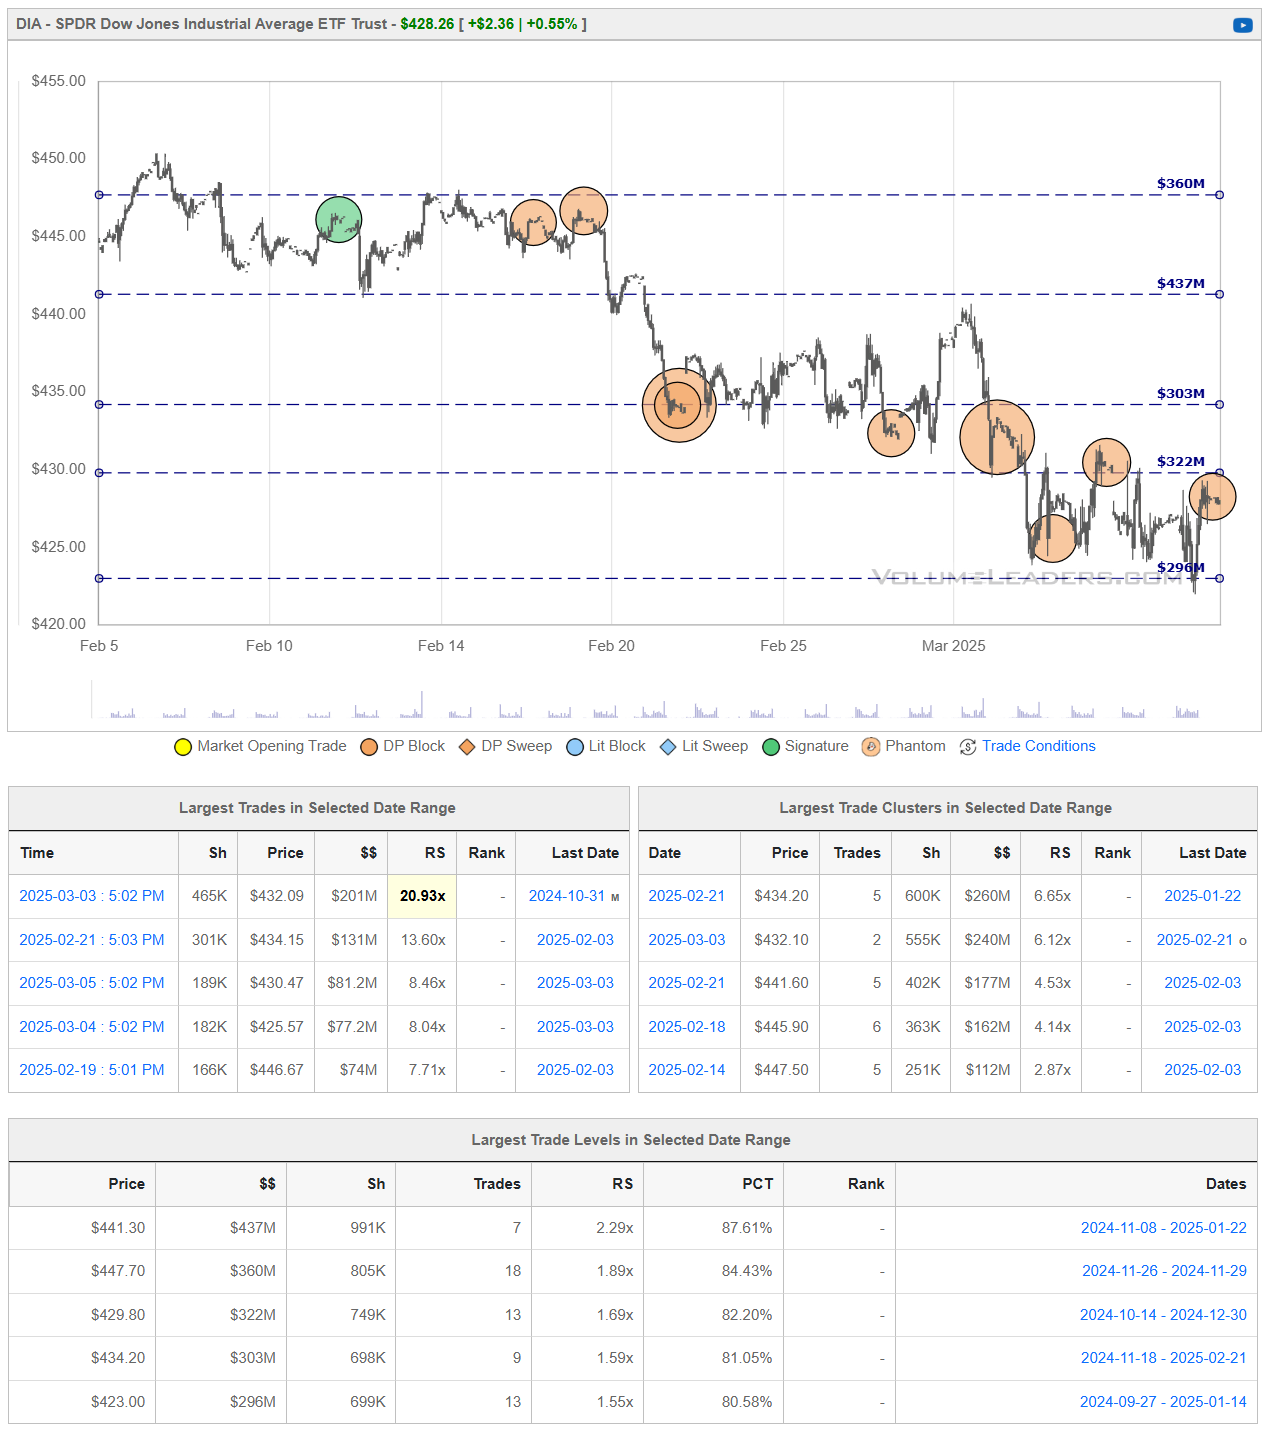
DIA’s downtrend from the mid‐$450s appears to have found a tentative floor near $420, where recent institutional trades have helped stabilize price. The ETF is now rebounding toward the $430–$435 region, a zone that previously acted as support but may serve as overhead resistance unless buyers can absorb lingering supply.
If DIA can break and hold above $435, it would suggest that bulls are regaining control, potentially fueling a larger recovery toward $440 or higher. Conversely, failure to clear the $430–$435 band—or a slip back below $420—would keep the broader downtrend intact, raising the likelihood of retesting or undercutting recent lows.
Institutional Order Flow
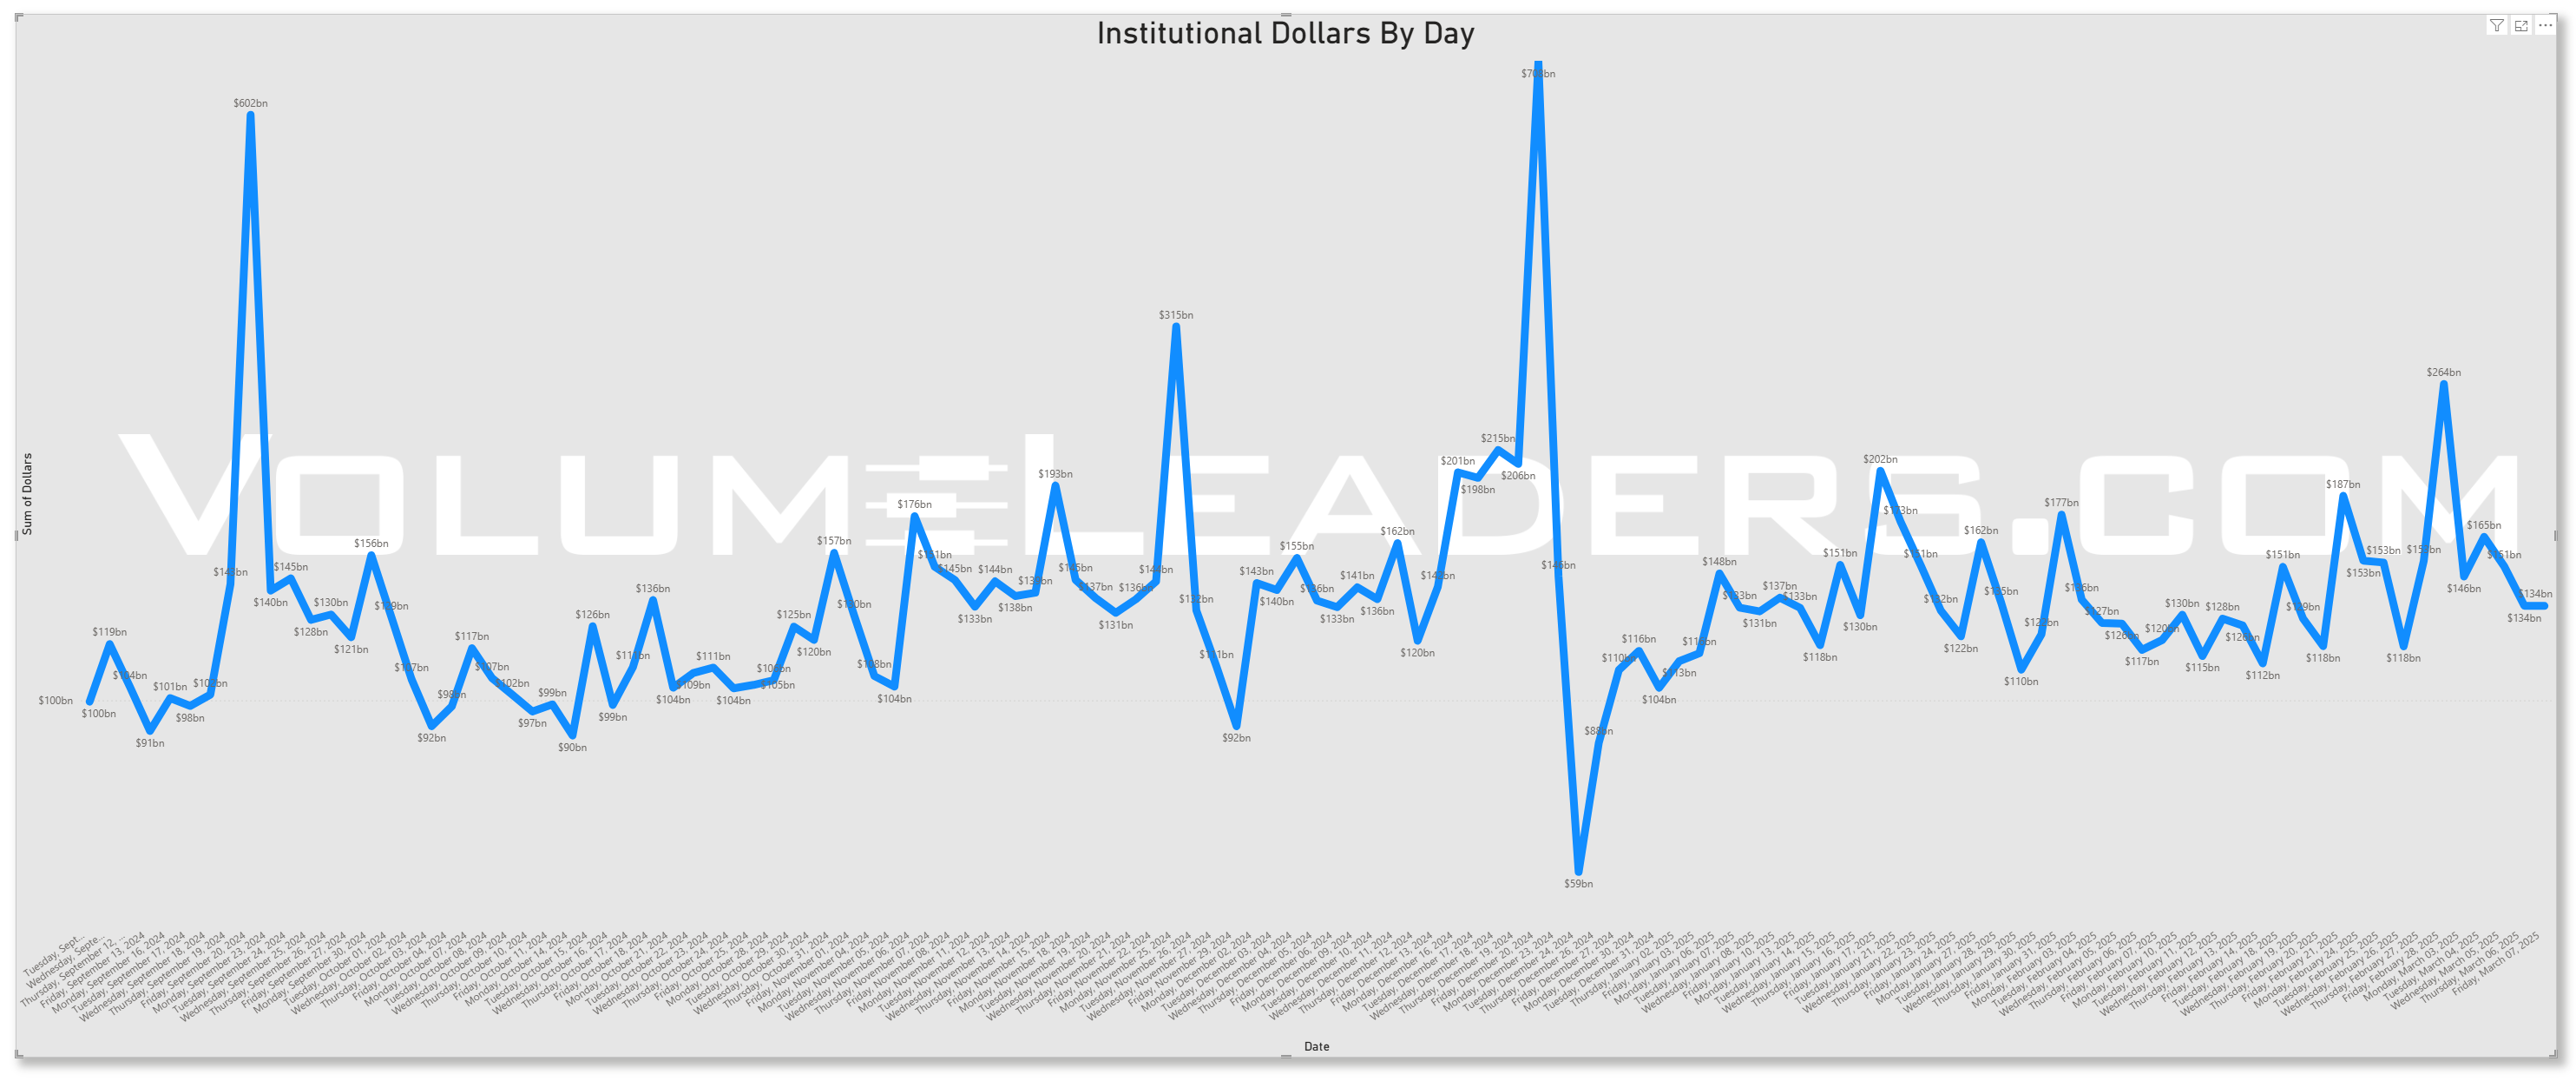
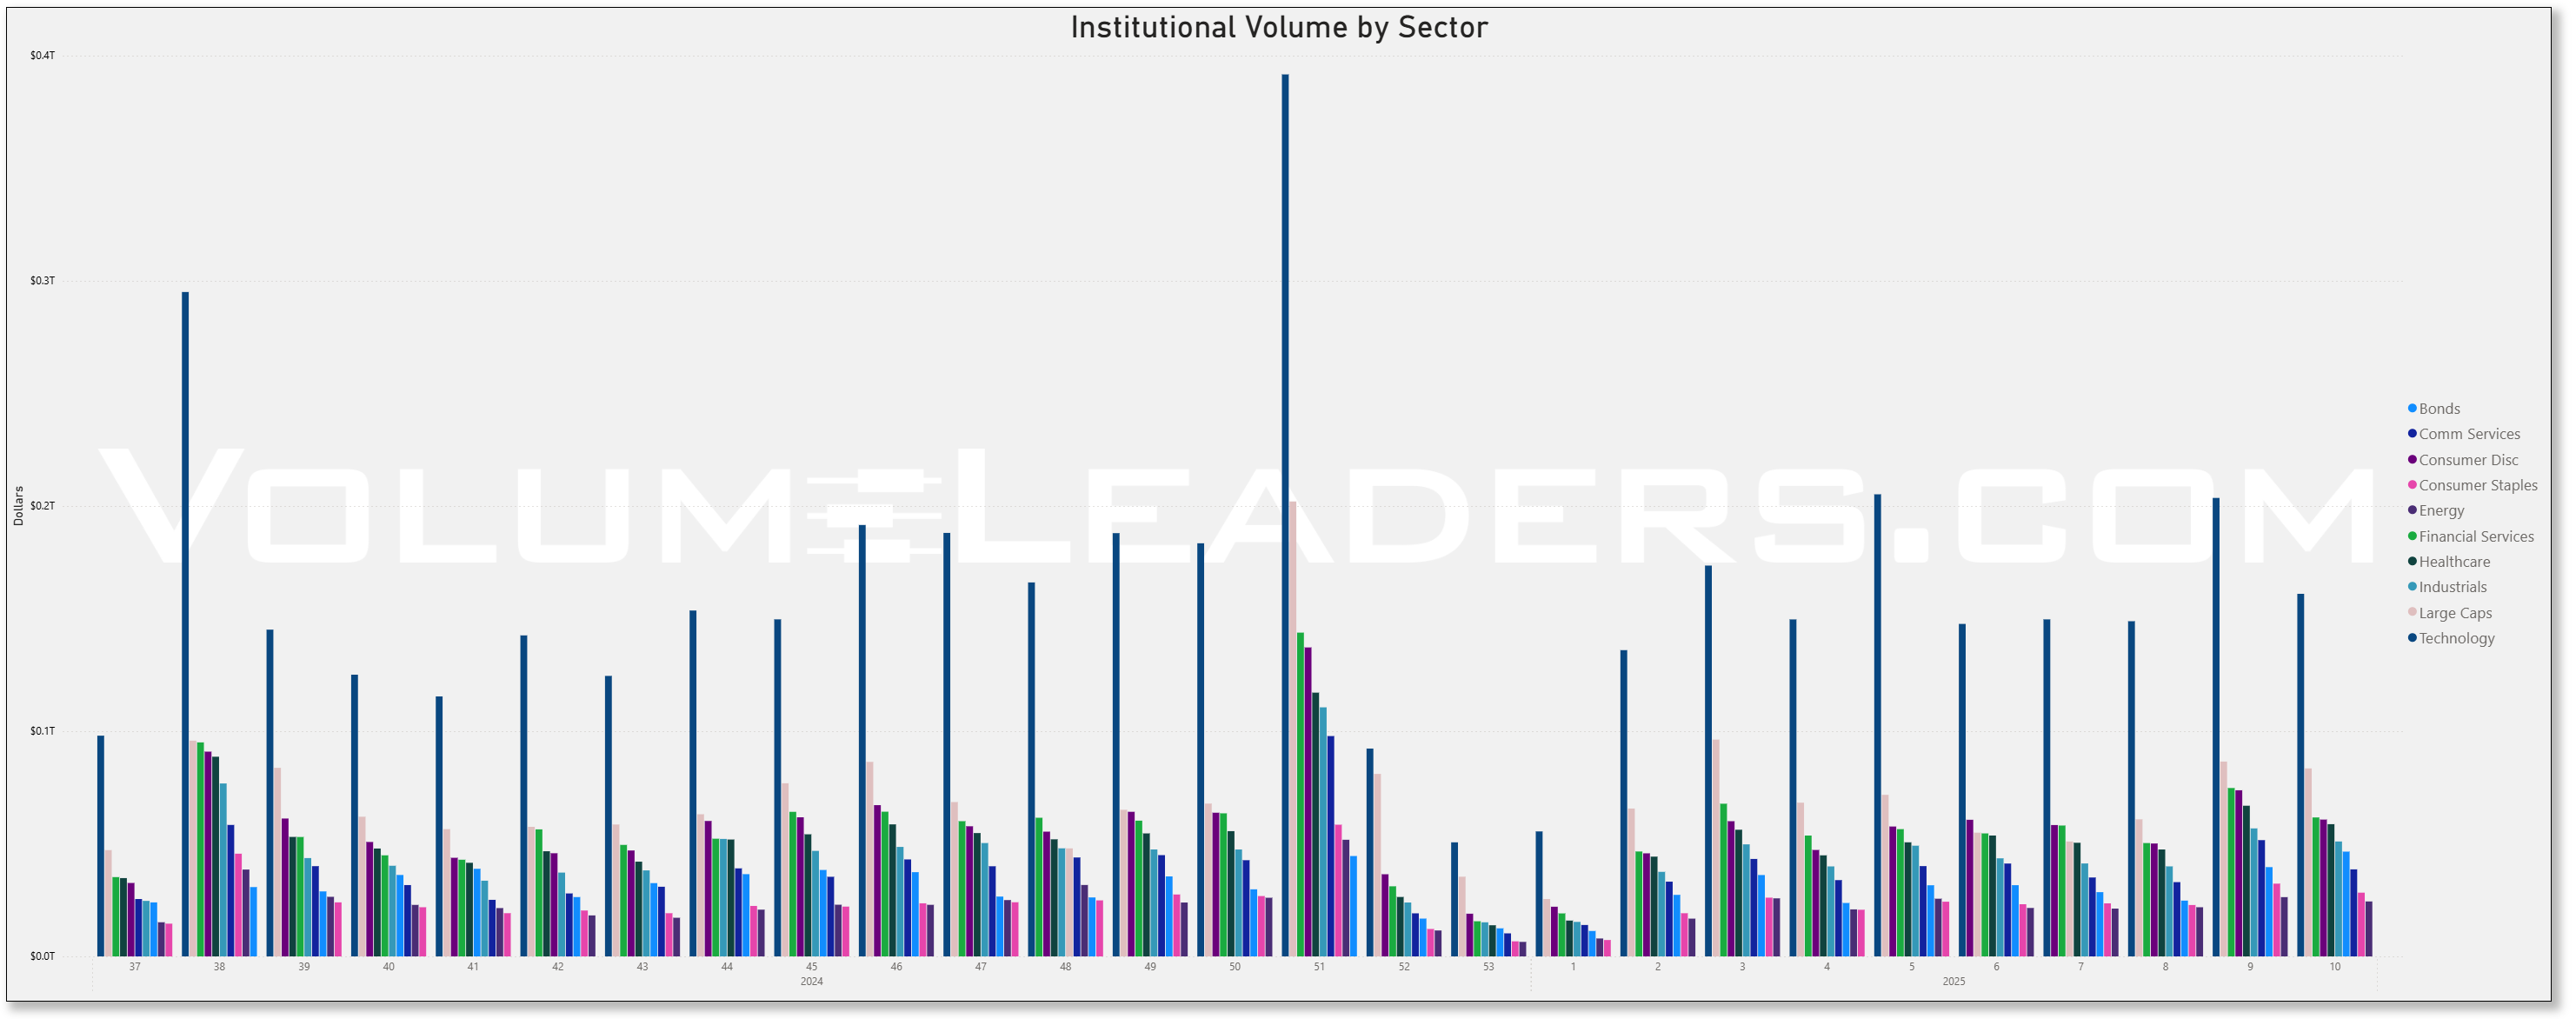
Rolling 90-Day Dollars By Day
This chart shows institutional activity by dollars by day on a rolling 1-year basis. From a theoretical standpoint, examining a chart of daily institutional dollar activity over the course of a year can offer several insights and possible inferences, though all should be approached with caution since the data alone may not prove causality or confirm underlying reasons. Some potential takeaways include:
Event-Driven Behavior:
Sharp, singular spikes on certain days might correlate with major market-moving events. These could include central bank policy announcements, significant geopolitical news, sudden macroeconomic data releases (like employment reports or GDP data), earnings seasons for large-cap companies, or unexpected shocks (e.g., mergers, acquisitions, regulatory changes).Liquidity Dynamics:
Institutions often concentrate large trades on days with higher expected liquidity. For instance, heightened activity might coincide with index reconstitutions, option expiration dates, or the days leading up to or following a major index rebalance, when large amounts of capital shift hands simultaneously.Risk Management and Hedging Activity:
Institutions may significantly adjust their exposures on days that are critical from a risk management perspective. Large spikes can occur if hedge funds, pension funds, or asset managers are rolling over futures contracts, initiating or closing out large hedges, or reacting to volatility triggers.Market Sentiment Indicators:
While the data is purely transactional, the sheer volume of institutional involvement on certain days might indirectly hint at changing sentiment or strategic shifts.
In essence, a chart like this can lead you to hypothesize that institutional trading volumes are not constant or random but rather influenced by a mix of predictable calendar effects, major market events, liquidity considerations, risk management decisions, and strategic allocation shifts.
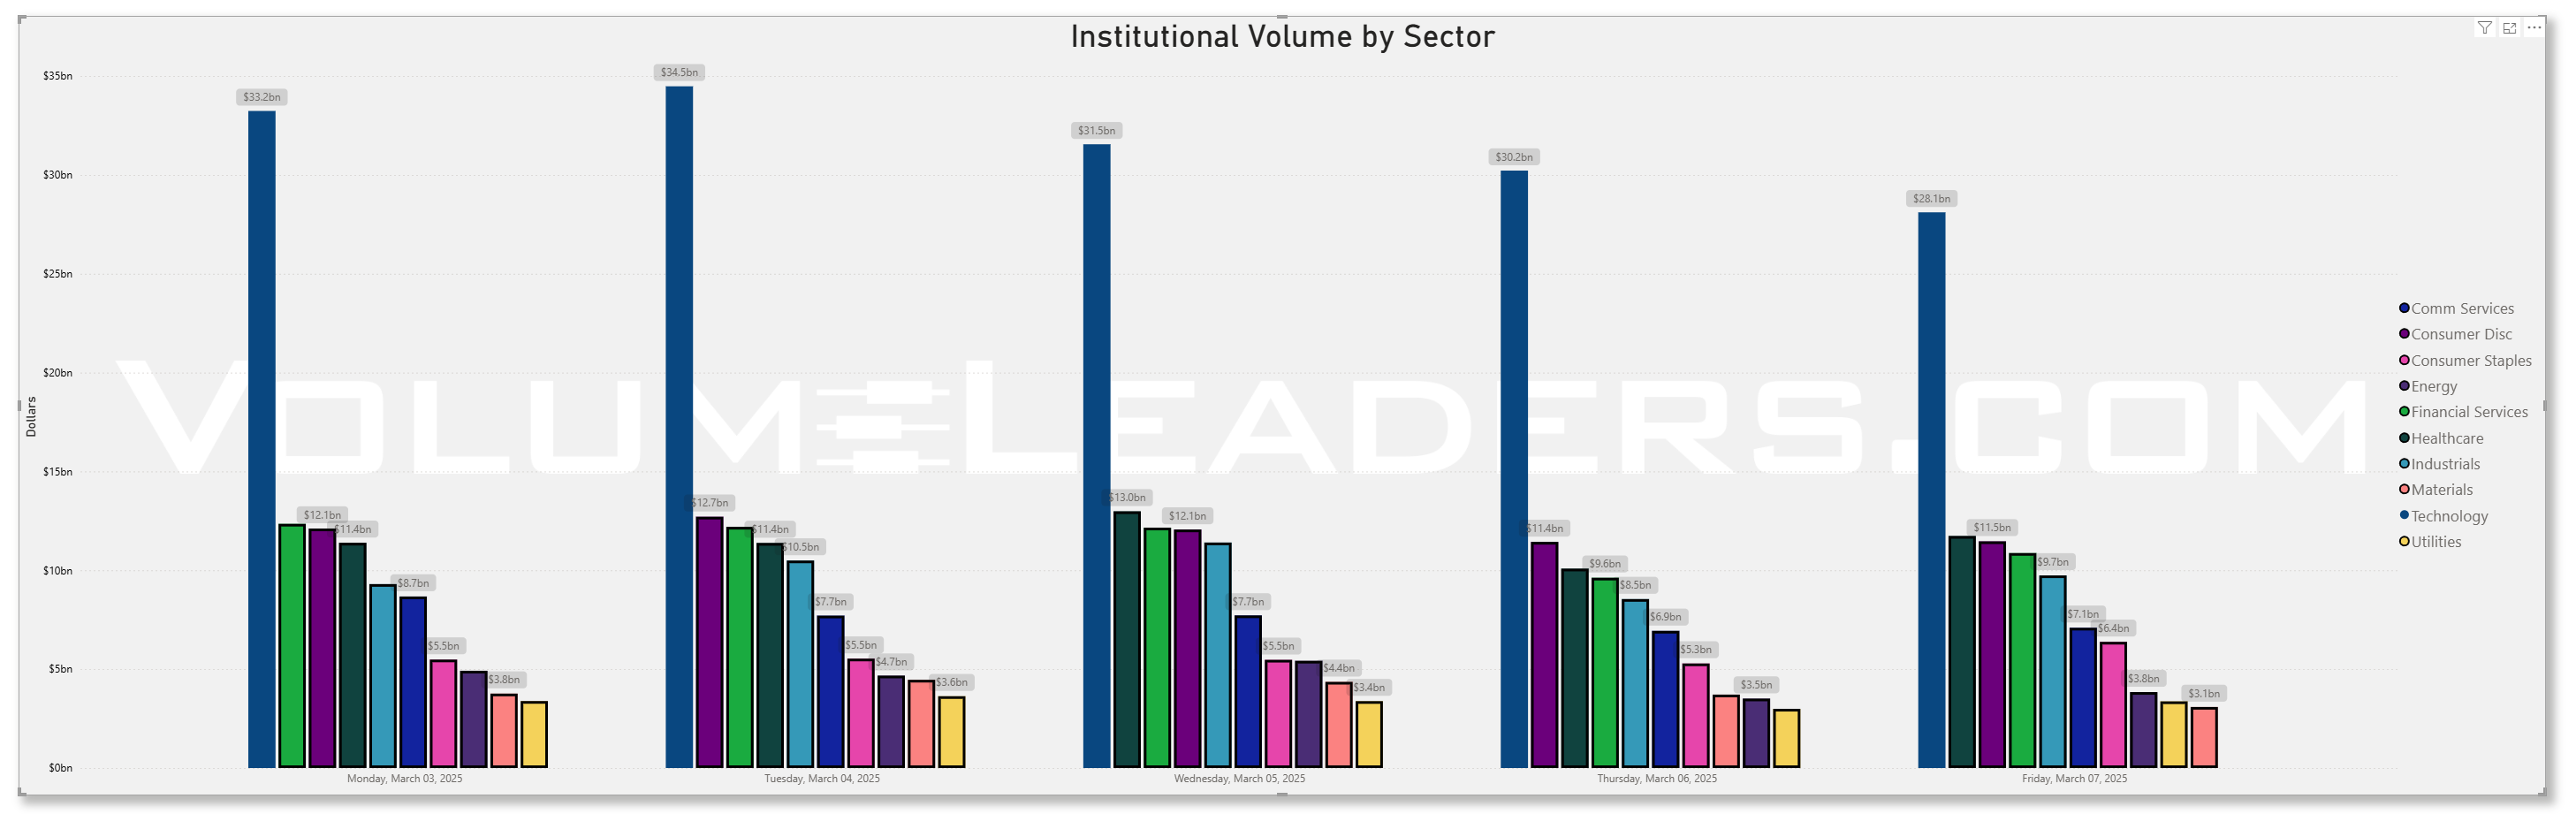
Top Institutional Order Flow By Sector By Week For The Past 90-Days
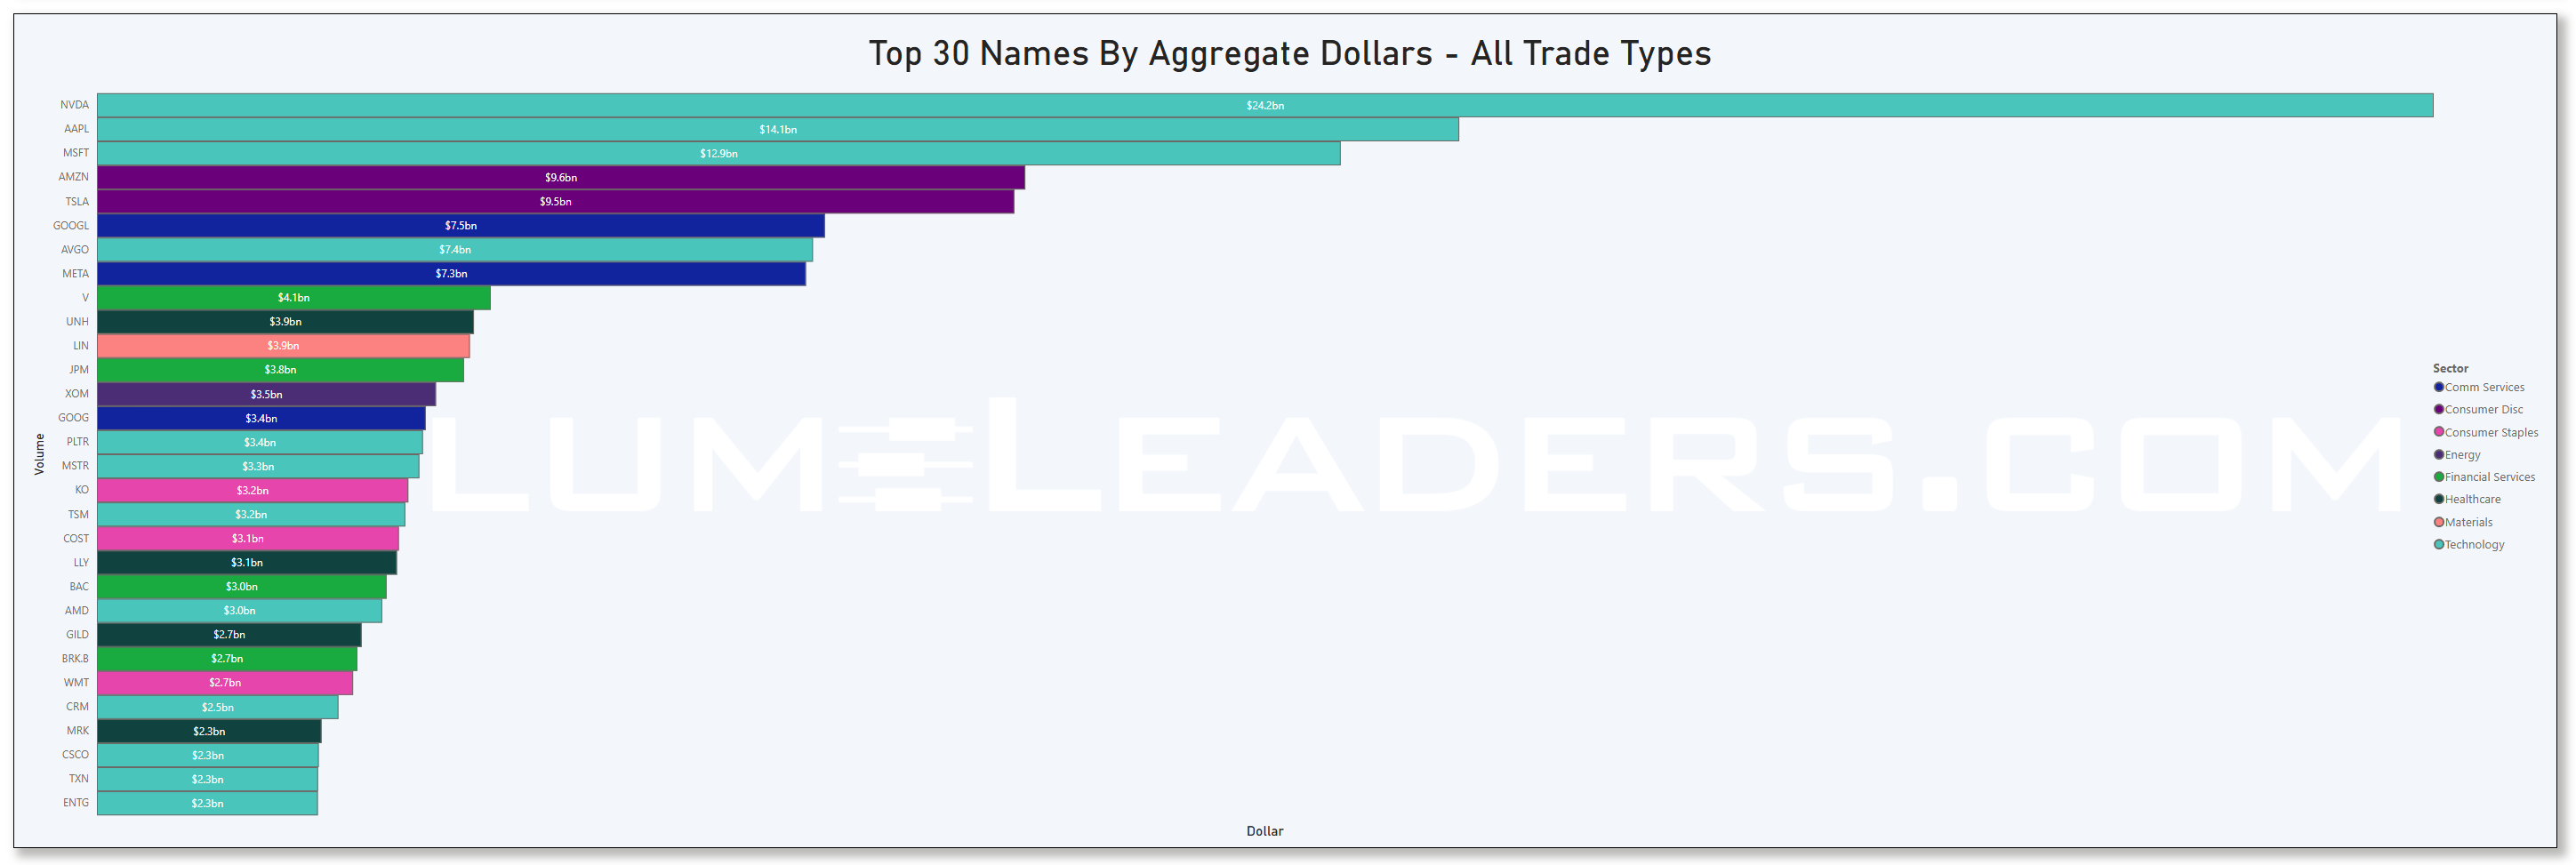
Top Institutional Order Flow In Equities
These are incredibly important charts to watch as they contains lots of nuanced suggestions at a thematic level. Watch these charts closely week-to-week to stay informed about where institutional money is flowing, adjust your strategies based on momentum, align your portfolio with macroeconomic and market trends, and manage risks more effectively by avoiding sectors losing institutional favor.
Sector Rotation Insights: The chart highlights which sectors are attracting institutional activity and which are losing favor. Institutions often lead market trends, so tracking shifts in their focus can indicate sector rotations.
Sentiment Analysis: The level of institutional activity reflects confidence in specific sectors. Rising activity in traditionally defensive sectors (e.g., healthcare, utilities) may indicate caution, while a surge in growth sectors (e.g., technology, consumer discretionary) could suggest optimism.
Emerging Trends: Sudden spikes in a previously overlooked sector, like industrials or consumer staples, might hint at emerging opportunities or structural shifts.
Macro Themes: Changes in sector activity often align with broader macroeconomic themes like inflation, interest rates, or geopolitical events. For instance:
Increased activity in energy might indicate concerns about oil supply or rising prices.
Growth in technology could align with innovations or favorable policies.
Risk Management: Declining institutional activity in a sector might signal weakening fundamentals or heightened risks.
Spotting Overcrowding: Excessive activity in a single sector over multiple weeks may suggest overcrowding, which could lead to heightened volatility if institutions begin to exit.
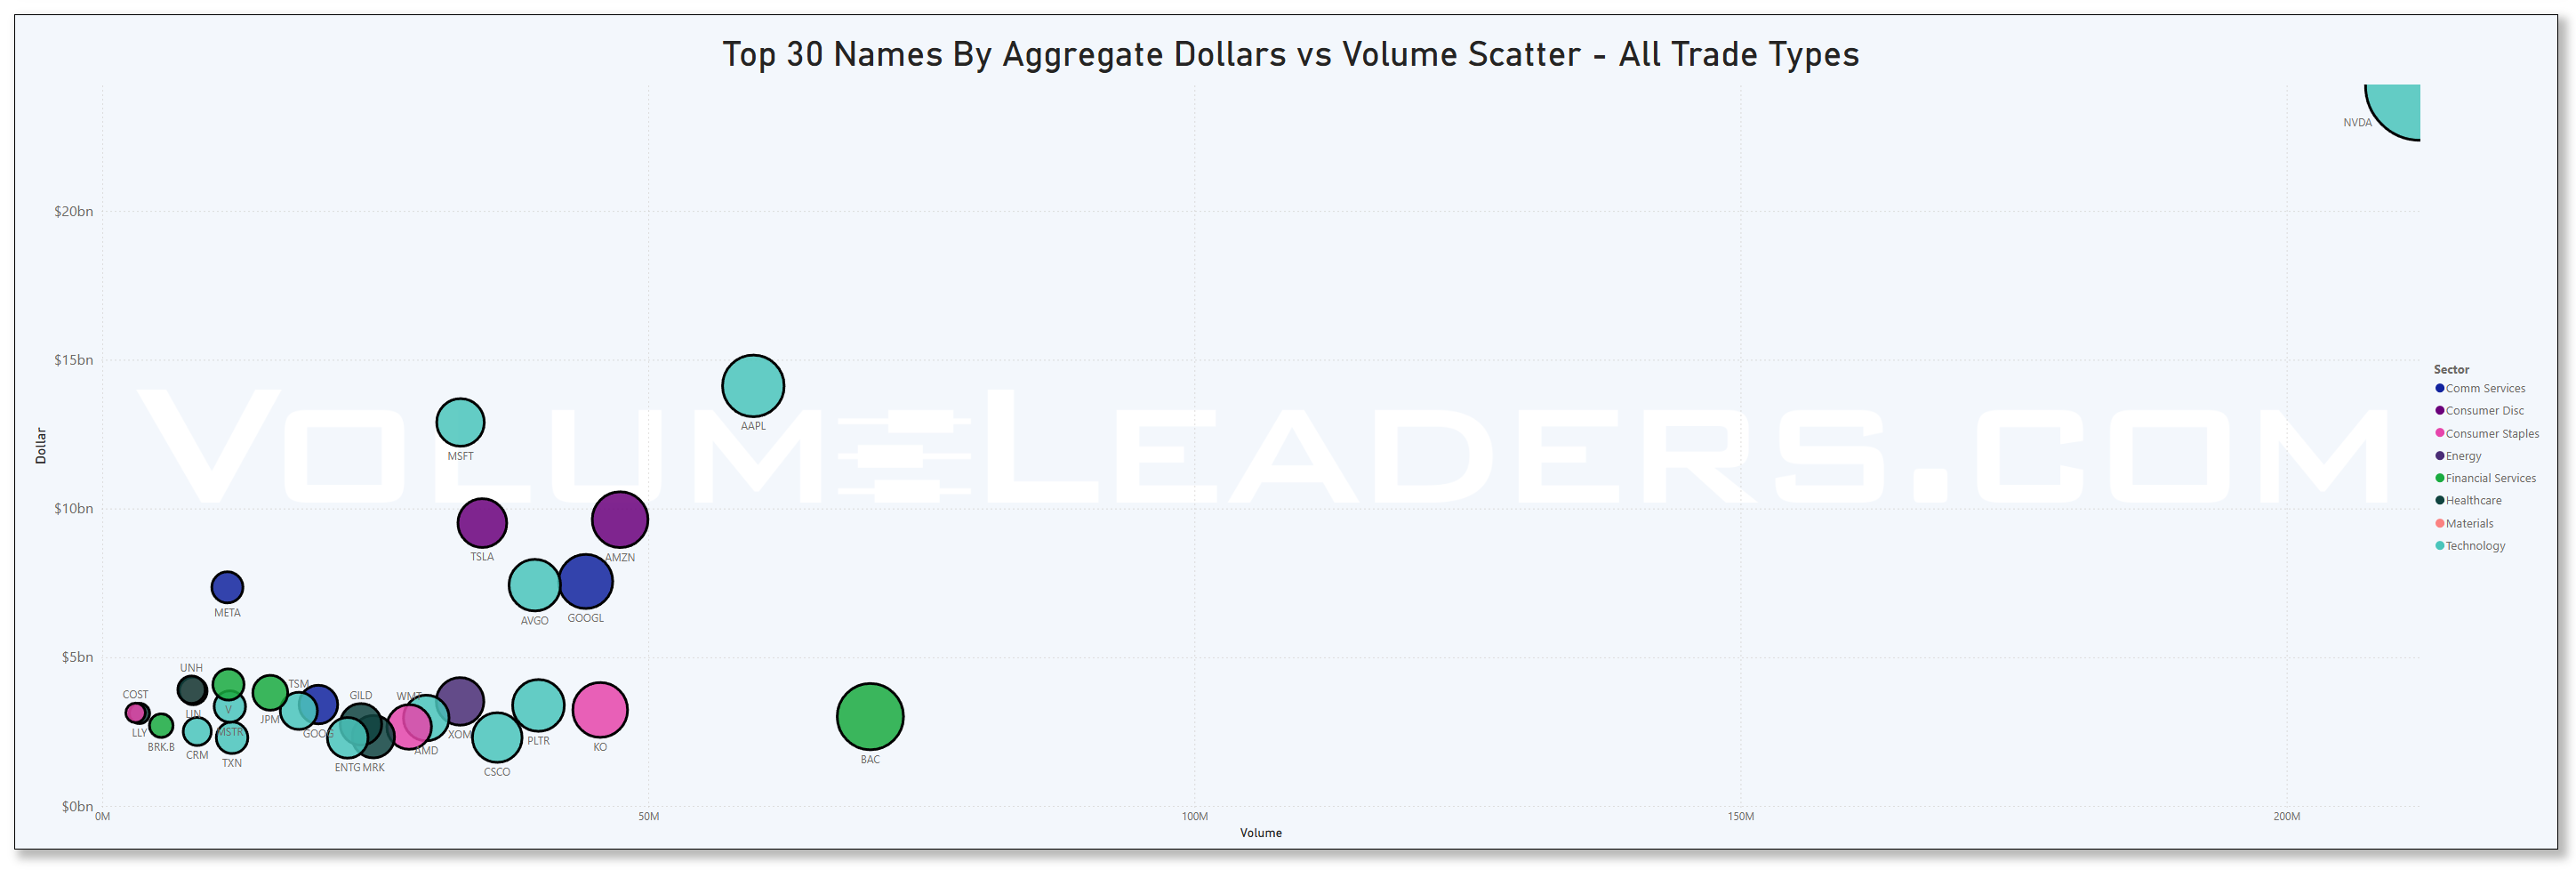
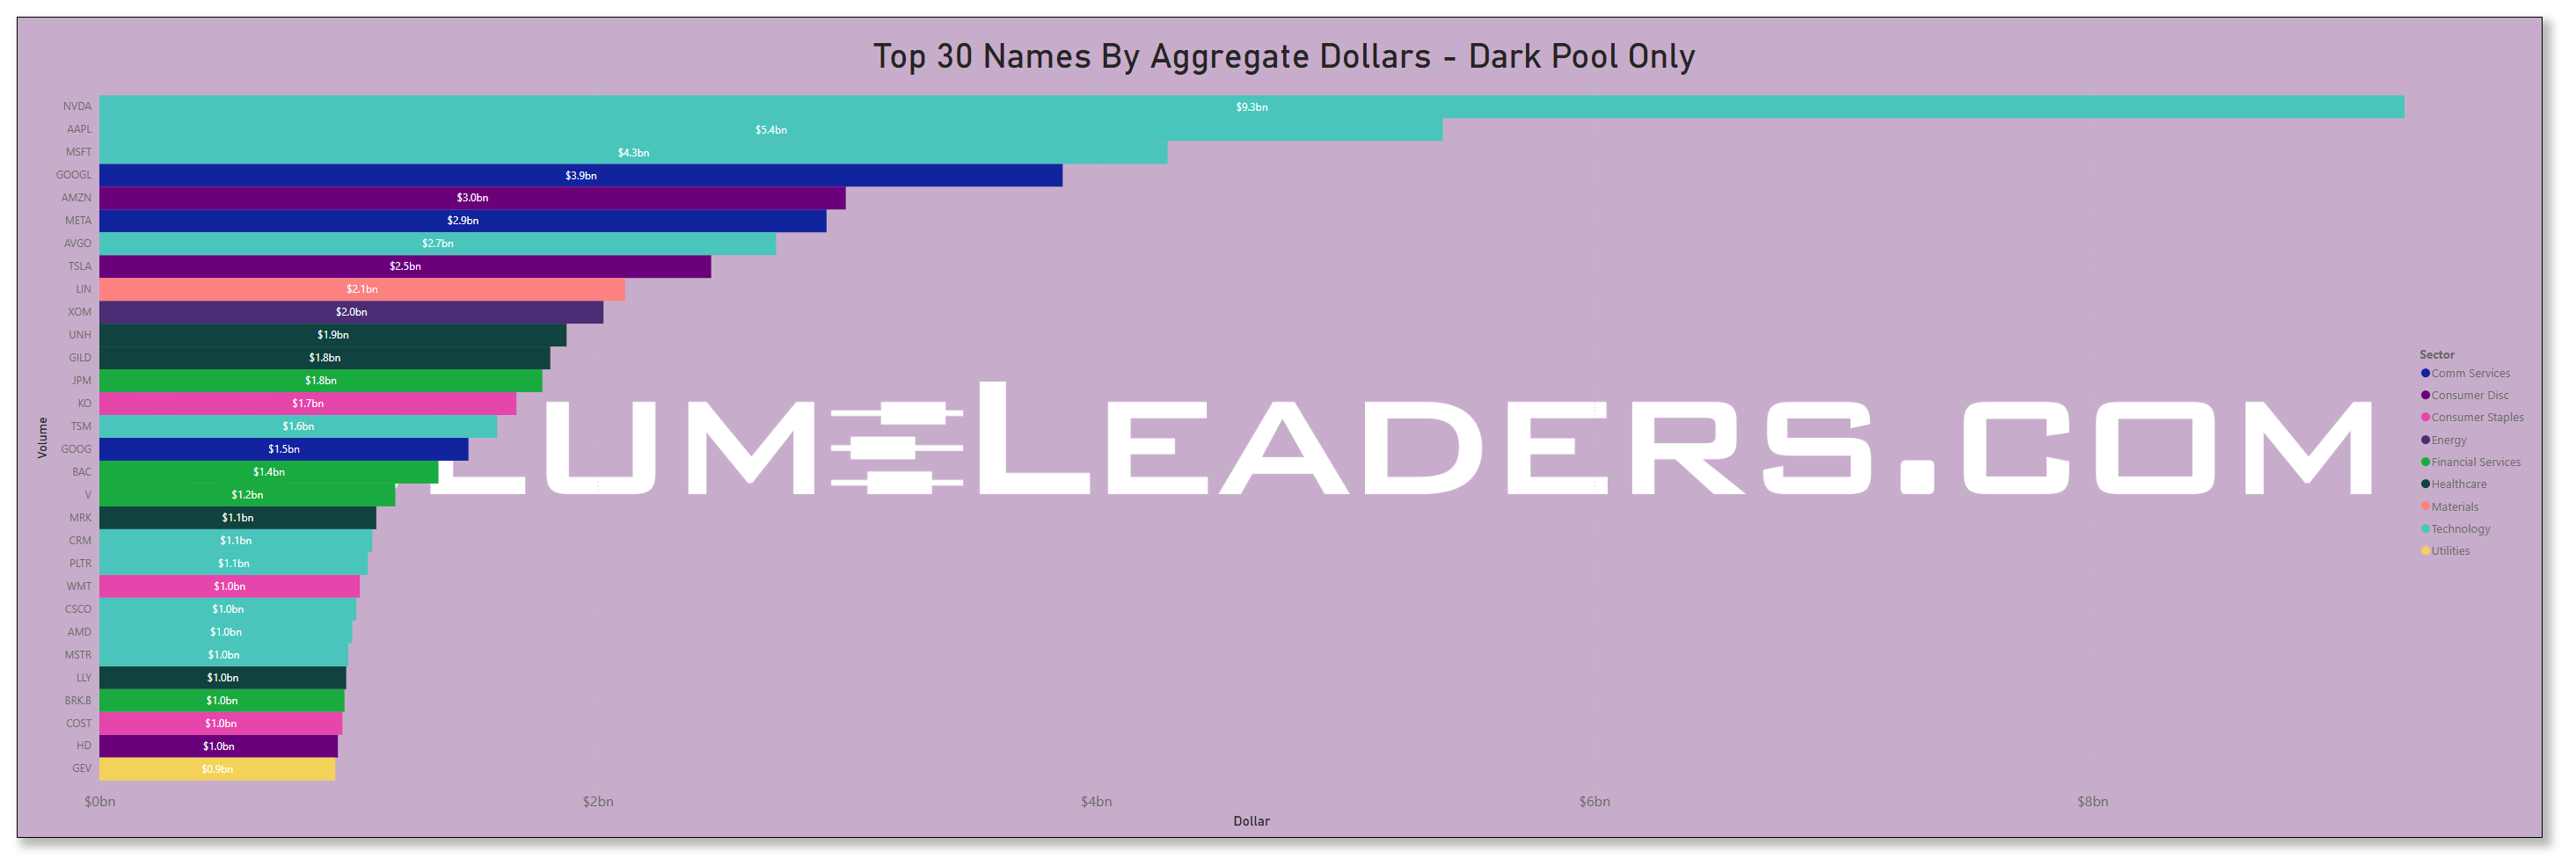
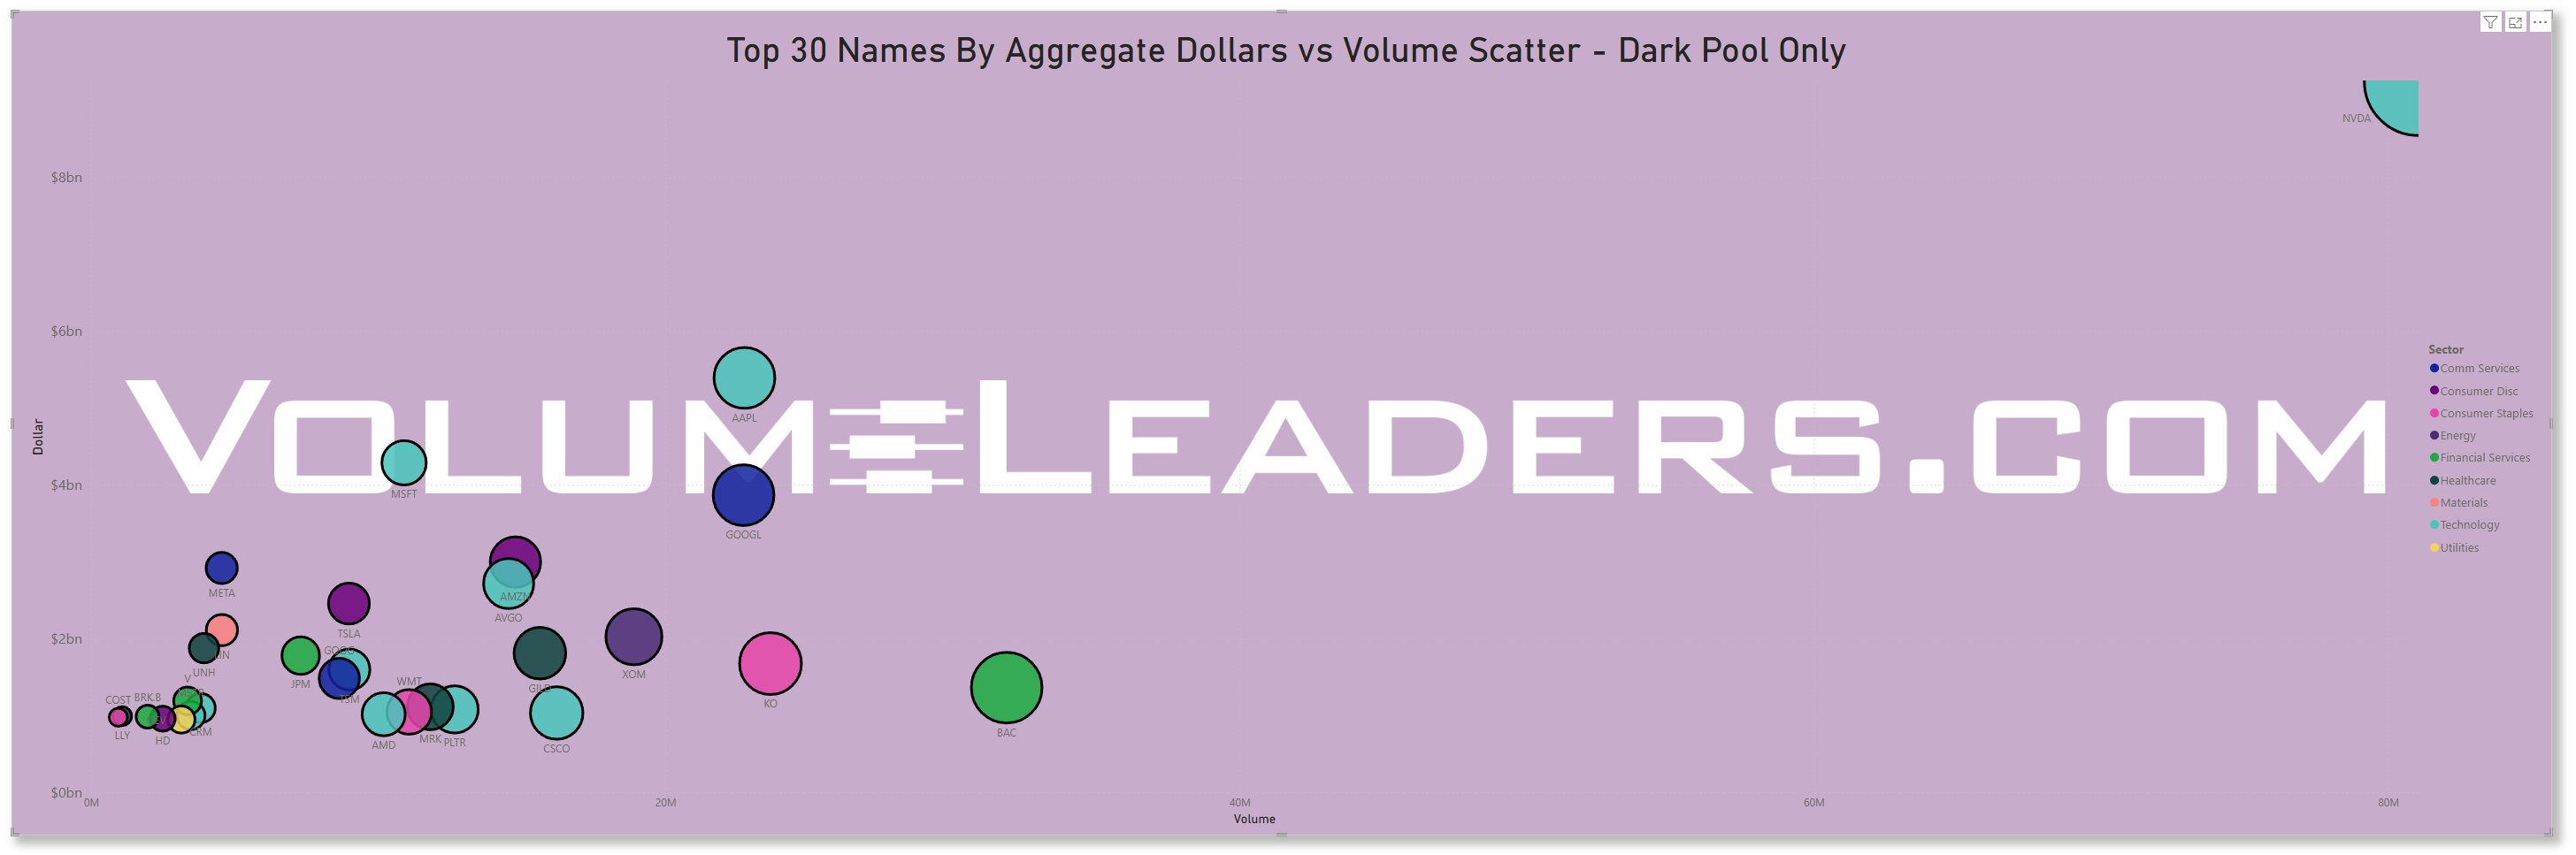
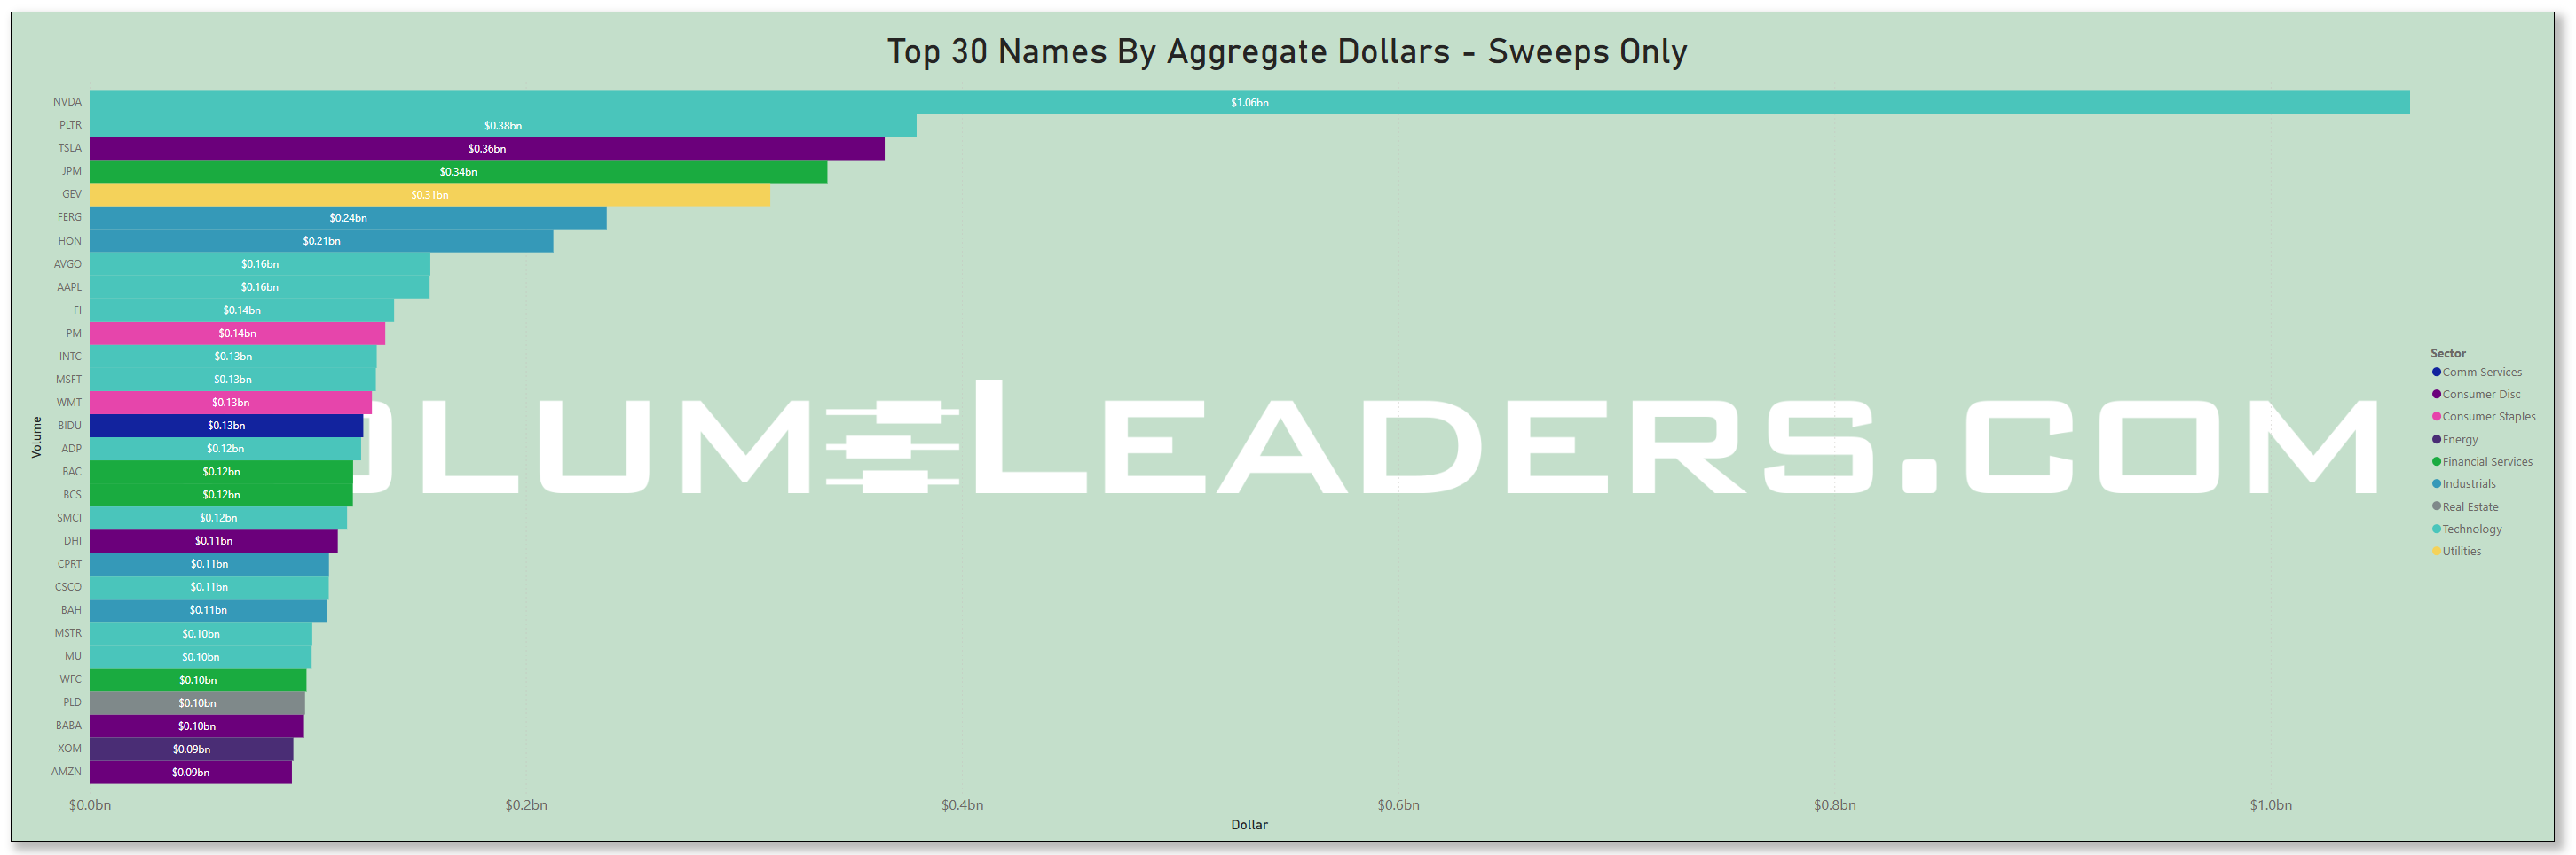
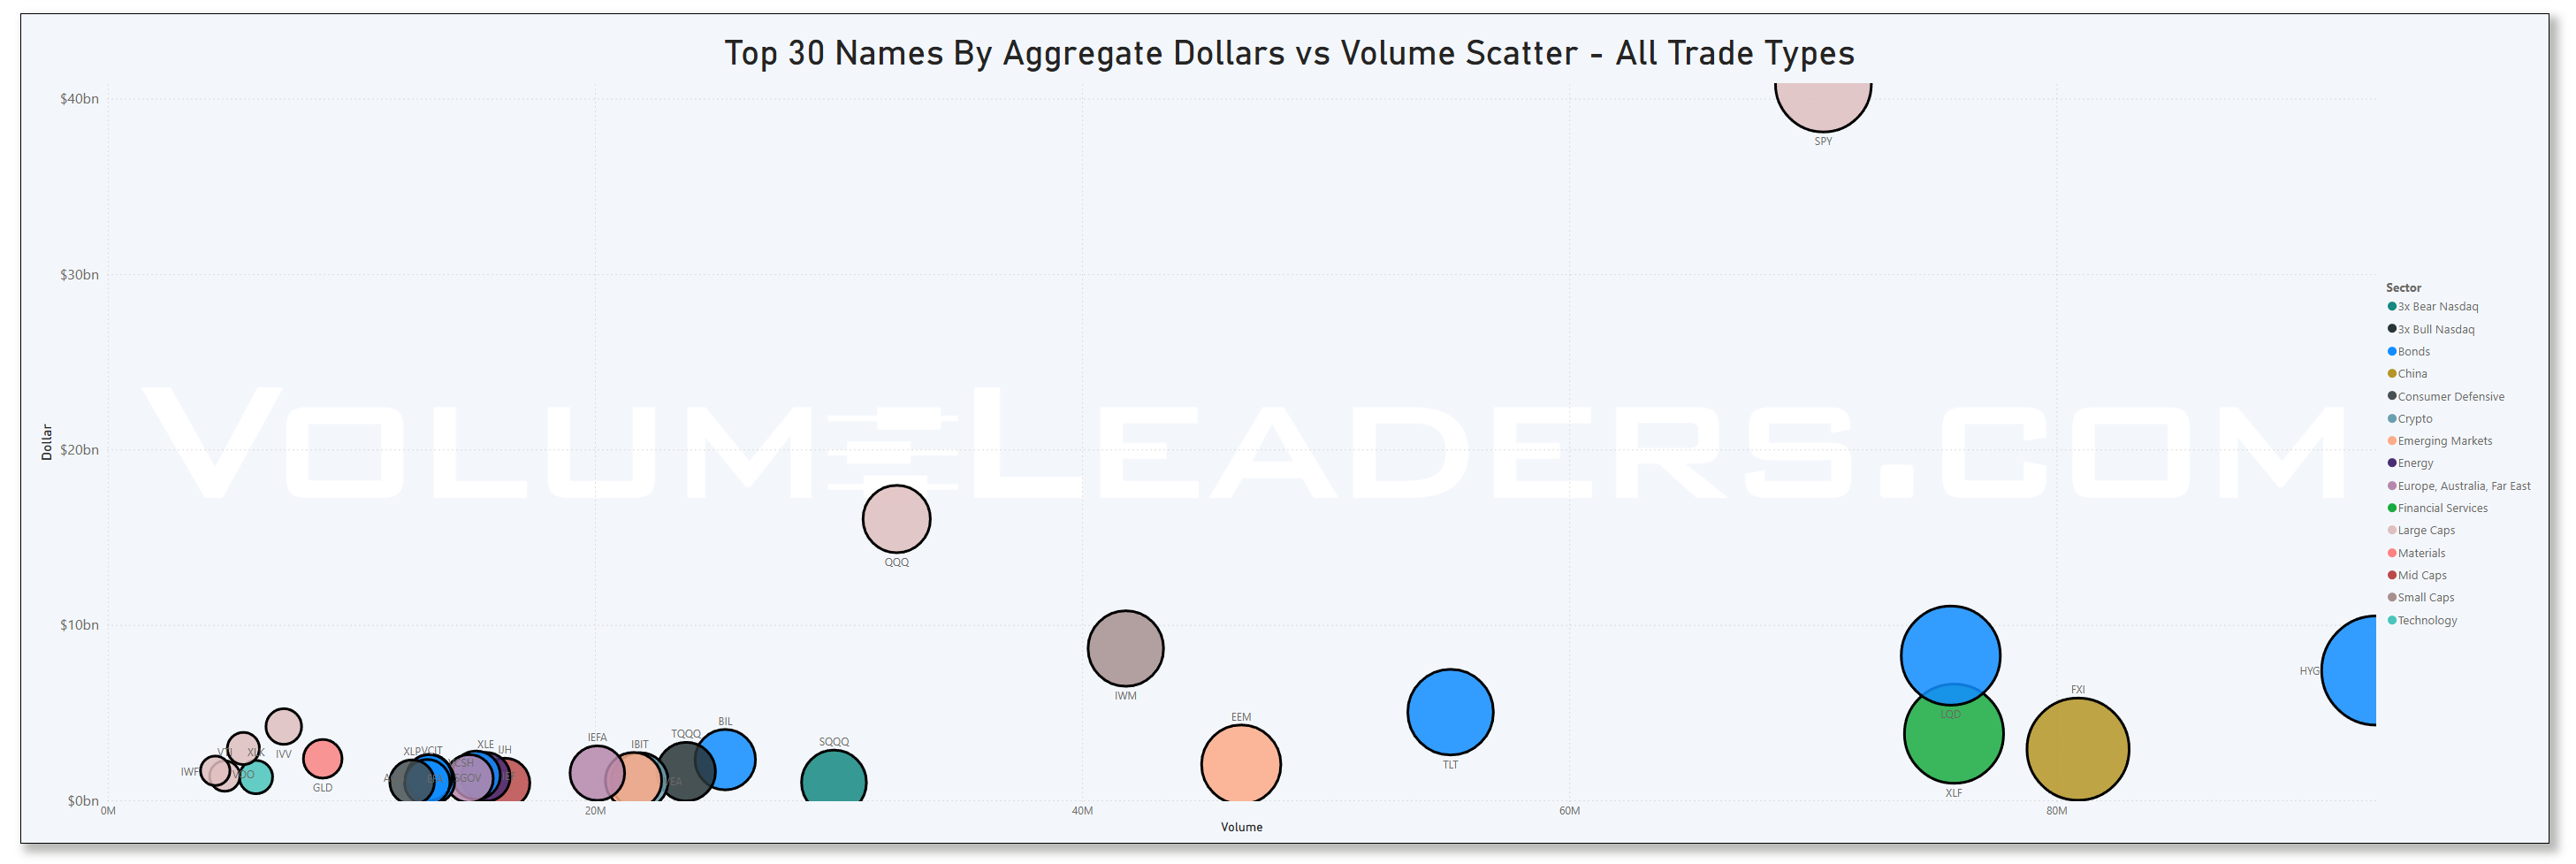
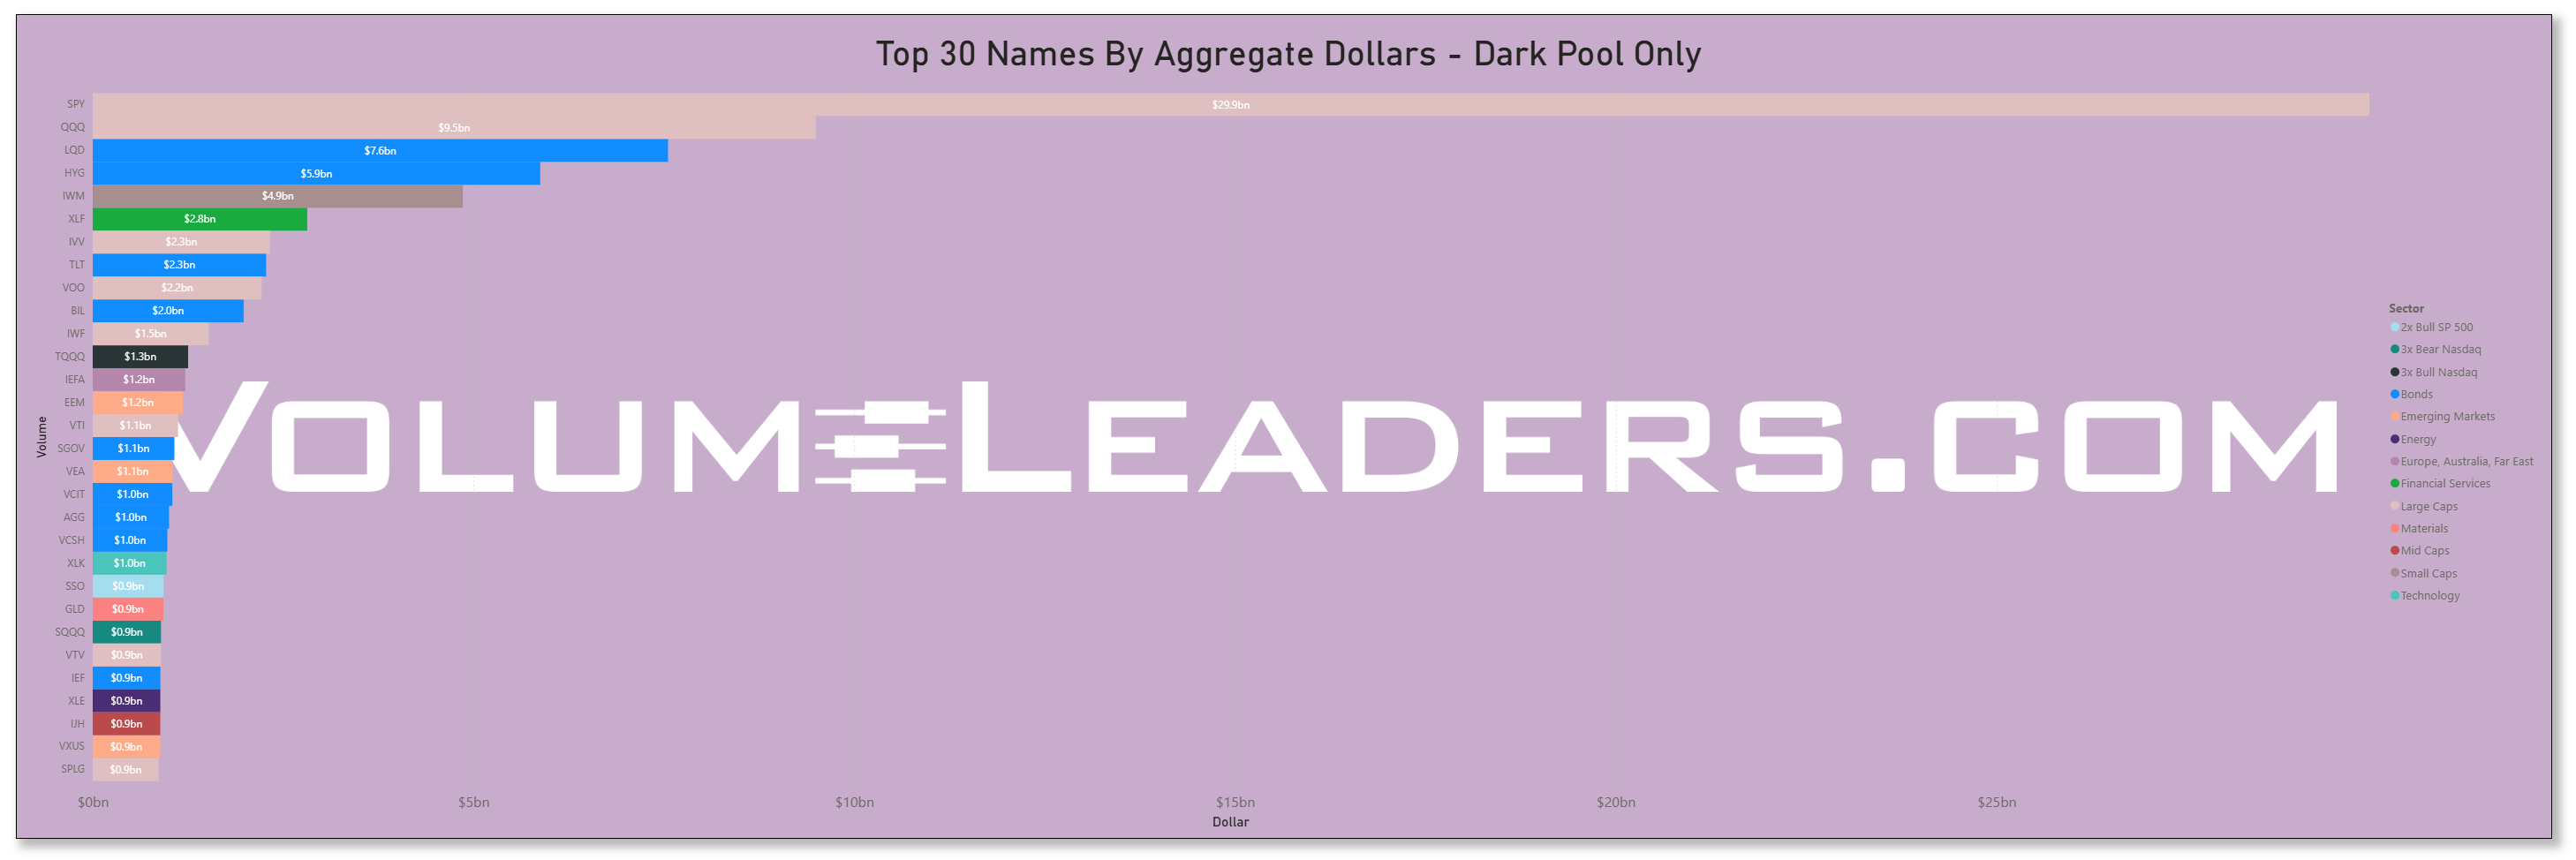
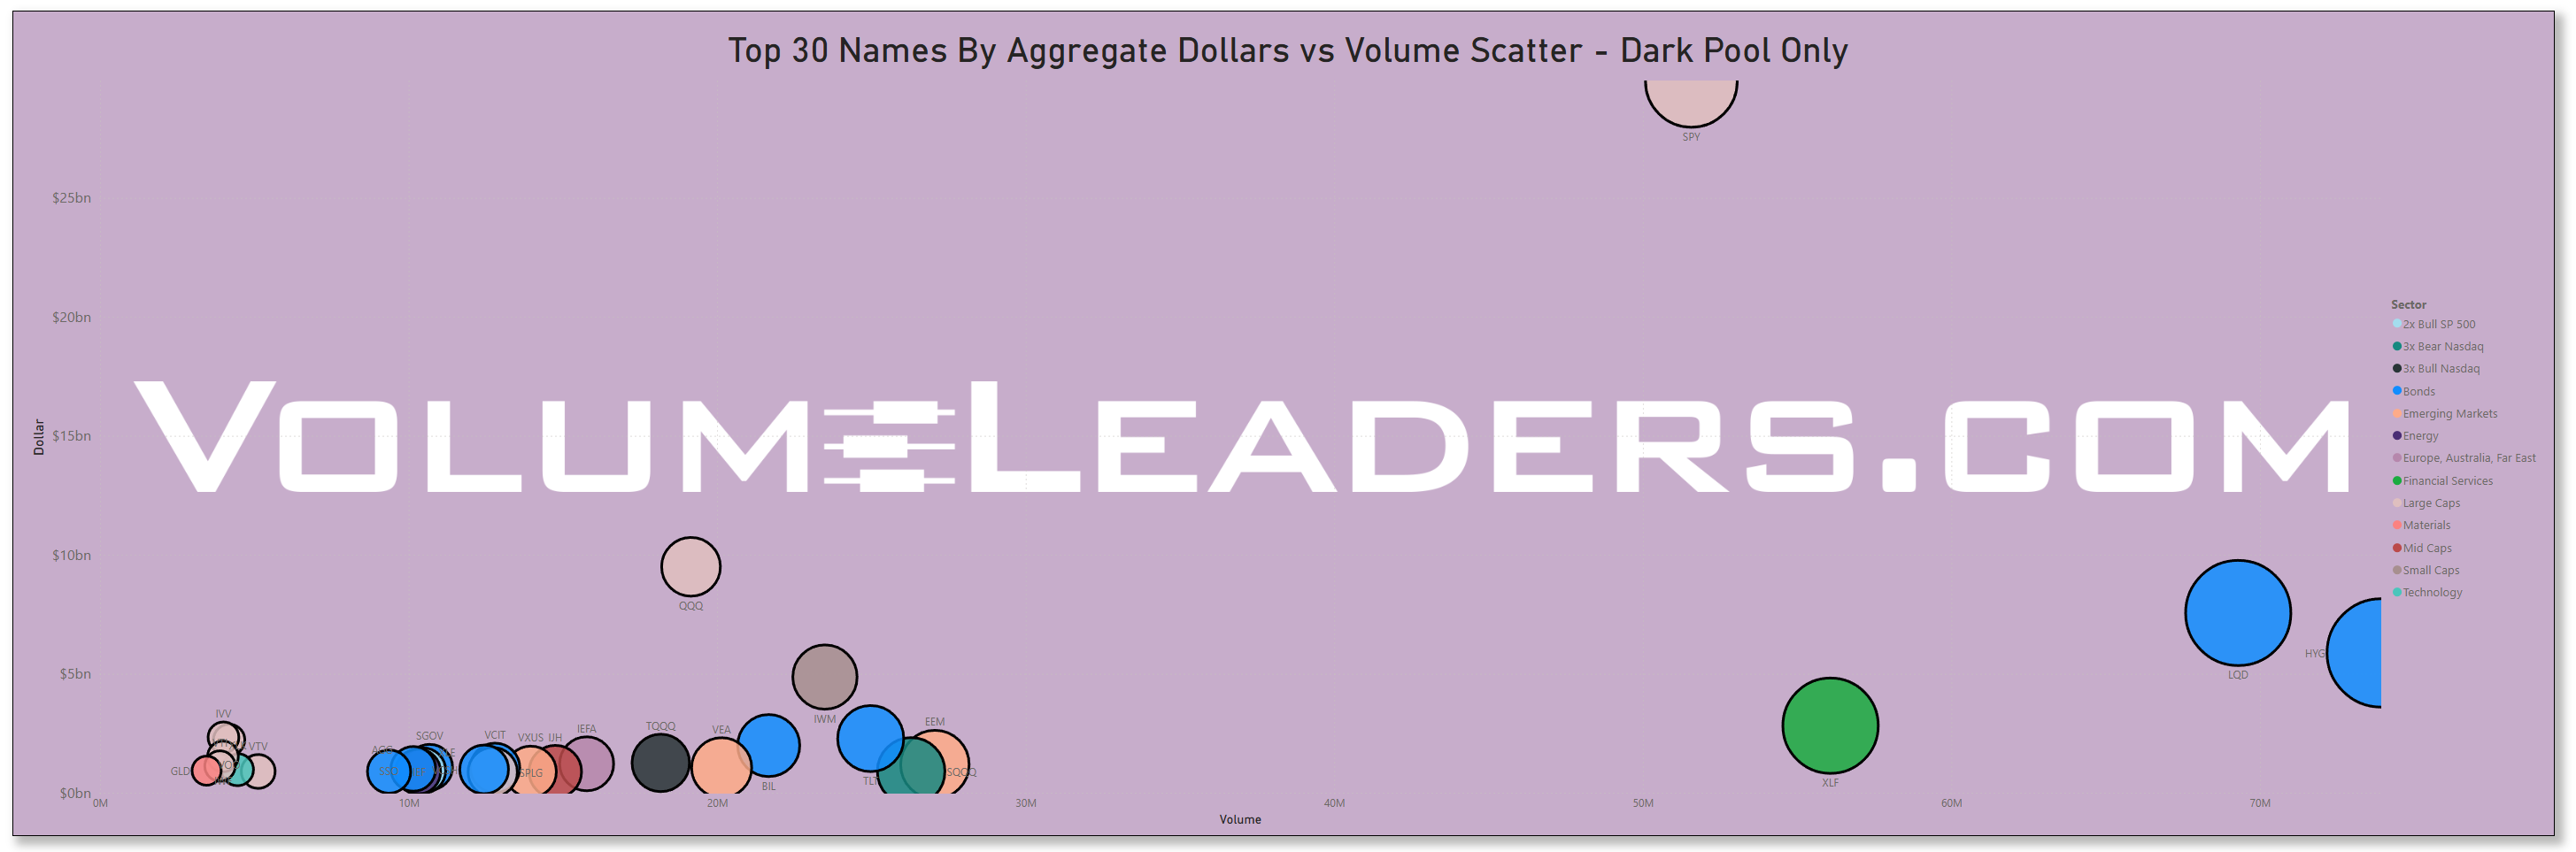
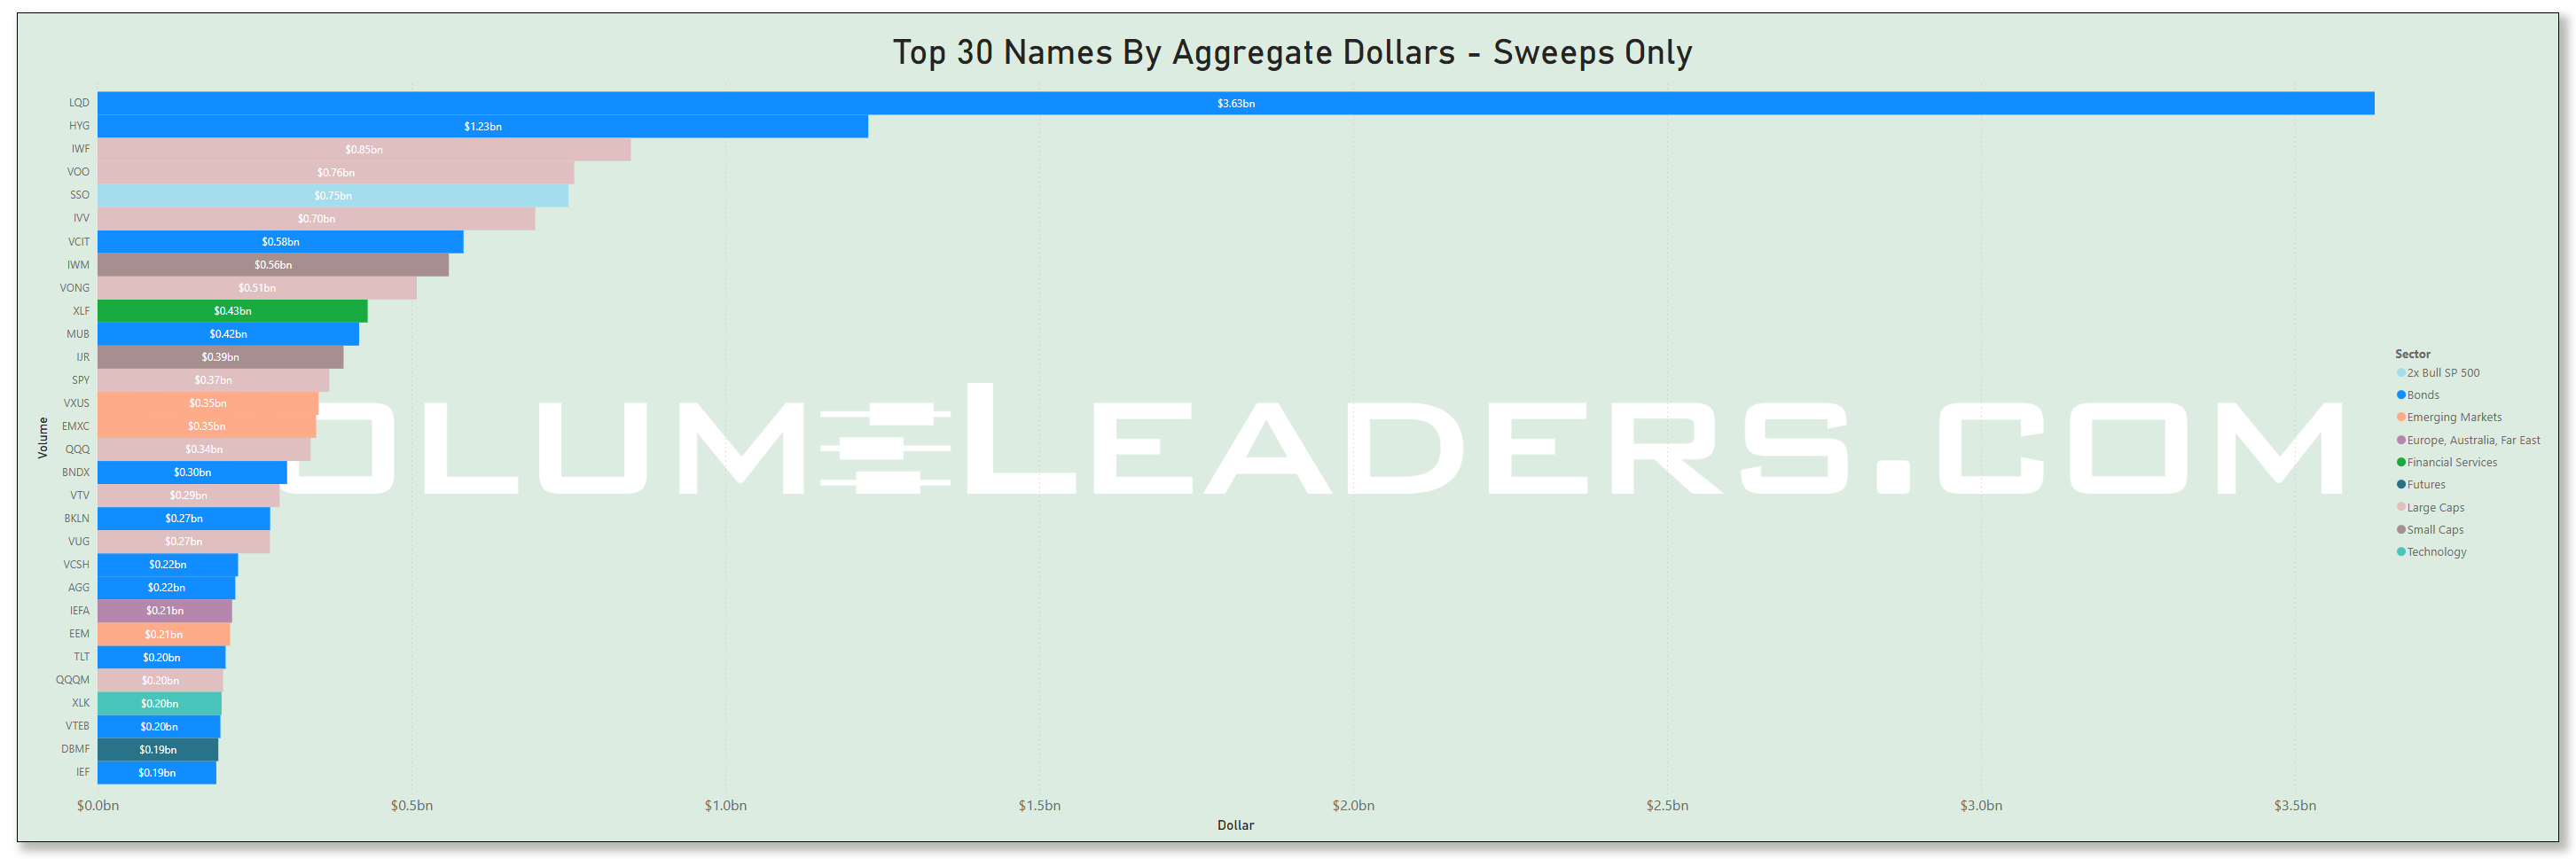
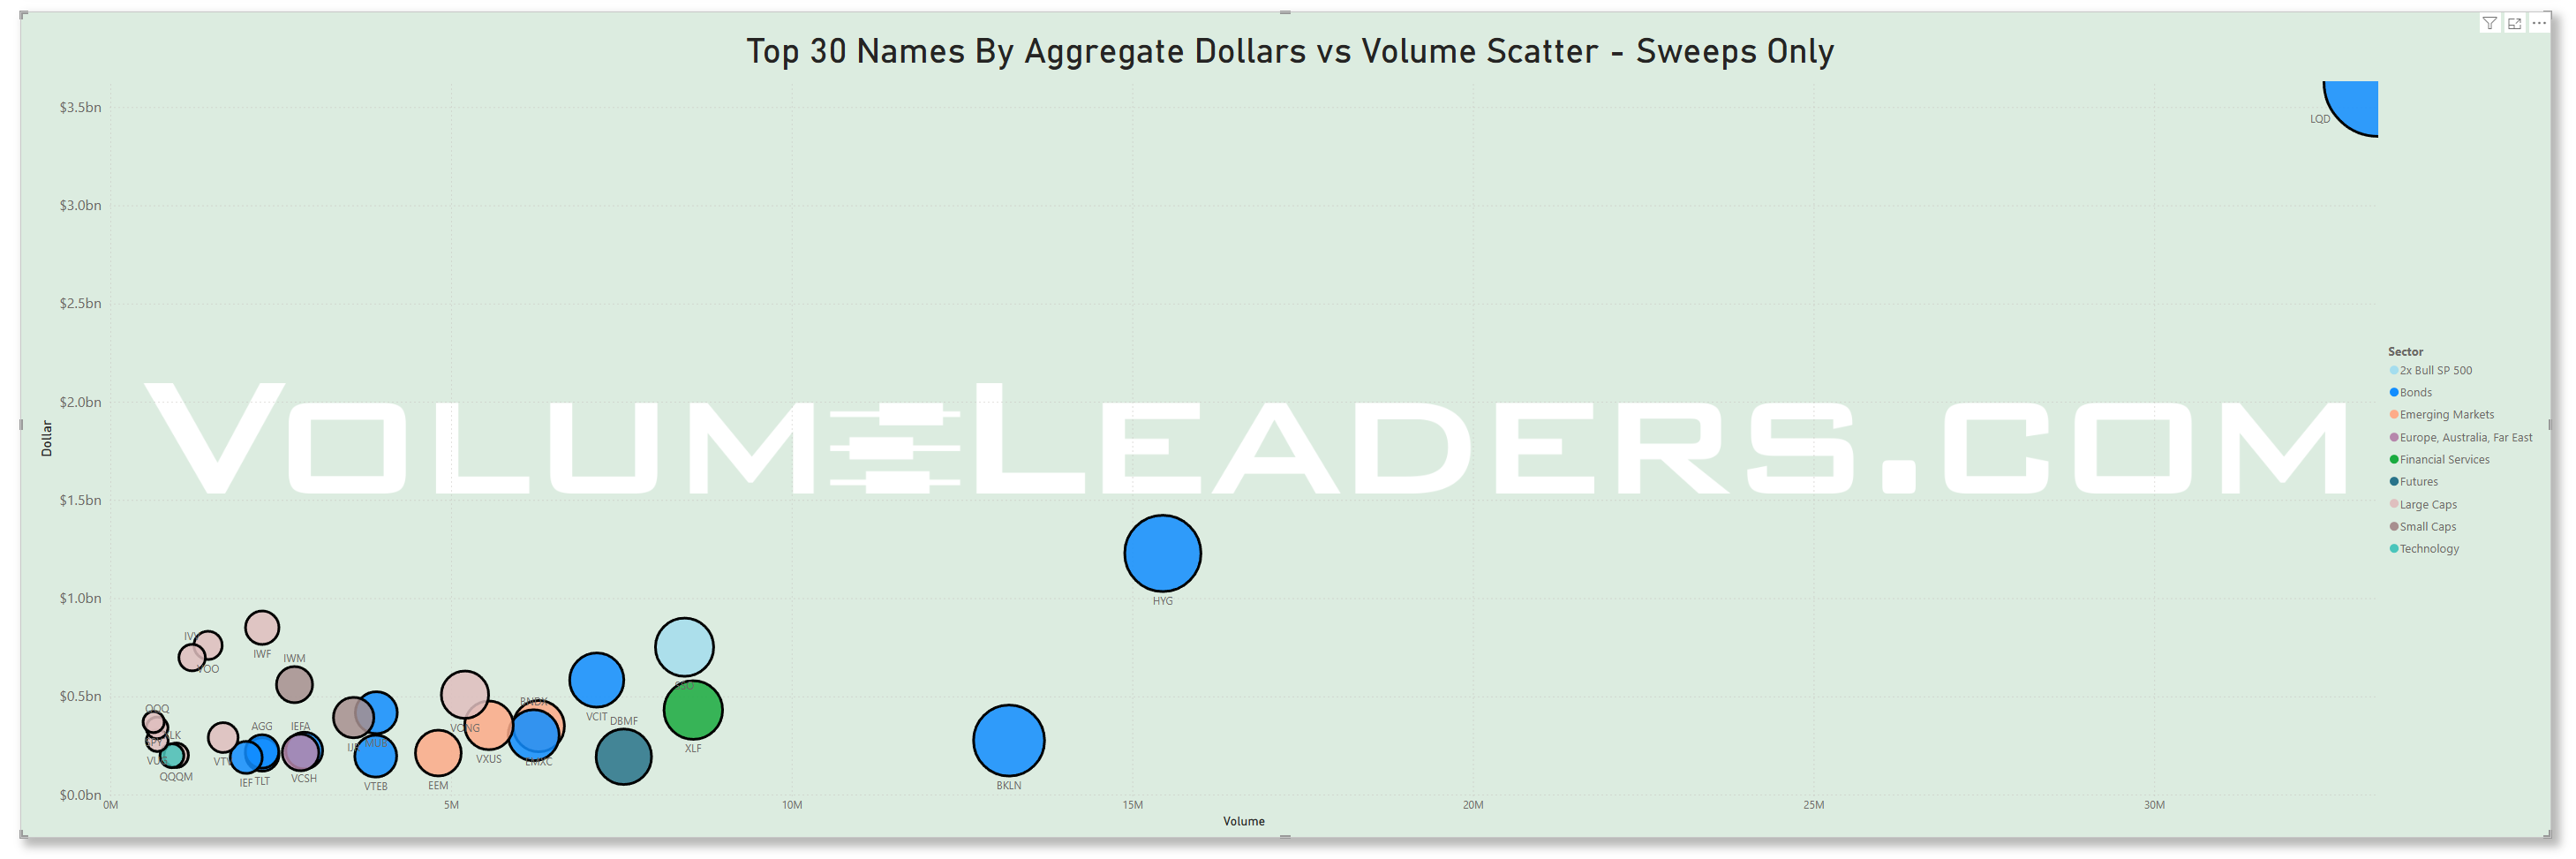
Many excellent trade ideas and sources of inspiration can be found in these prints below. While only the top 30 from each group are displayed, the complete results are accessible in VolumeLeaders.com for you to explore at your convenience any time. Remember to configure trade alerts within the platform to ensure institutional order flows that capture your interest or are significant to you aren’t missed. The blue charts encompass all types of trades, including blocks on lit exchanges; the purple charts exclusively depict dark pool trades; and the green charts represent sweeps only.
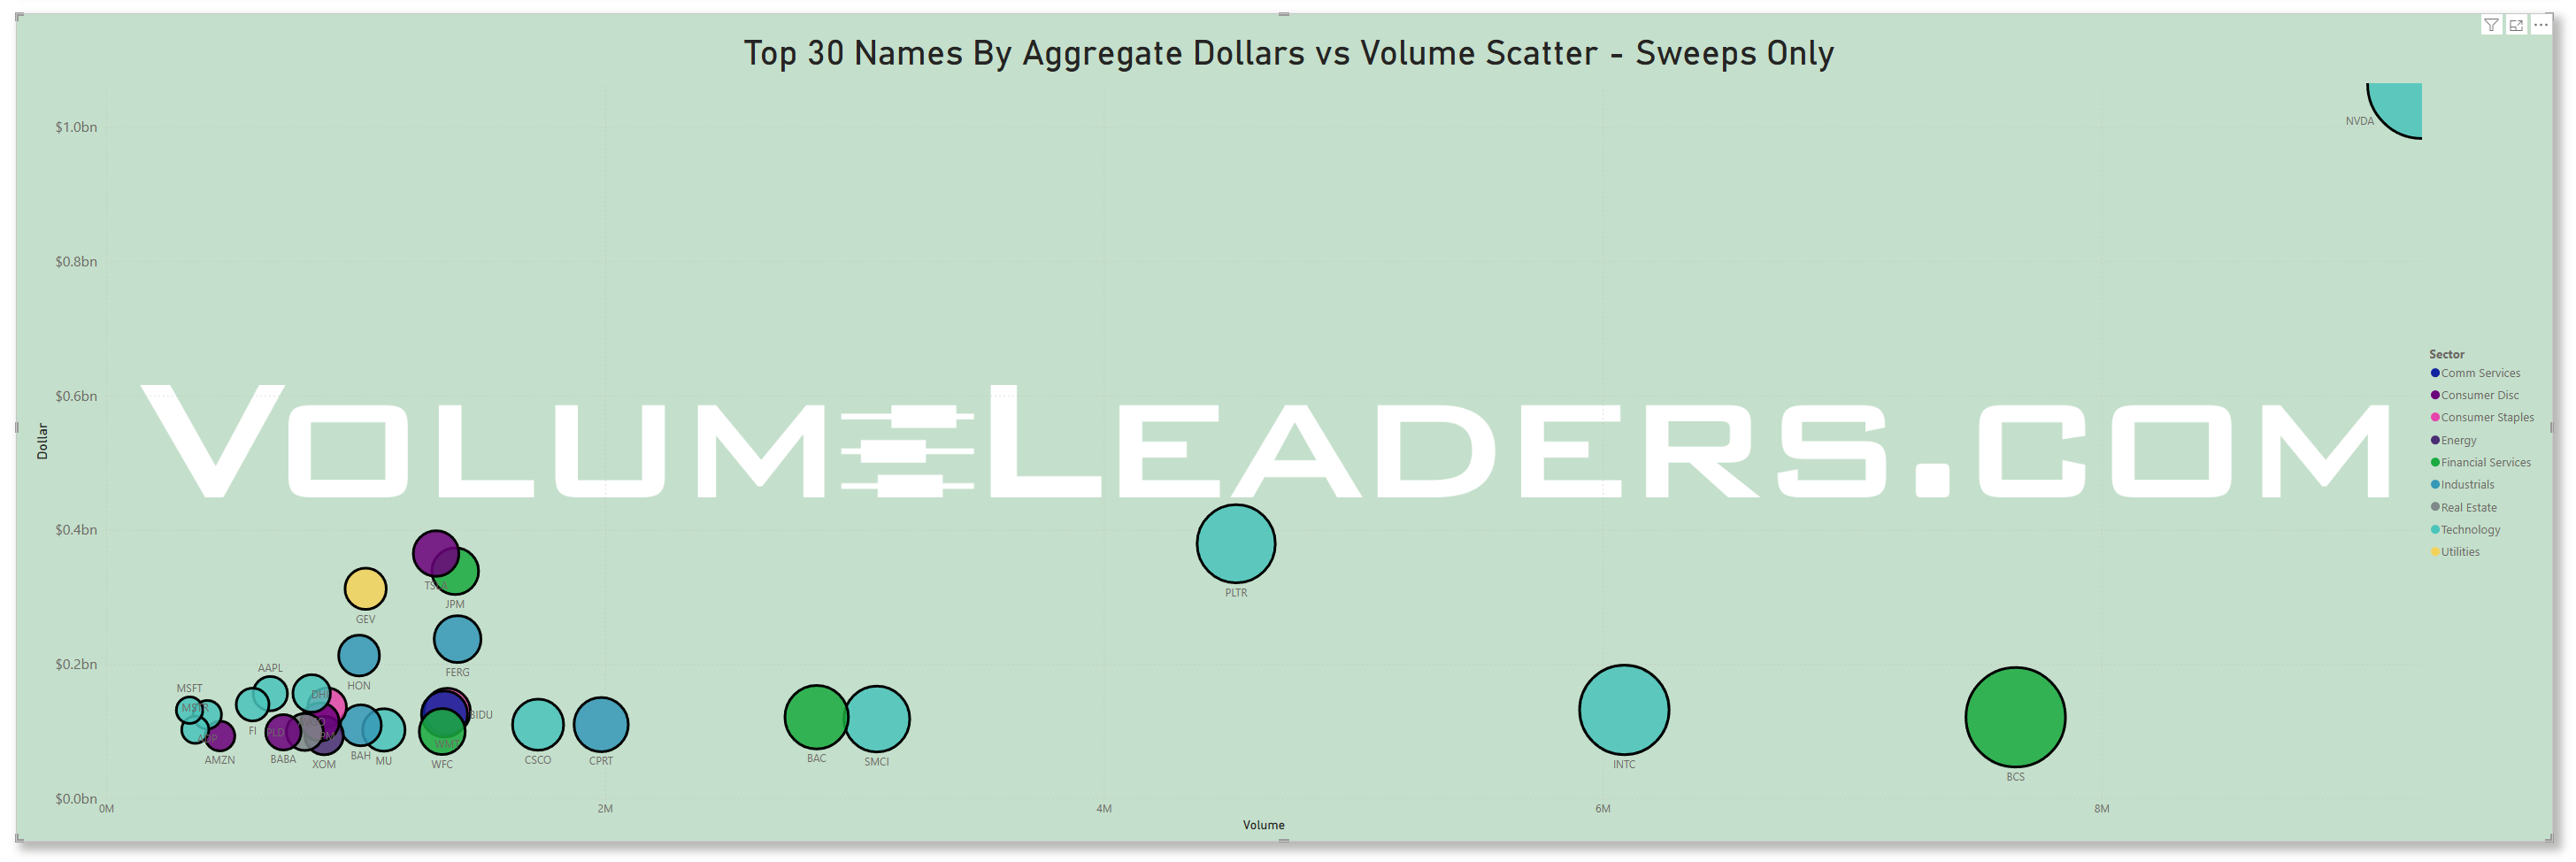
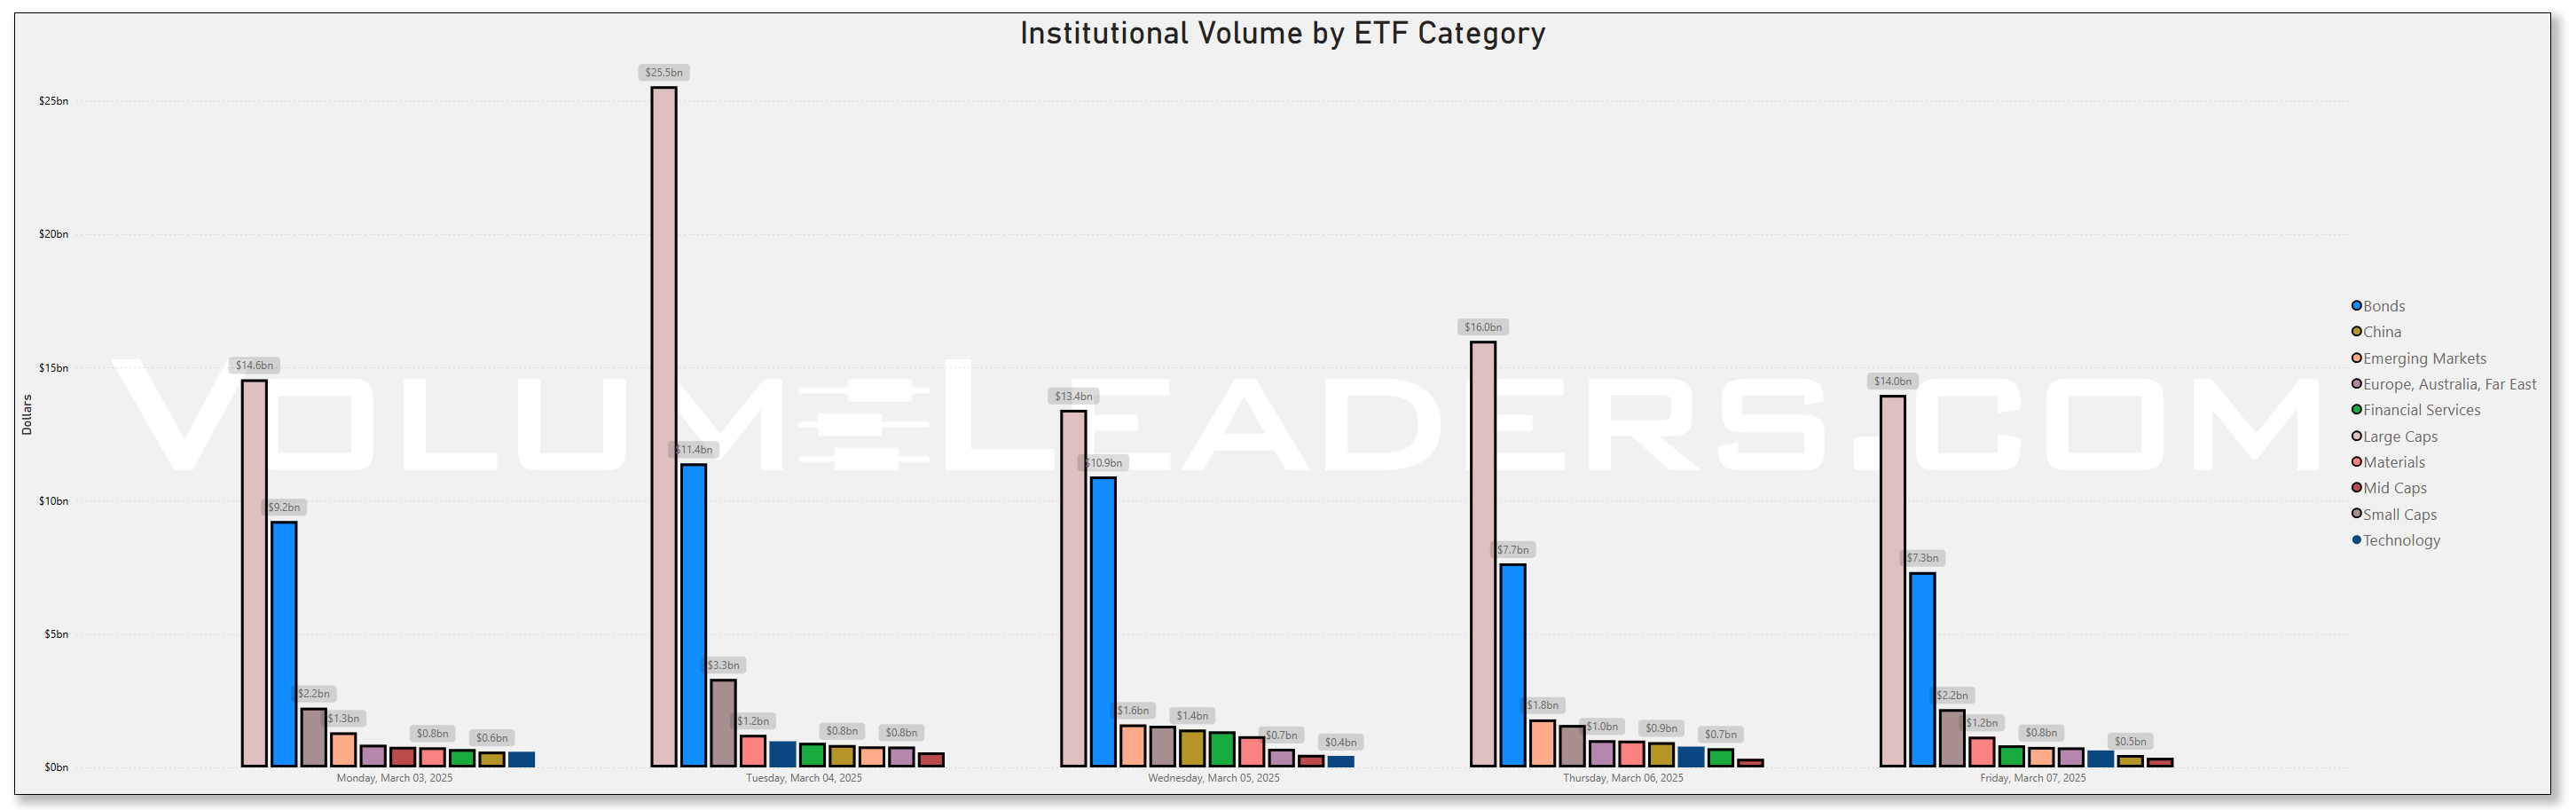
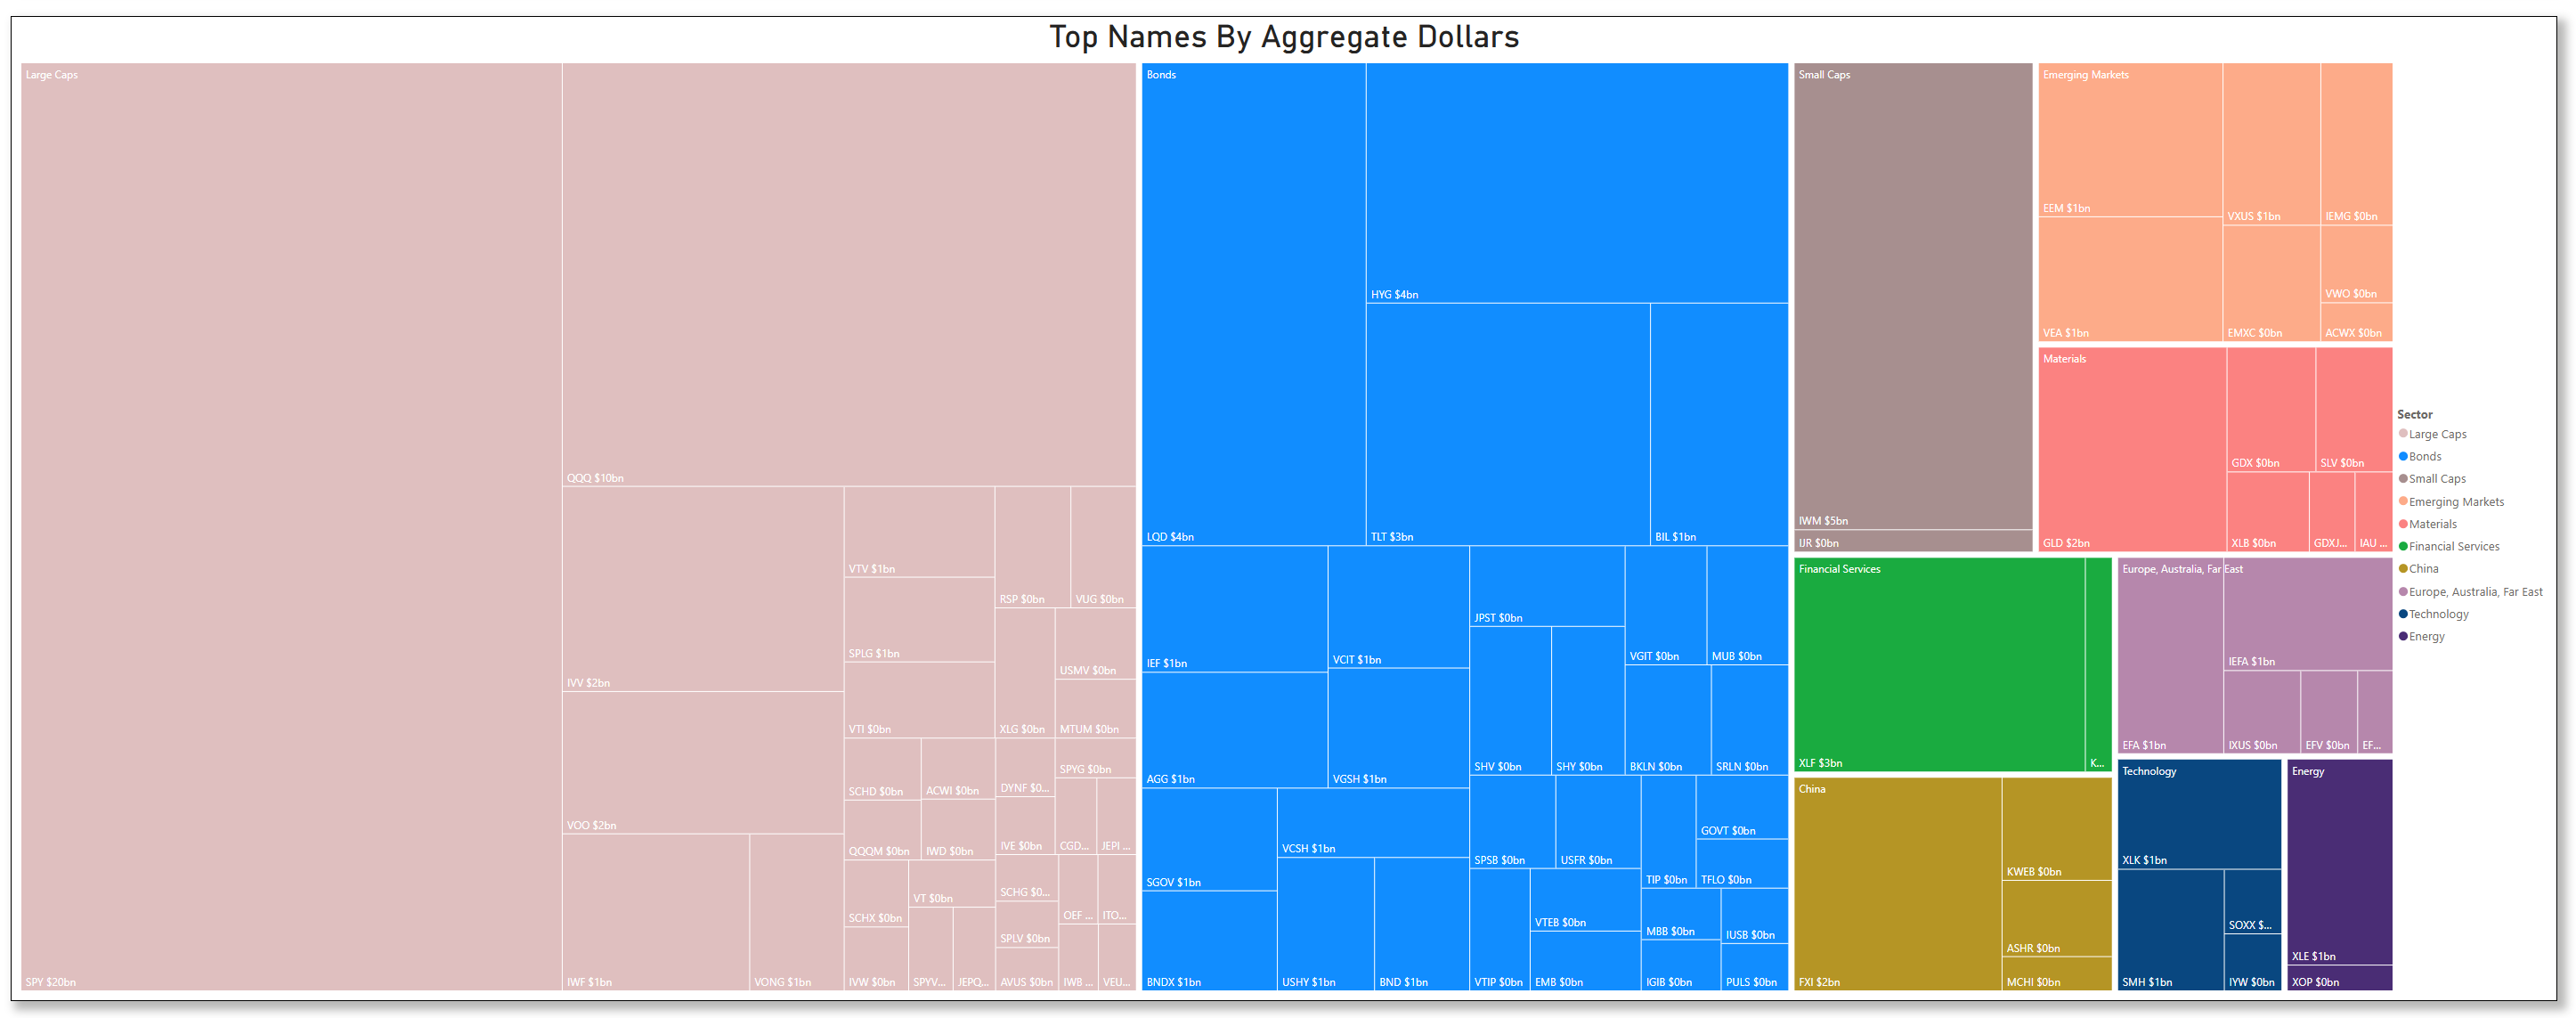
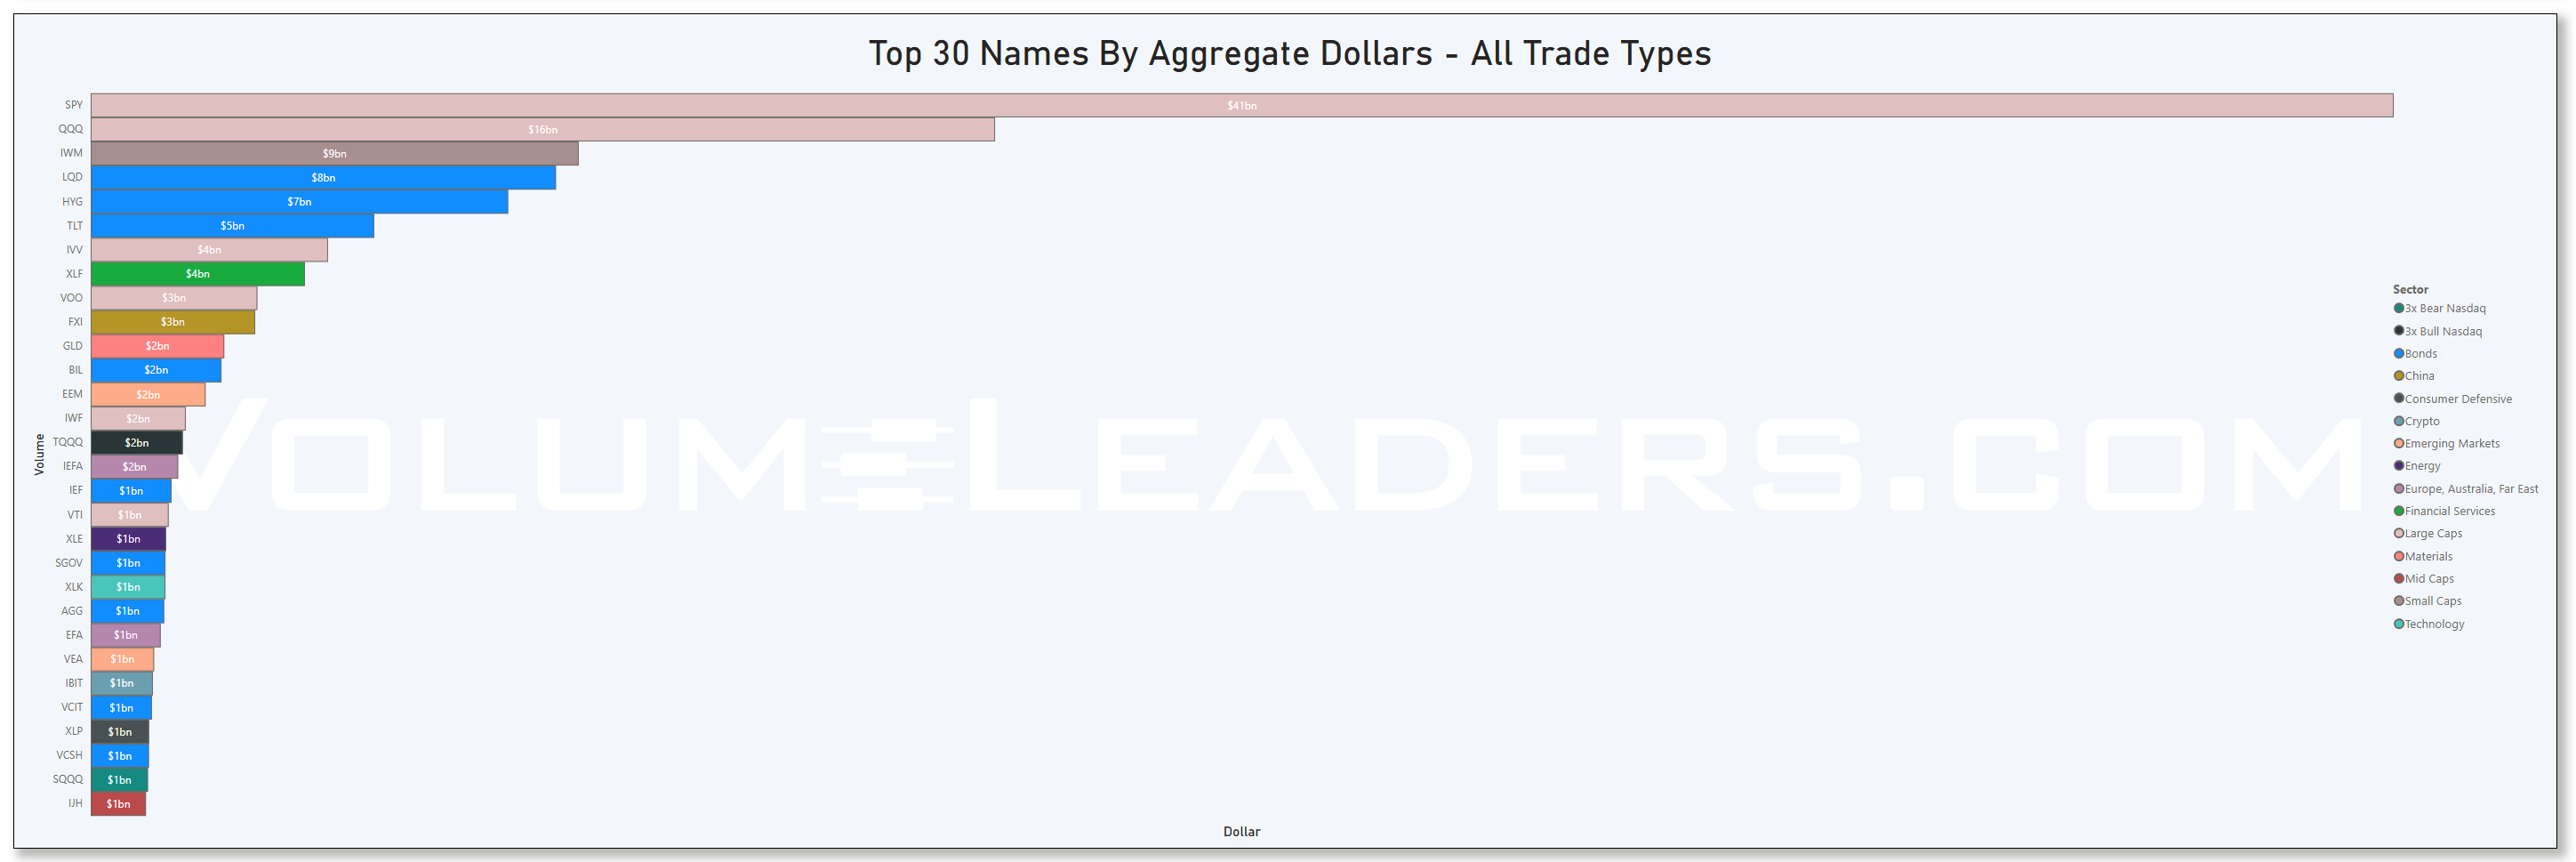
Top Institutional Order Flow In ETFs
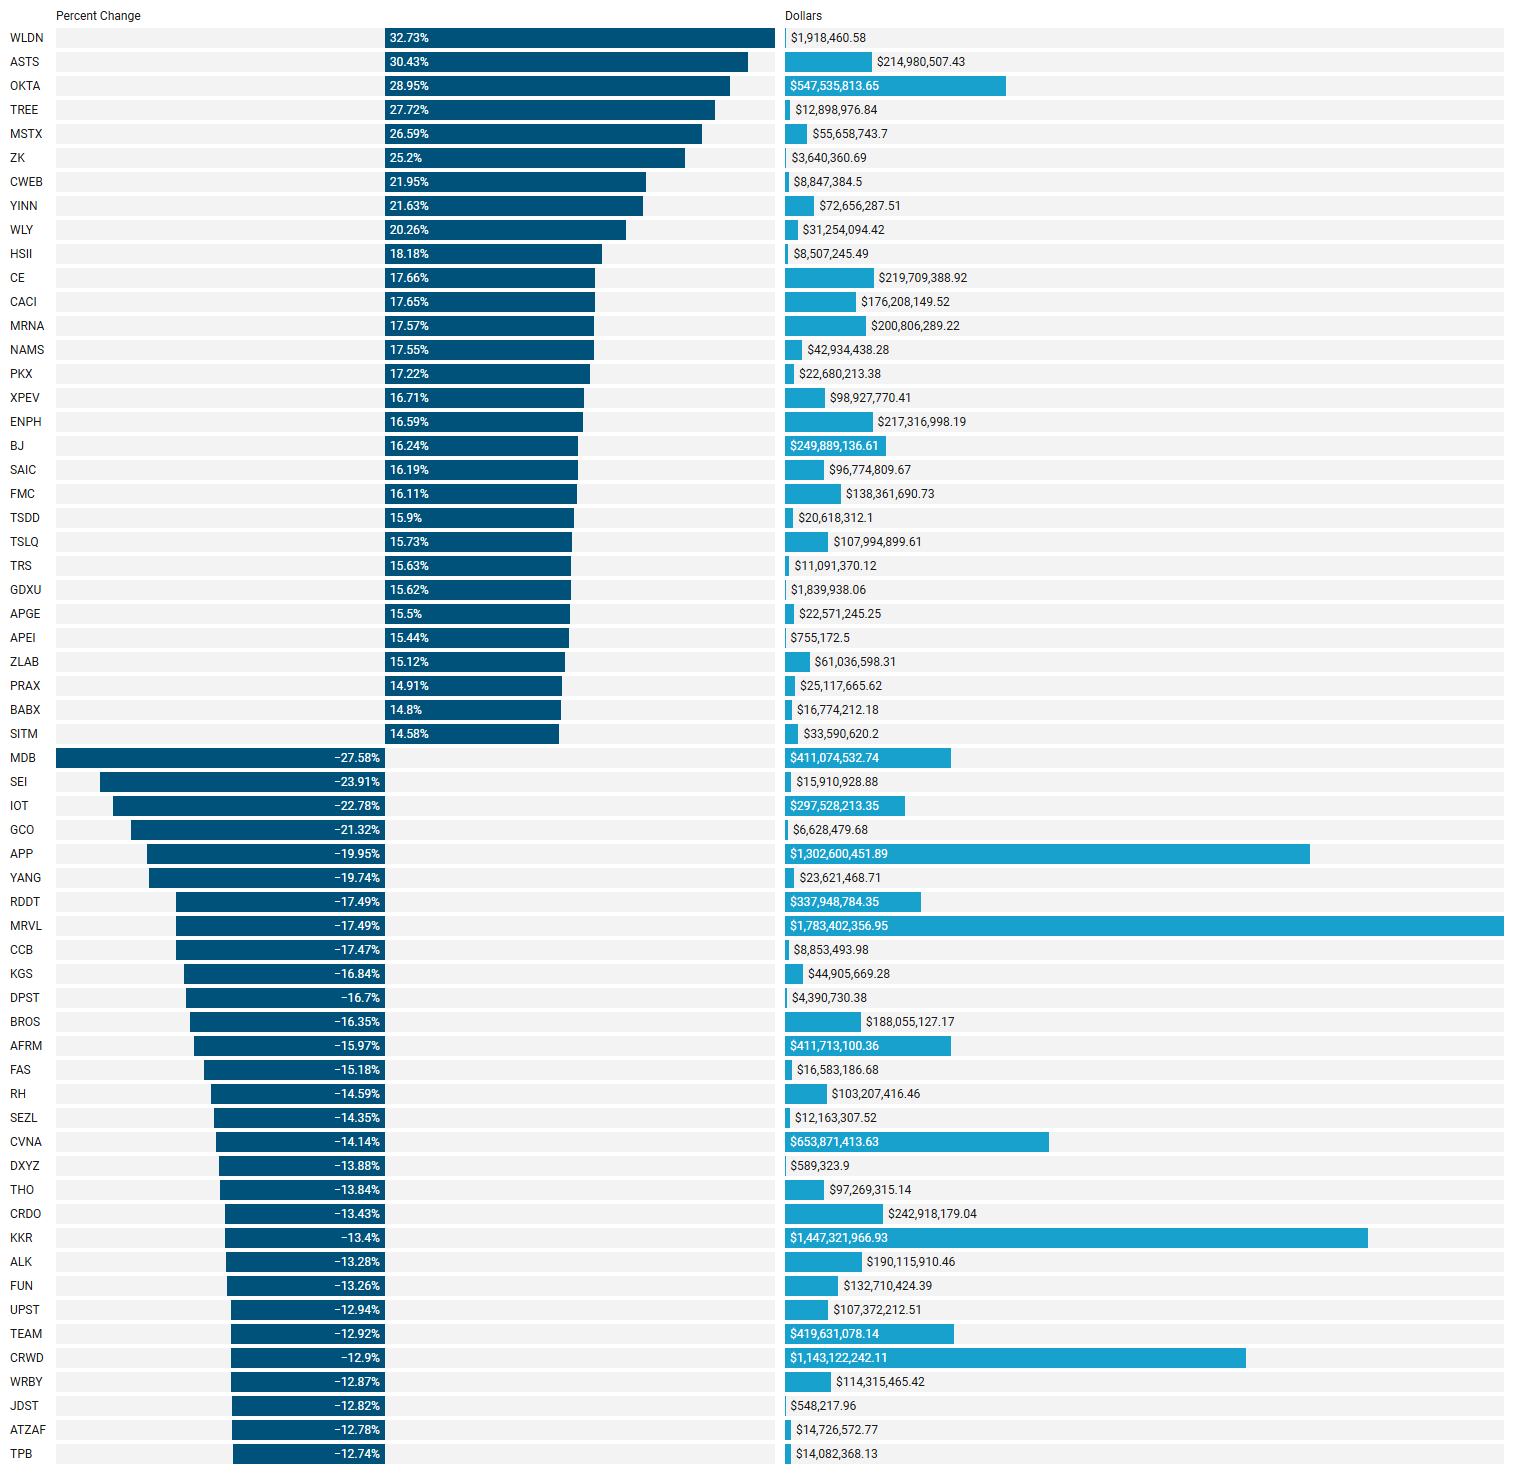
Last Week’s Institutionally-Backed Gainers & Losers
If you’re going to bet on a name, consider one that is officially endorsed by an institution! These are the top percent gainers (green) and percent losers (red) from this week’s open-to-close that had a trade price greater than $20 and institutional involvement. Continue watching tickers from this and prior stacks as these names frequently turn into multi-leg trades with a lot of movement!
Last Week’s Billion-Dollar Prints
Tickers that printed a trade worth at least $1B last week get a special shout-out. These are massive commitments by institutions that should not be ignored.
[no prints this week]
Moneyflow Charts
Our unique Moneyflow charts work much like volume profile charts but we segment activity by trading week to provide valuable institutional participation information as a function of time and we normalize all plots to dollars - the one yardstick that consistently describes institutional involvement across all instruments. By examining how money flows across price levels over consecutive weeks, traders can identify important market structure developments and develop stunningly accurate plans for future price behavior.
Week-to-week analysis reveals how trading activity migrates across different price zones, showing the price development process and momentum changes. Large shifts between consecutive weeks often signal changing market sentiment, particularly when activity concentrates in new areas or distributes across large ranges.
For price predictions, large moneyflow nodes act as magnets for future price action, likely serving as support or resistance zones. They can also be quite choppy since institutions are frequently campaigning in these areas - accumulating or distributing within a range. Conversely, low activity areas between these nodes signal prices with little interest and often become zones where price is either rapidly rejected or price through moves quickly with little resistance. Price levels with consistent participation across multiple weeks indicate acceptance/fair-value, while single-week volume spikes that aren't revisited may signal rejection. The highest volume price level (Point of Control) frequently acts as a gravitational center for price to return to.
Key areas of interest for traders include shelves/clusters which represent potential support/resistance zones where institutional decisions to hold price were made; voids between nodes that serve as potential acceleration zones and are candidates for “filling” in future weeks; profile edges where volume tapers off, acting as significant barriers and area of no interest; dramatic week-to-week transitions indicating important market structure shifts; and the most recent week's moneyflow concentration showing where current control lies.
This analysis helps identify levels where institutional players have established positions, providing insight into potential support/resistance zones and areas where price might accelerate or reverse based on historical trading interest.
Note: Each color in the charts represents a week of institutional activity; Week 10 is the most recent trading week.
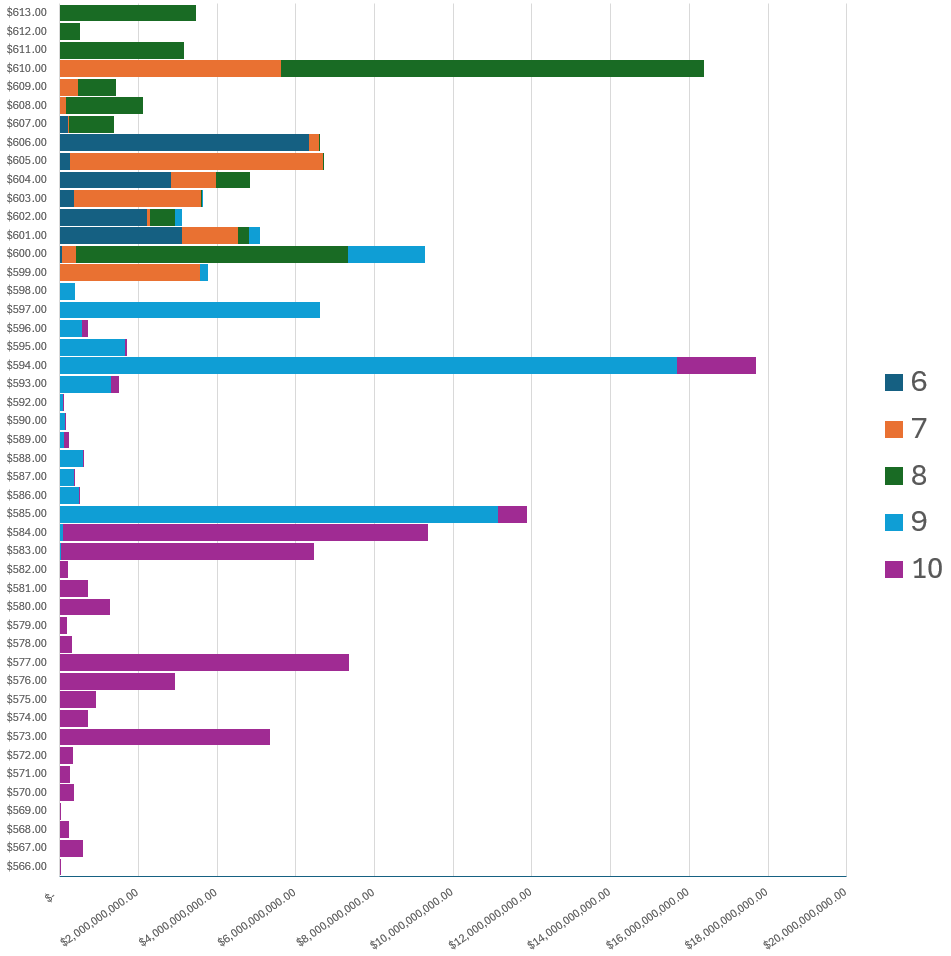
The most striking feature is the clear bipolar distribution of volume, with two distinct high-volume clusters separated by a significant void. This creates a "barbell" structure that often leads to volatile price action.
In the higher price range ($594-610), we see substantial volume from weeks 6-9, particularly the massive concentration at $594 and another significant node at $600-610. These represent prior zones where institutions established positions.
The lower price range ($573-585) shows heavy recent activity (week 10, purple), particularly at $585, $583, and $577. This indicates the market is currently establishing a new value area significantly lower than previous weeks.
Current price ($575.92) sits within this new lower volume cluster dominated by week 10 activity. This suggests we're in a "price discovery" phase after a significant breakdown from the higher value area.
From a technical perspective, this profile indicates:
A failed breakout and rejection at the previous value area ($600-610)
A rapid move through the low-volume void area ($585-593)
Current consolidation in a new lower value zone ($573-585)
Looking forward, the $585 level appears critical - it marks the boundary between the lower value area and the low-volume void. Any move back above $585 could accelerate quickly through the void toward the upper volume node at $594.
Conversely, the thin volume below the current price suggests that further downside movement could accelerate rapidly if support around $573-577 fails to hold.
If this week decides to remain rangebound, you can expect back-and-forth action between either pair of HVNs in the lower part of the profile.
This pattern typically indicates a market in transition, with institutions repositioning from a previously established value area to a new, lower value area - often seen during sentiment shifts or following significant macro catalysts.
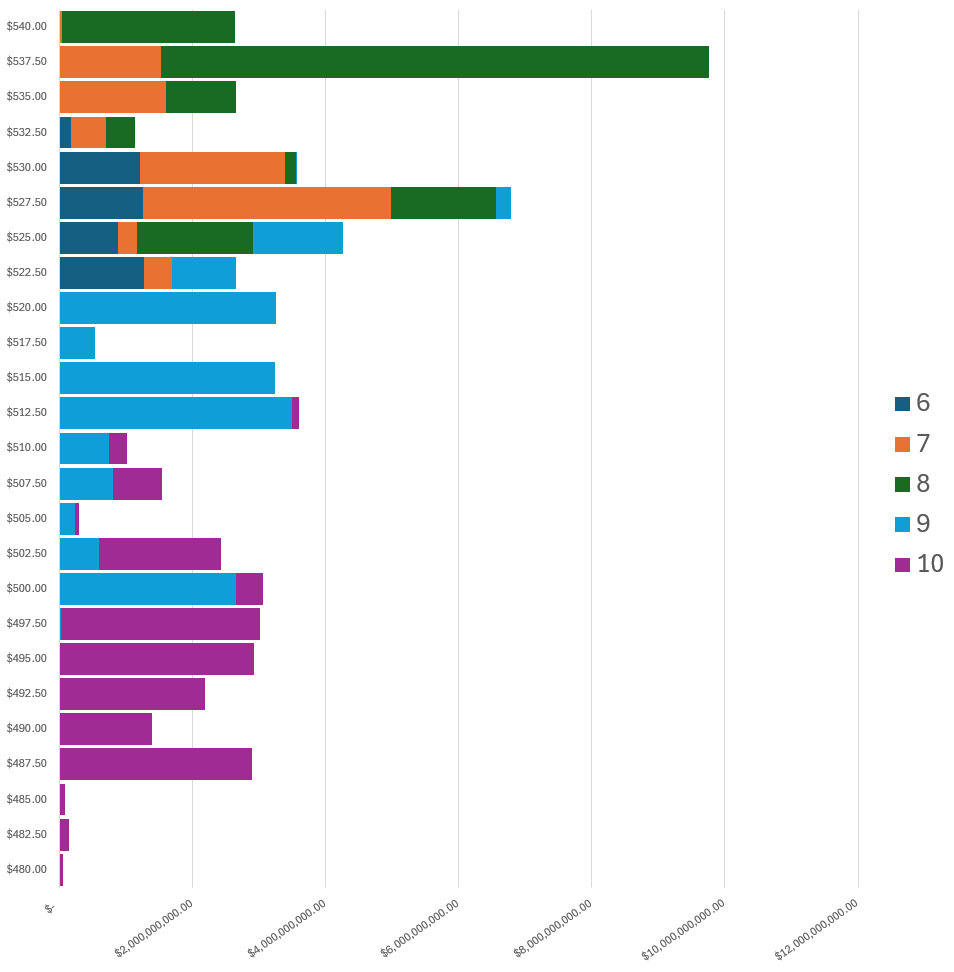
The chart displays a clearly bifurcated market structure, with two distinct high-volume nodes separated by a significant low-volume area. This creates a "barbell" distribution pattern that suggests potential volatility.
The upper high-volume node ($525-540) shows substantial institutional activity during weeks 6-8, with particularly heavy concentration at $537.50 (primarily week 8, green). This represents the previous value area where significant positions were established.
The lower high-volume node ($487.50-500) is dominated by week 10 (purple) activity, indicating recent price acceptance at these lower levels. The most significant recent volume is concentrated at $495-500, suggesting a new value area is forming well below the previous one.
The current price ($491.79) sits within this lower volume cluster and aligns with week 10's price discovery zone. This positioning within the newer, lower value area suggests the market is still working through a repricing process after rejecting the higher range.
From a technical perspective:
The market has undergone a significant breakdown from the $525-540 value area
Price moved rapidly through the thin volume zone ($505-520)
New accumulation is happening in the $487.50-500 range
Looking forward, the $500-505 level appears critical as resistance, marking the upper boundary of the current value area. Any move above this could accelerate through the low-volume zone toward $512-515, where some resistance exists.
To the downside, support appears at $487.50-490, with the next significant volume shelf at $485. The volume shelf at $485 is a notable feature as these areas tend to get revisited and eventually break-down. A break below these levels could accelerate downward momentum due to limited volume support beneath.
This profile structure is typical of markets experiencing a significant sentiment shift, with institutional positioning moving from a previously established value area to a new, lower zone - often seen during sector rotations or following major macro catalysts.
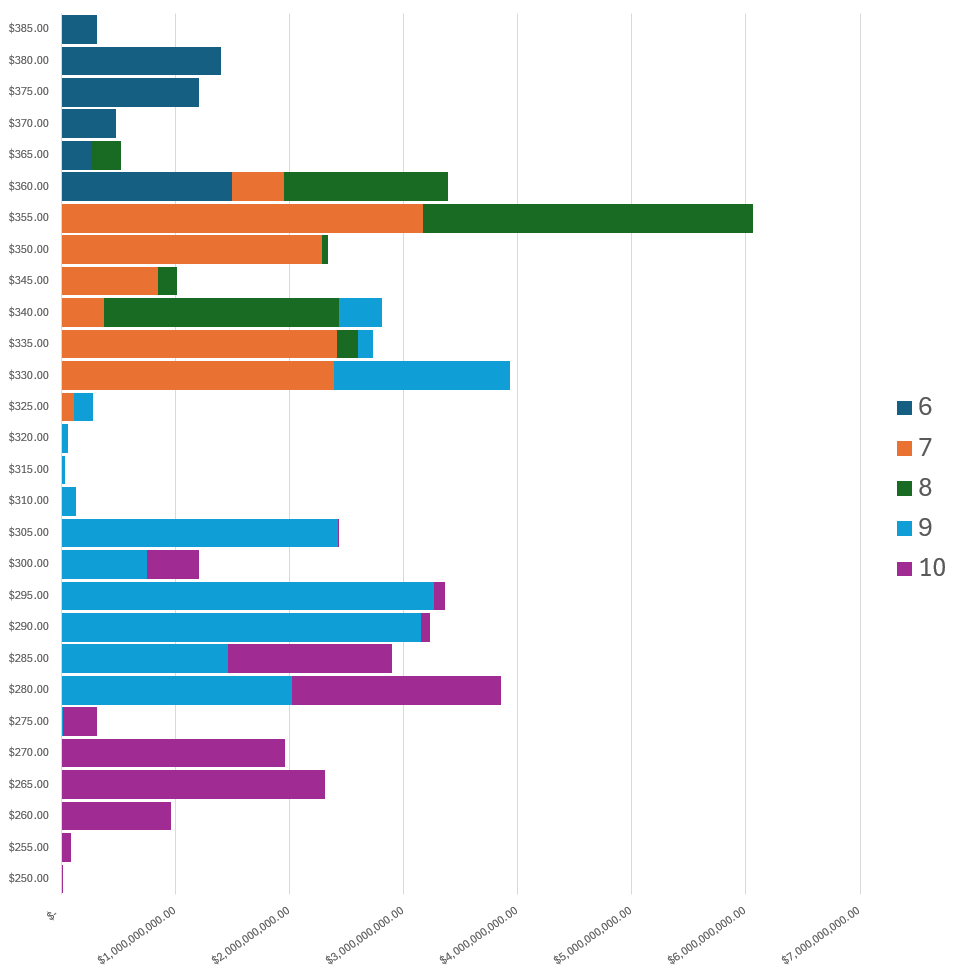
This chart reveals a clearly defined multi-modal distribution with the current price positioned in the lower volume cluster.
The current price ($262.67) sits within the most recent trading zone dominated by week 10 (purple) volume, specifically between the $260-265 levels. This places the price squarely within a significant lower volume node that has developed primarily in the most recent trading week.
From a technical perspective, this structure indicates:
Price has undergone a major breakdown from the previous high-volume areas ($330-365)
The market has established a new lower value area ($265-295) with the heaviest recent activity at $280-290 and $265-270
The current level shows some volume support, but is near the lower boundary of this newer value area
What's particularly notable is the clear migration of trading activity downward over time, with weeks 6-7 concentrated in the upper ranges, weeks 7-9 in the middle, and weeks 9-10 in the lower band. This progression indicates a persistent bearish sentiment shift.
The most significant technical levels to watch now are:
Immediate resistance at $270
Stronger resistance at $280 where substantial recent volume exists
Major resistance at $305-310, marking the boundary to the low volume node that separates current fair value from prior fair value
Support appears thin below current levels, with only minimal volume below $260
This profile structure suggests TSLA remains vulnerable to further downside pressure given the relatively weak volume support below current price. However, the concentration of recent activity (week 10) at these levels could indicate an attempt to establish a new floor.
The extensive low-volume gaps between the three major volume nodes ($305-330 and $345-355) suggest that the success of any recovery attempt can be measured by successfully pushing through each of these zones or failing at them.
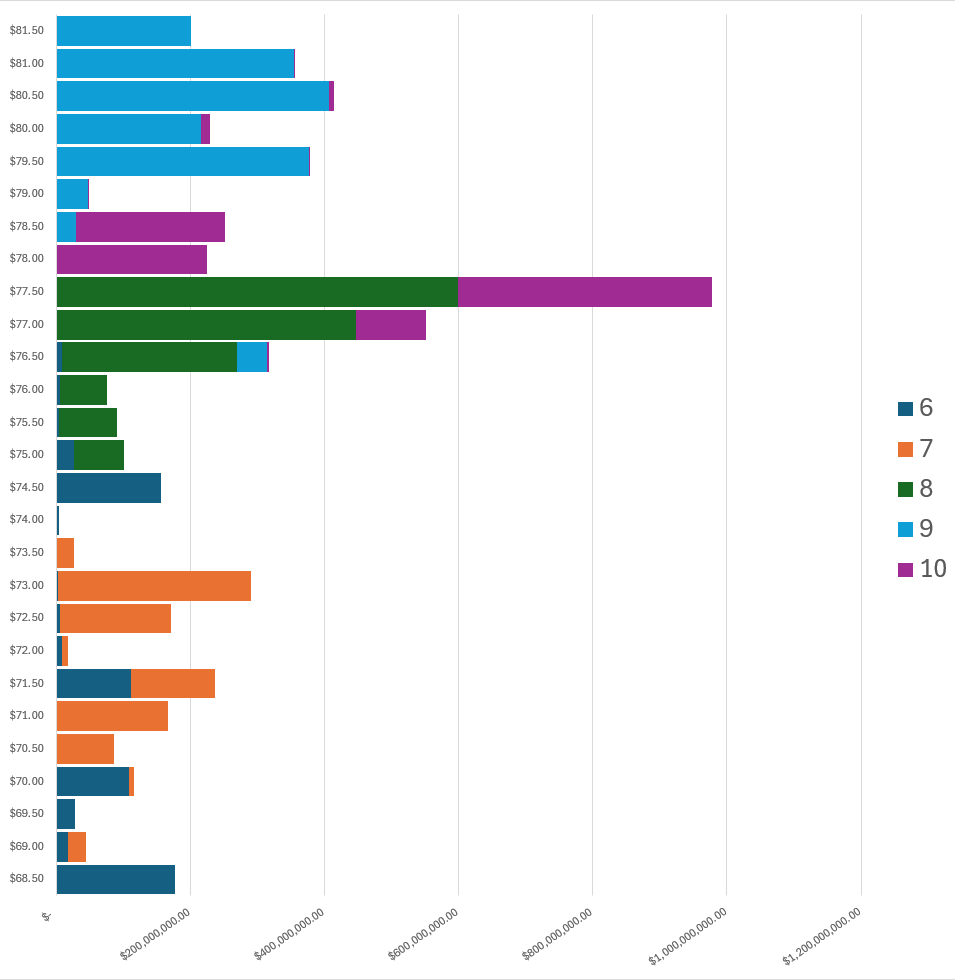
This profile reveals a distinct bipolar distribution with two clearly separated high-volume nodes and the current price positioned right at the edge of a transition zone.
The most striking feature is the massive volume concentration at $77.50, which includes heavy participation from both week 8 (green) and week 10 (purple). This represents the single largest volume node on the chart and suggests a critical price level that has attracted significant institutional interest over multiple weeks.
The current price ($78.59) sits just above this major support/resistance level at $77.50, positioning it at a crucial decision point. This price is also within a zone ($78-79) that has seen growing week 10 (purple) activity, indicating recent price acceptance at these slightly higher levels.
The volume distribution shows:
A lower volume cluster ($68.50-74) primarily from weeks 6-7 (blue/orange)
A high-volume middle zone centered at $77-77.50 with multi-week participation
An upper volume cluster ($79-81) dominated by week 9 (blue)
Technically, this structure suggests:
Extremely strong support at $77.50, which appears to be the fulcrum point for this stock
Immediate resistance at $79-79.50 where substantial week 9 volume exists
A potential air pocket between $74-76 that could lead to rapid movement if support fails
What's particularly significant is the heavy recent (week 10) participation at both $77.50 and $78-78.50, suggesting active price discovery and acceptance forming around the current level.
The profile indicates NKE is at a critical juncture, having rebounded from the major volume node at $77.50. The substantial volume at this level suggests strong buying interest has emerged, potentially creating a floor. However, the prior week's activity was concentrated higher, showing how price has been under pressure.
Watch for either continued consolidation above $77.50 as a bullish sign or a break below this critical level, which could trigger accelerated downside given the relatively thin volume support immediately below.
Investments In Focus: Bull vs Bear Arguments
Institutions leave footprints that VolumeLeaders.com can illustrate for you while providing context to assess things like institutional conviction and urgency. Theses and data given below are not financial advice, just personal observations that may be wrong; consult a certified financial advisor before making any investment decisions.
CNX 0.00%↑
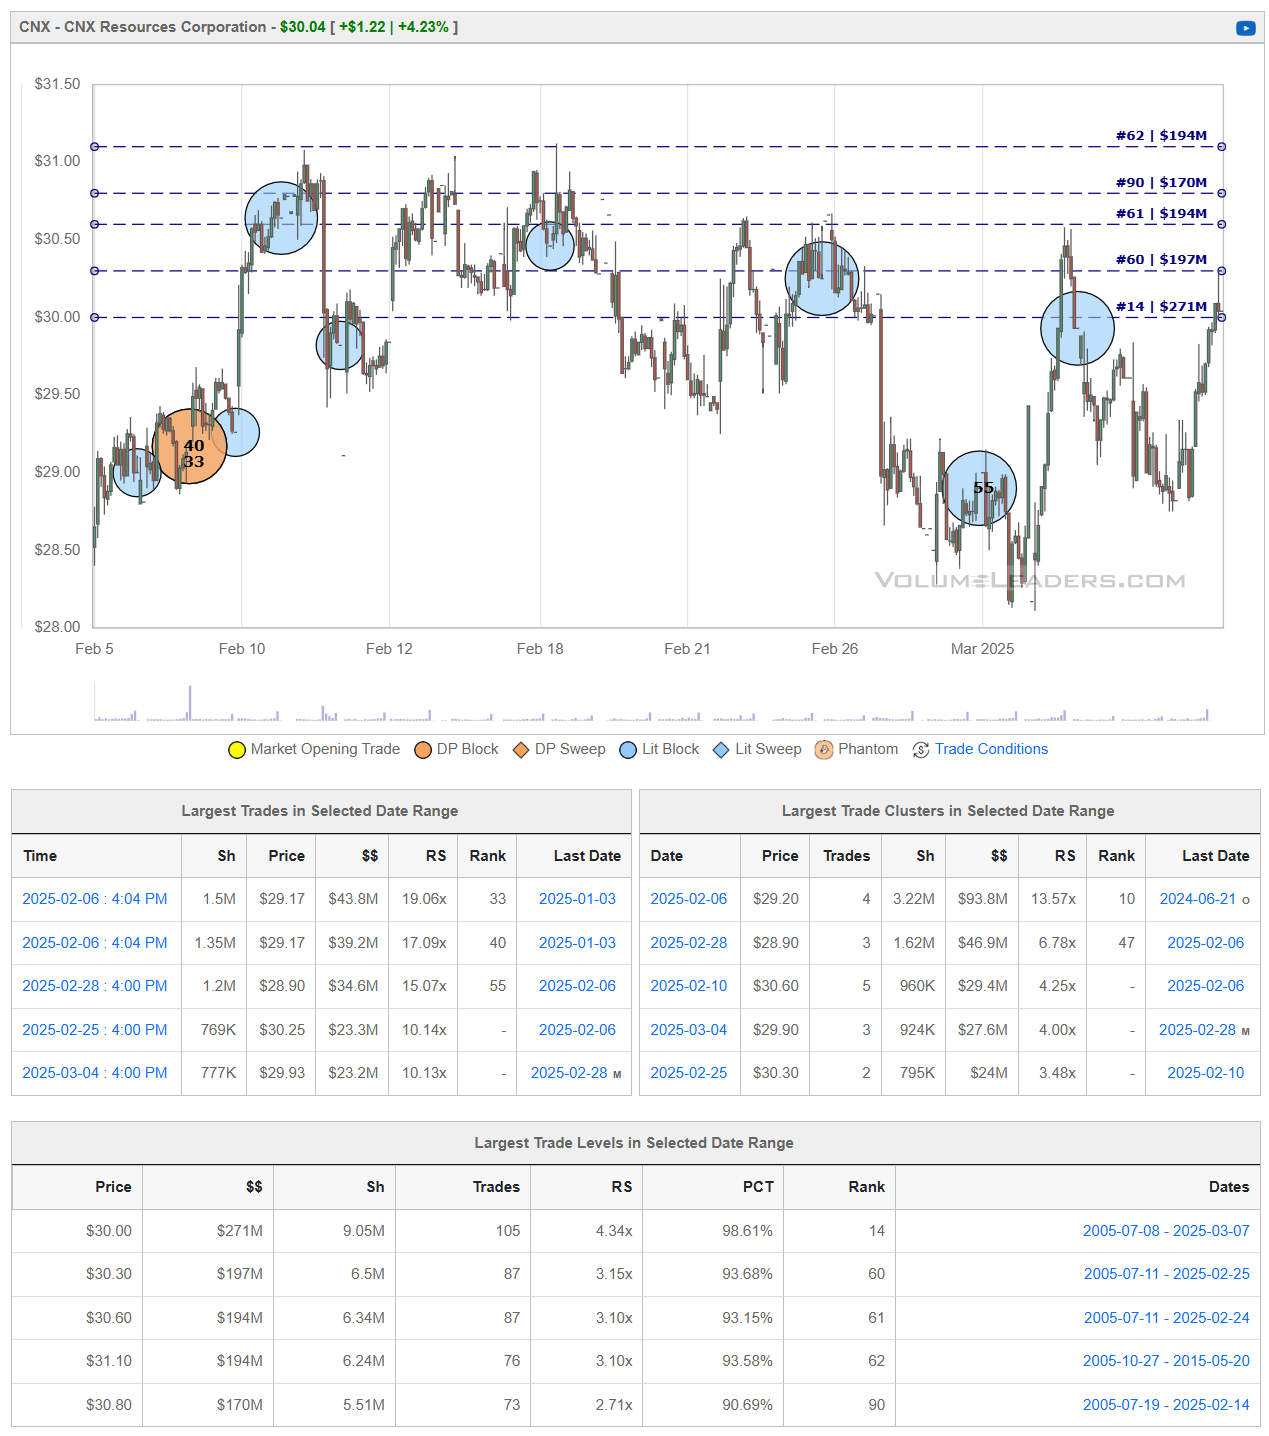
CNX Resources Corporation (NYSE: CNX) is an independent natural gas development, production, midstream, and technology company centered in the Appalachian Basin. The company focuses on unconventional shale formations, primarily the Marcellus and Utica Shales in Pennsylvania, Ohio, and West Virginia, and operates Coalbed Methane (CBM) properties in Virginia.
Recent Developments:
Acquisition of Apex Energy: In January 2025, CNX Resources completed the acquisition of Apex Energy, enhancing its natural gas upstream and midstream assets in the Appalachian Basin. This strategic move aims to bolster CNX's production capabilities and expand its operational footprint in the region.
Financial Performance: For the fourth quarter of 2024, CNX reported earnings per share (EPS) of $0.57, surpassing analysts' expectations of $0.43. The company's positive return on equity of 6.72% reflects effective management and operational efficiency.
Senior Notes Offering: In January 2025, CNX successfully closed a private placement of $200 million in 7.250% senior notes due 2032. This capital infusion is expected to support the company's ongoing projects and strategic initiatives.
Leadership Update: In December 2023, Timothy S. Bedard was appointed as Executive Vice President, General Counsel, and Corporate Secretary of CNX Resources, bringing extensive legal and regulatory experience to the company's leadership team.
Bullish Perspective:
Strategic Acquisitions: The acquisition of Apex Energy positions CNX to increase its production capacity and capitalize on synergies within the Appalachian Basin, potentially leading to enhanced revenues and market share.
Strong Financial Metrics: Exceeding earnings expectations and maintaining a positive return on equity indicate robust financial health and operational effectiveness, which can attract investors seeking stable returns.
Access to Capital: The successful senior notes offering demonstrates CNX's ability to secure funding for expansion and development projects, ensuring liquidity for future growth initiatives.
Bearish Perspective:
Market Volatility: The natural gas industry is subject to fluctuations in commodity prices, which can impact CNX's revenue and profitability.
Regulatory Challenges: Operating in multiple states with varying regulations may pose compliance risks and potential operational constraints for CNX.
Debt Obligations: The issuance of additional senior notes increases the company's debt load, which could affect its financial flexibility and interest coverage ratios.
In summary, CNX Resources Corporation's strategic acquisitions and solid financial performance highlight its potential for growth in the natural gas sector. However, investors should remain cognizant of industry volatility, regulatory complexities, and the implications of increased debt on the company's financial health.
RIO 0.00%↑
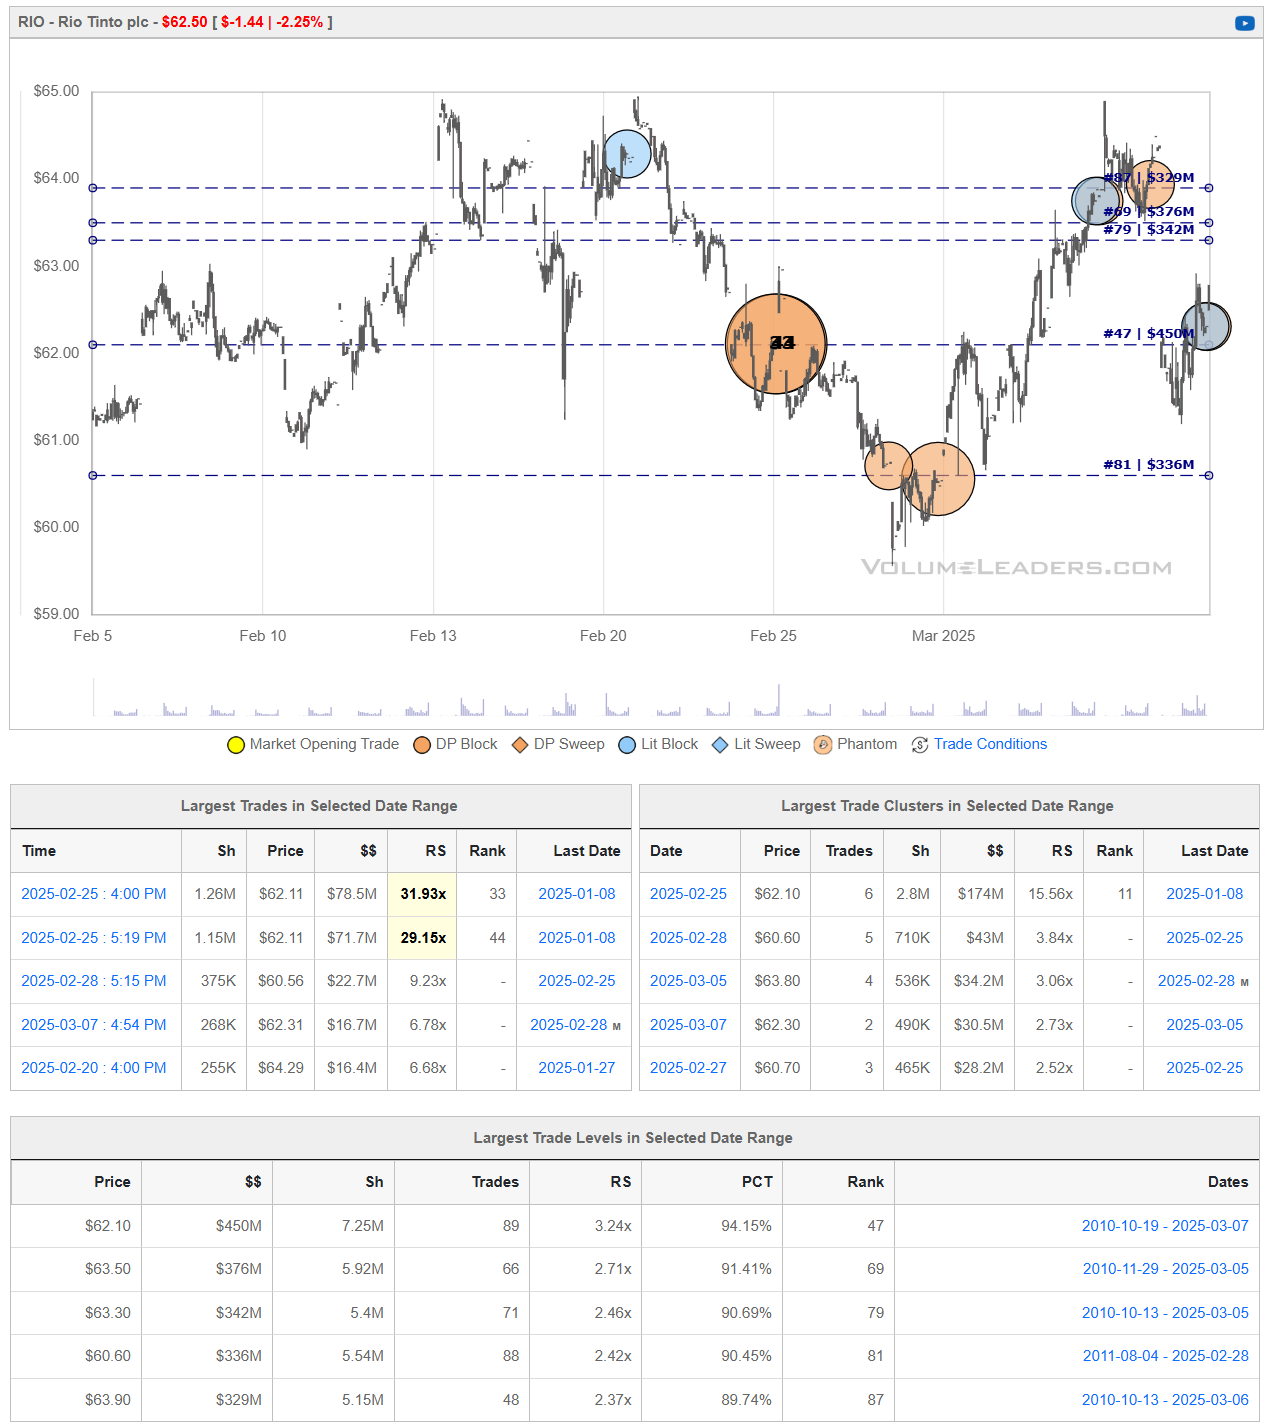
Rio Tinto Group (NYSE: RIO) is a leading Anglo-Australian multinational mining and metals corporation, recognized as one of the world's largest producers of essential commodities such as iron ore, aluminum, copper, and diamonds. Established in 1873, the company operates across six continents, with significant activities in Australia and Canada.
Recent Developments:
Operational Resumption at Dampier Port: After a five-week closure due to flooding from tropical cyclones, Rio Tinto resumed operations at its Dampier port in Western Australia. The disruptions led to an estimated loss of 13 million metric tons in iron ore production. Despite this setback, the company maintains its full-year shipment guidance for 2025 at 323-338 million metric tons.
Development of Brockman Syncline 1 Iron Ore Mine: Rio Tinto announced plans to develop the Brockman Syncline 1 iron ore mine in the Pilbara region, expected to create approximately 1,000 jobs during construction. This initiative aims to extend operational life in the Brockman area and secure iron ore supply amid declining grades. The project has received necessary government approvals and was planned in consultation with traditional landowners. Production is anticipated to commence by 2027.
Shareholder Vote on Dual-Listing Structure: The company has agreed to allow Australian shareholders to vote on a resolution seeking an independent review of its dual-listing status. This decision comes after discussions with stakeholders, including London-based hedge fund Palliser Capital, and reflects Rio Tinto's commitment to addressing shareholder concerns and enhancing corporate governance.
Bullish Perspective:
Strategic Project Development: The advancement of the Brockman Syncline 1 project underscores Rio Tinto's commitment to sustaining long-term iron ore production. By leveraging existing infrastructure and engaging with local communities, the company is well-positioned to meet future demand and maintain its competitive edge.
Operational Resilience: The swift resumption of operations at the Dampier port following cyclone-induced disruptions highlights Rio Tinto's operational resilience and effective risk management strategies. Maintaining shipment guidance despite challenges demonstrates the company's robust planning and execution capabilities.
Proactive Corporate Governance: By facilitating a shareholder vote on its dual-listing structure, Rio Tinto exhibits a proactive approach to corporate governance. Engaging shareholders in significant structural decisions can enhance transparency, trust, and long-term investor confidence.
Bearish Perspective:
Production Disruptions: The recent five-week closure of the Dampier port due to cyclones resulted in a substantial loss of 13 million metric tons of iron ore production. Such environmental vulnerabilities could pose ongoing risks to operational stability and financial performance.
Labor Relations Challenges: Unions are actively seeking to initiate collective bargaining at Rio Tinto's Paraburdoo operations, accusing the company of misleading employees about the impacts of unionization. Potential labor disputes could lead to operational disruptions and increased labor costs.
Commodity Price Volatility: As a major producer of commodities like iron ore and aluminum, Rio Tinto's revenues are highly sensitive to global price fluctuations. Economic downturns or reduced demand from key markets, particularly China, could adversely affect profitability.
In summary, Rio Tinto Group continues to demonstrate strategic foresight through project development and shareholder engagement. However, investors should remain cognizant of operational risks, labor relations, and market volatility that could impact the company's future performance.
PAYC 0.00%↑
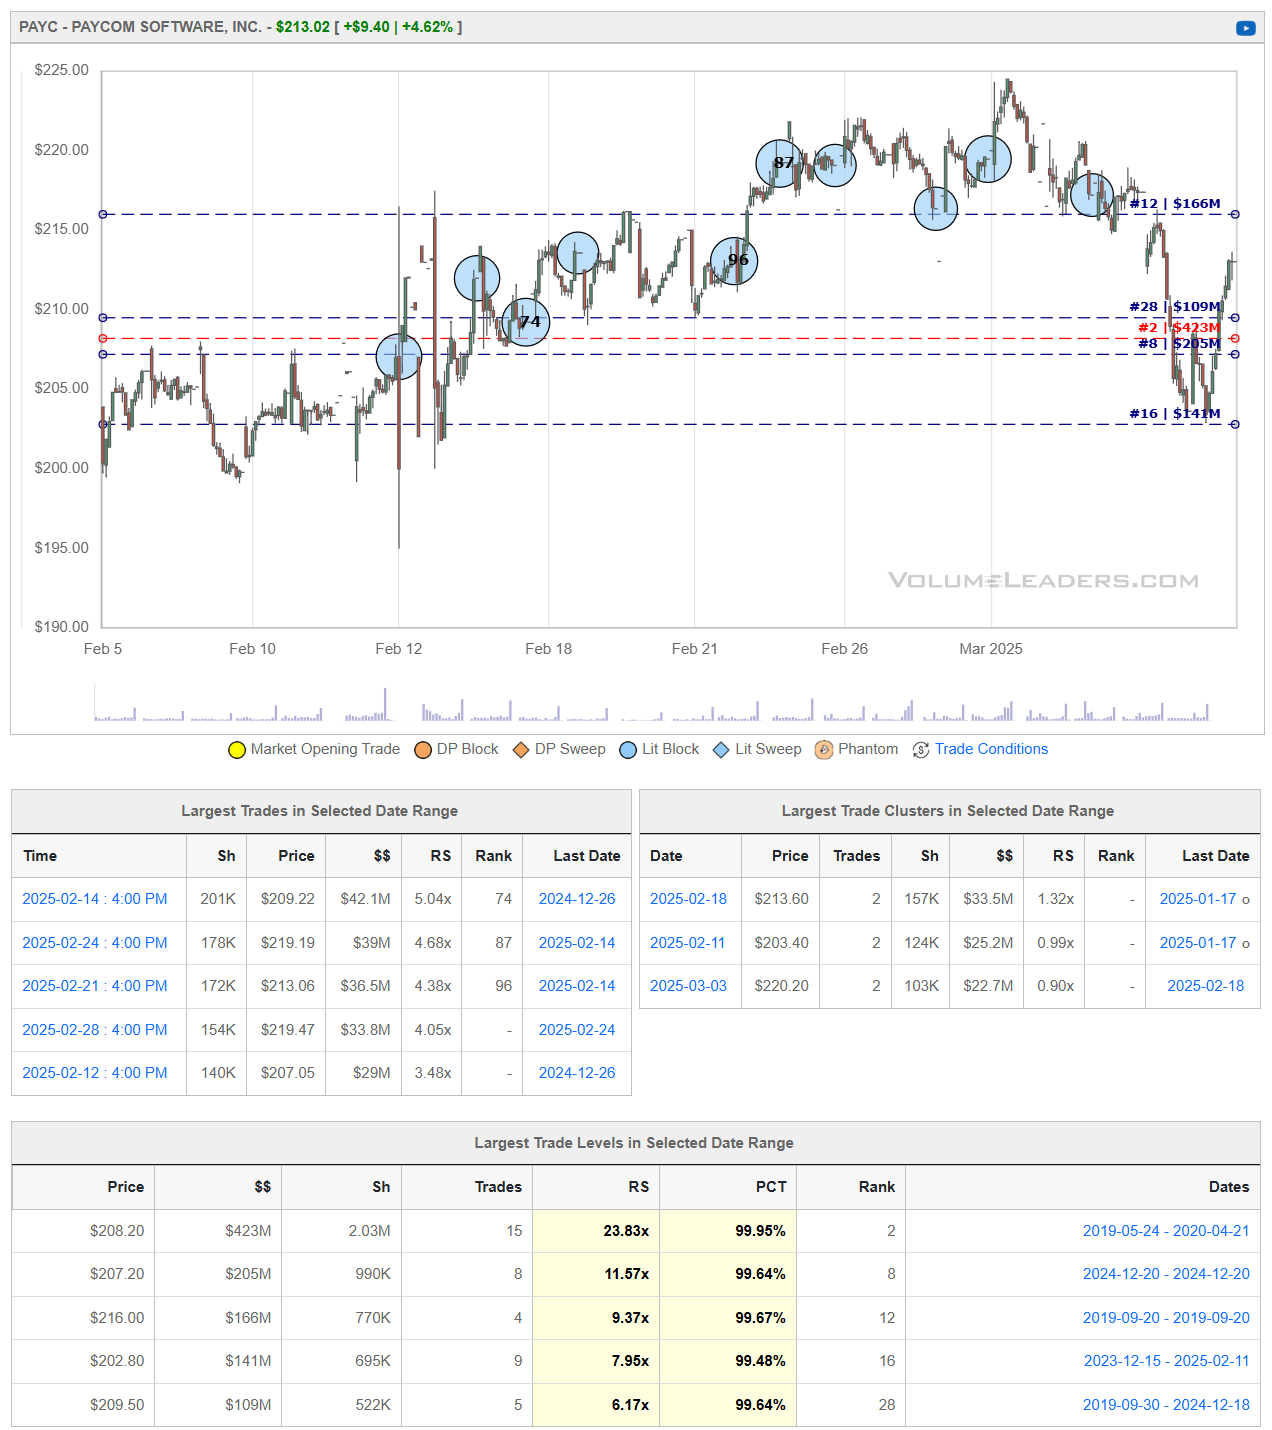
Paycom Software, Inc. (NYSE: PAYC) is a leading provider of cloud-based human capital management (HCM) software solutions, offering a comprehensive suite of services that streamline payroll and HR processes for businesses across various industries.
Recent Developments:
Financial Performance: In the fourth quarter of 2024, Paycom reported revenue growth of 11.2% year-over-year, reaching $1.883 billion. The company also achieved a 47% increase in GAAP net income, totaling $502 million.
Product Innovation: Paycom introduced "GONE," an enhancement to its existing Time-Off Request software, automating time-off management. This feature has been recognized for its potential to significantly impact process automation and financial outcomes.
Market Recognition: The company has been acknowledged as one of the World's Most Innovative Enterprise Companies by Fast Company in 2022, reflecting its commitment to innovation in the HCM space.
Bullish Perspective:
Strong Financial Growth: Paycom's consistent revenue and net income growth demonstrate its robust business model and effective operational strategies. The company's ability to maintain a high client retention rate further underscores its market strength.
Innovative Product Offerings: The introduction of features like "GONE" showcases Paycom's commitment to enhancing user experience and operational efficiency, potentially attracting a broader client base.
Industry Recognition: Accolades from reputable organizations highlight Paycom's leadership and innovation in the HCM industry, enhancing its brand reputation and competitive positioning.
Bearish Perspective:
Market Volatility: Paycom's stock has experienced fluctuations, with a recent 6.3% decline, reflecting broader market challenges and potential investor concerns.
Data Security Concerns: The company faced a data breach between July and October 2023, leading to a $900,000 settlement. Such incidents can impact customer trust and result in increased regulatory scrutiny.
Competitive Landscape: The HCM software market is highly competitive, with numerous players offering similar solutions. Paycom must continuously innovate to maintain its market share and address evolving customer needs.
In summary, Paycom Software, Inc. exhibits strong financial performance and a commitment to innovation, positioning itself well in the HCM industry. However, challenges such as market volatility, data security issues, and intense competition require ongoing strategic attention to sustain its growth trajectory.
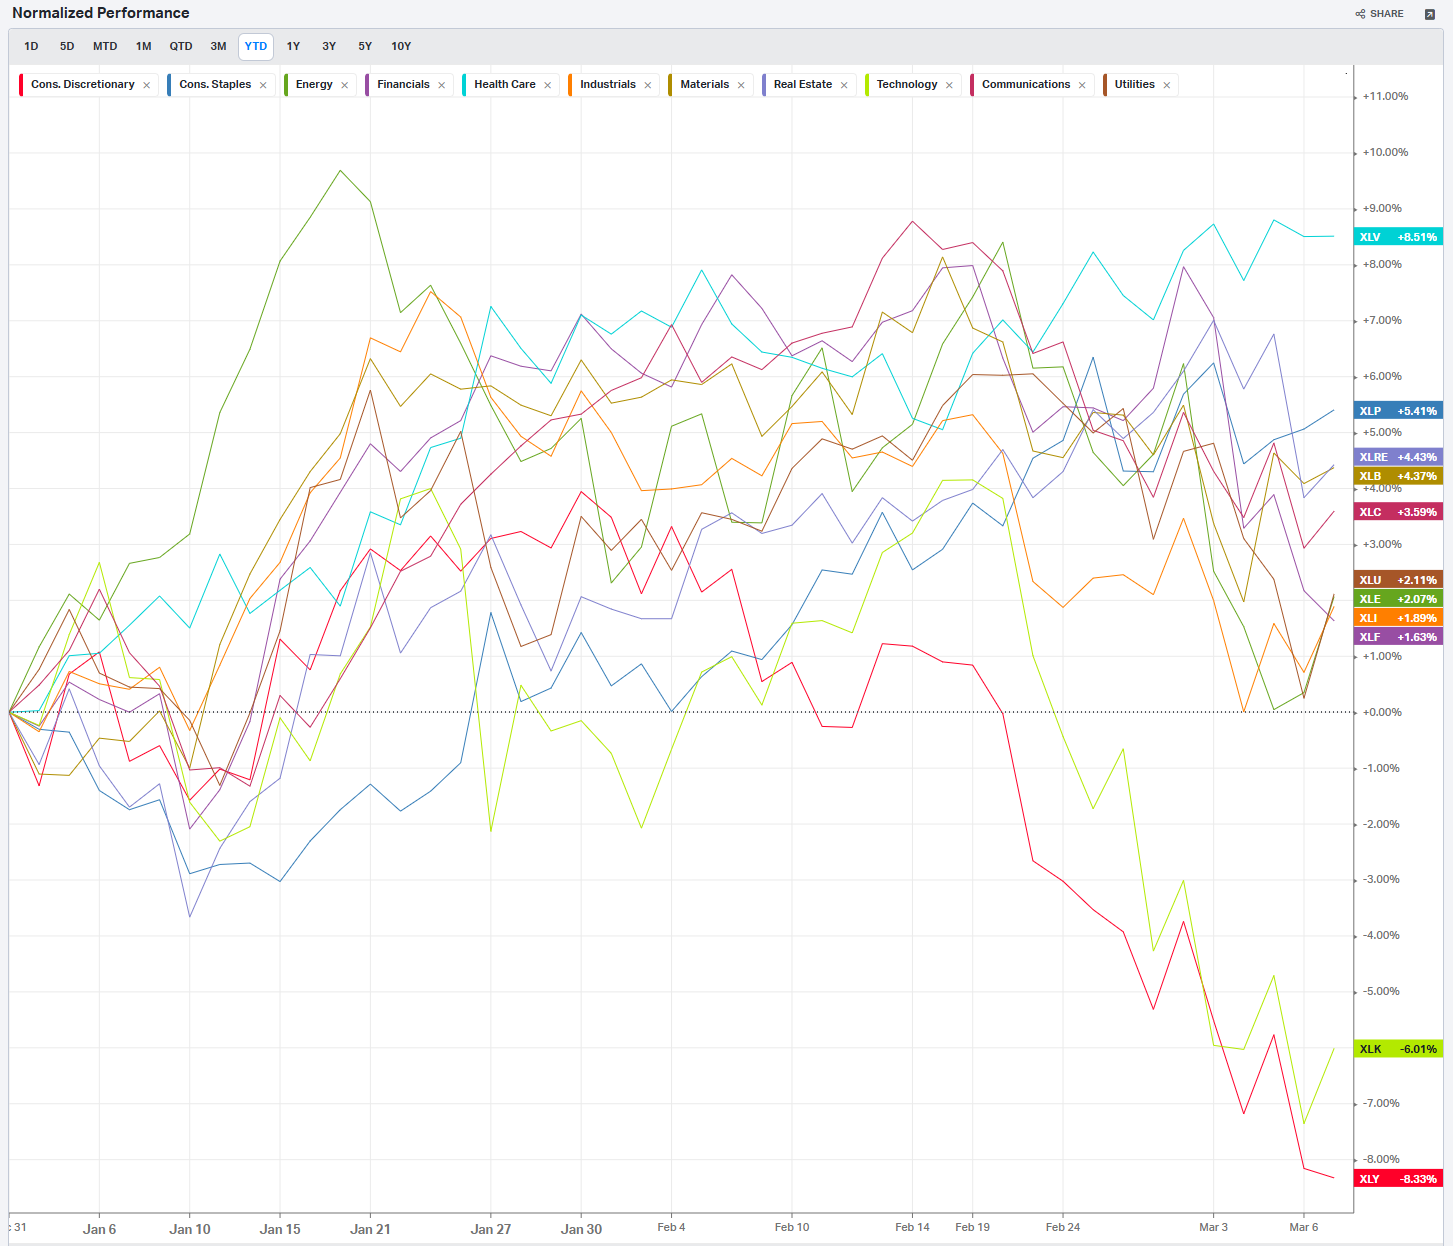
Summary Of Thematic Performance YTD
VolumeLeaders.com provides a lot of pre-built filters for thematics so that you can quickly dive into specific areas of the market. These performance overviews are provided here only for inspiration. Consider targeting leaders and/or laggards in the best and worst sectors, for example.
S&P By Sector
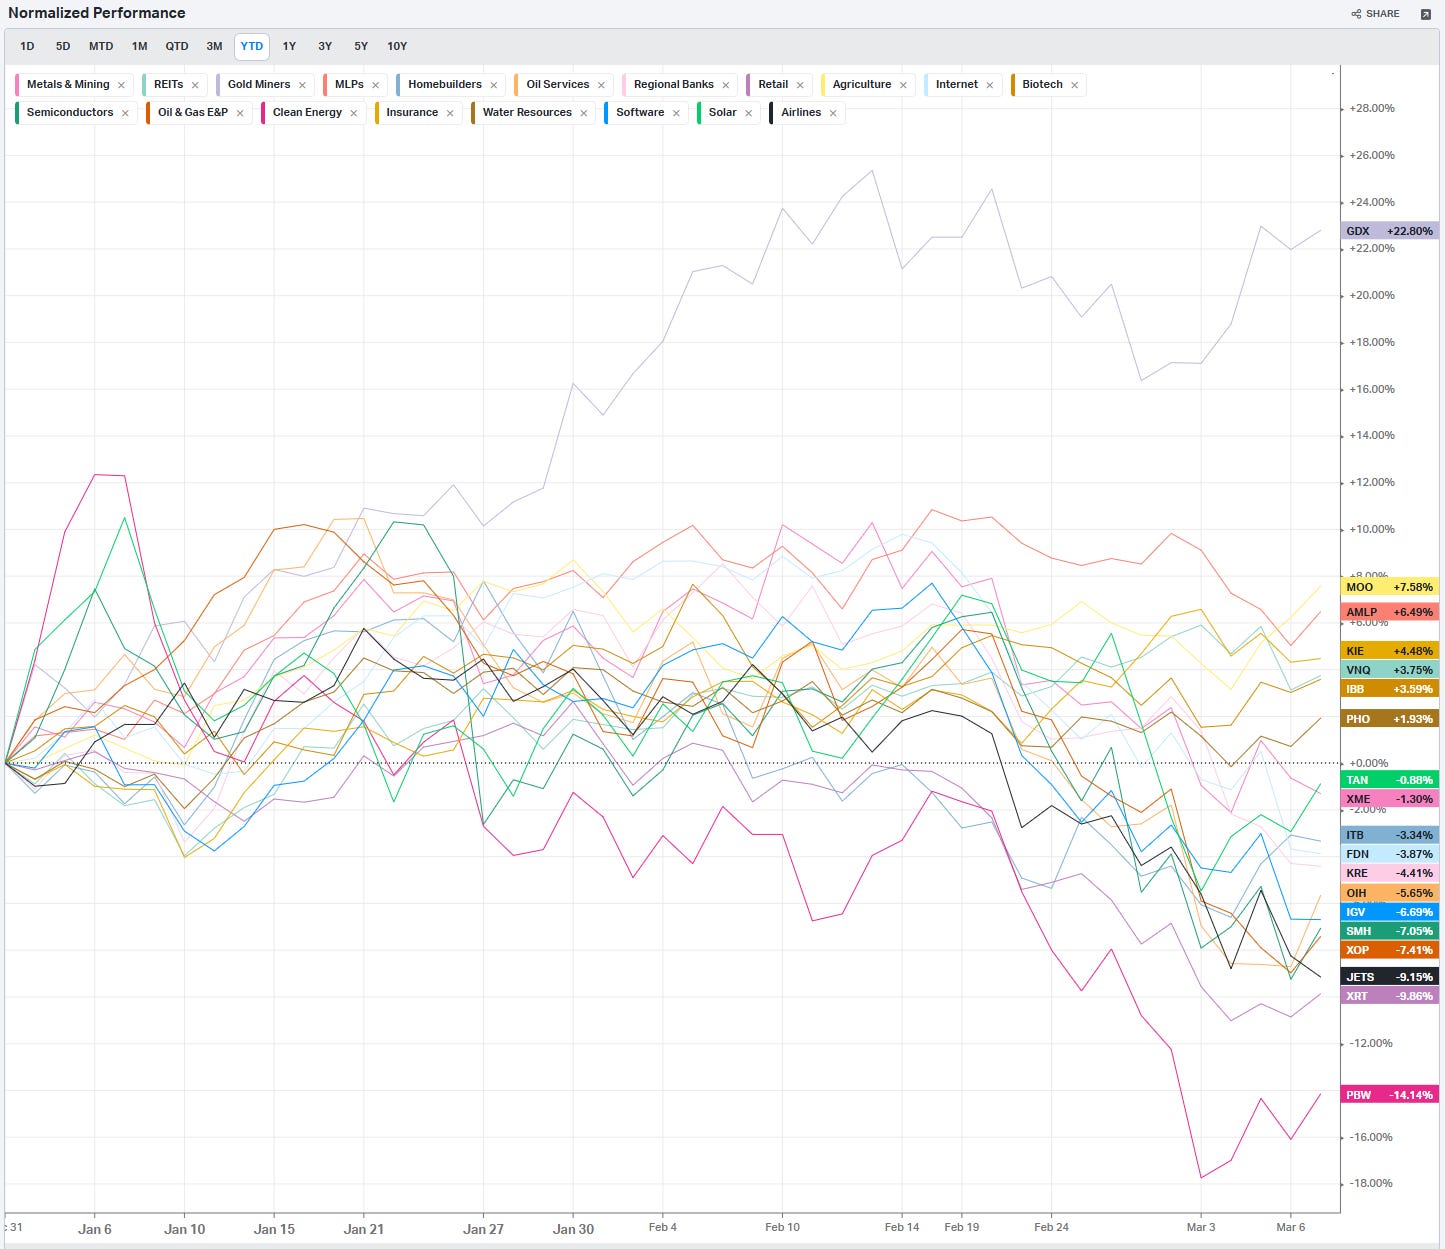
S&P By Industry
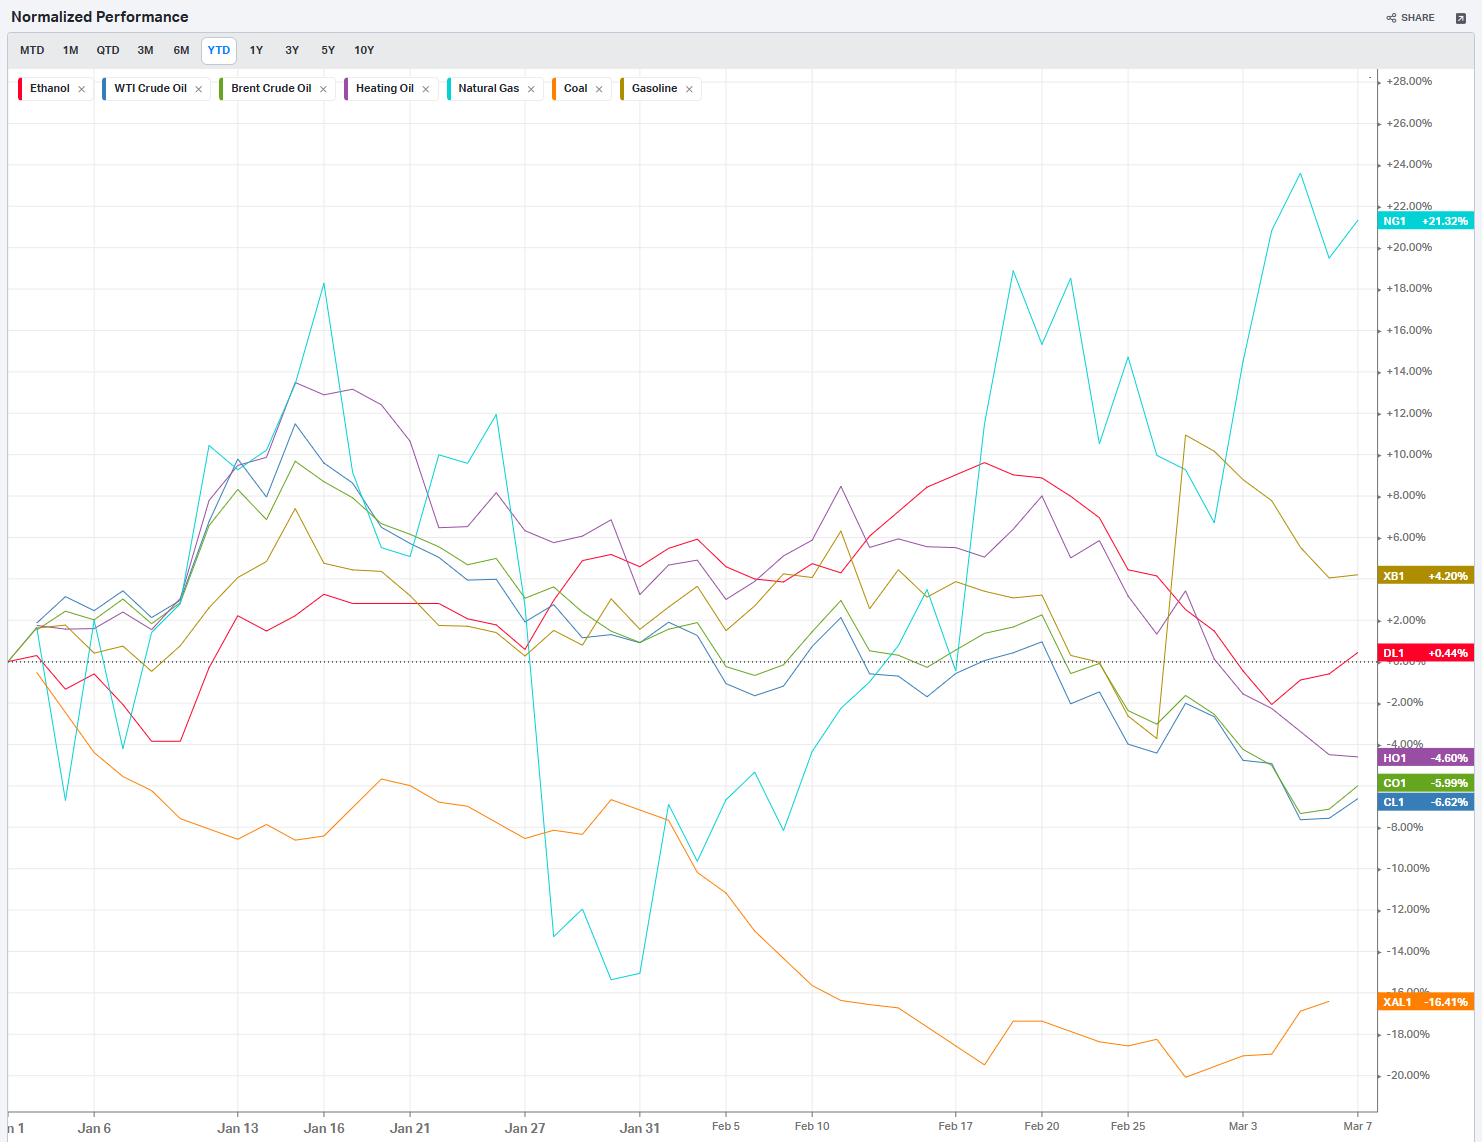
Commodities: Energy
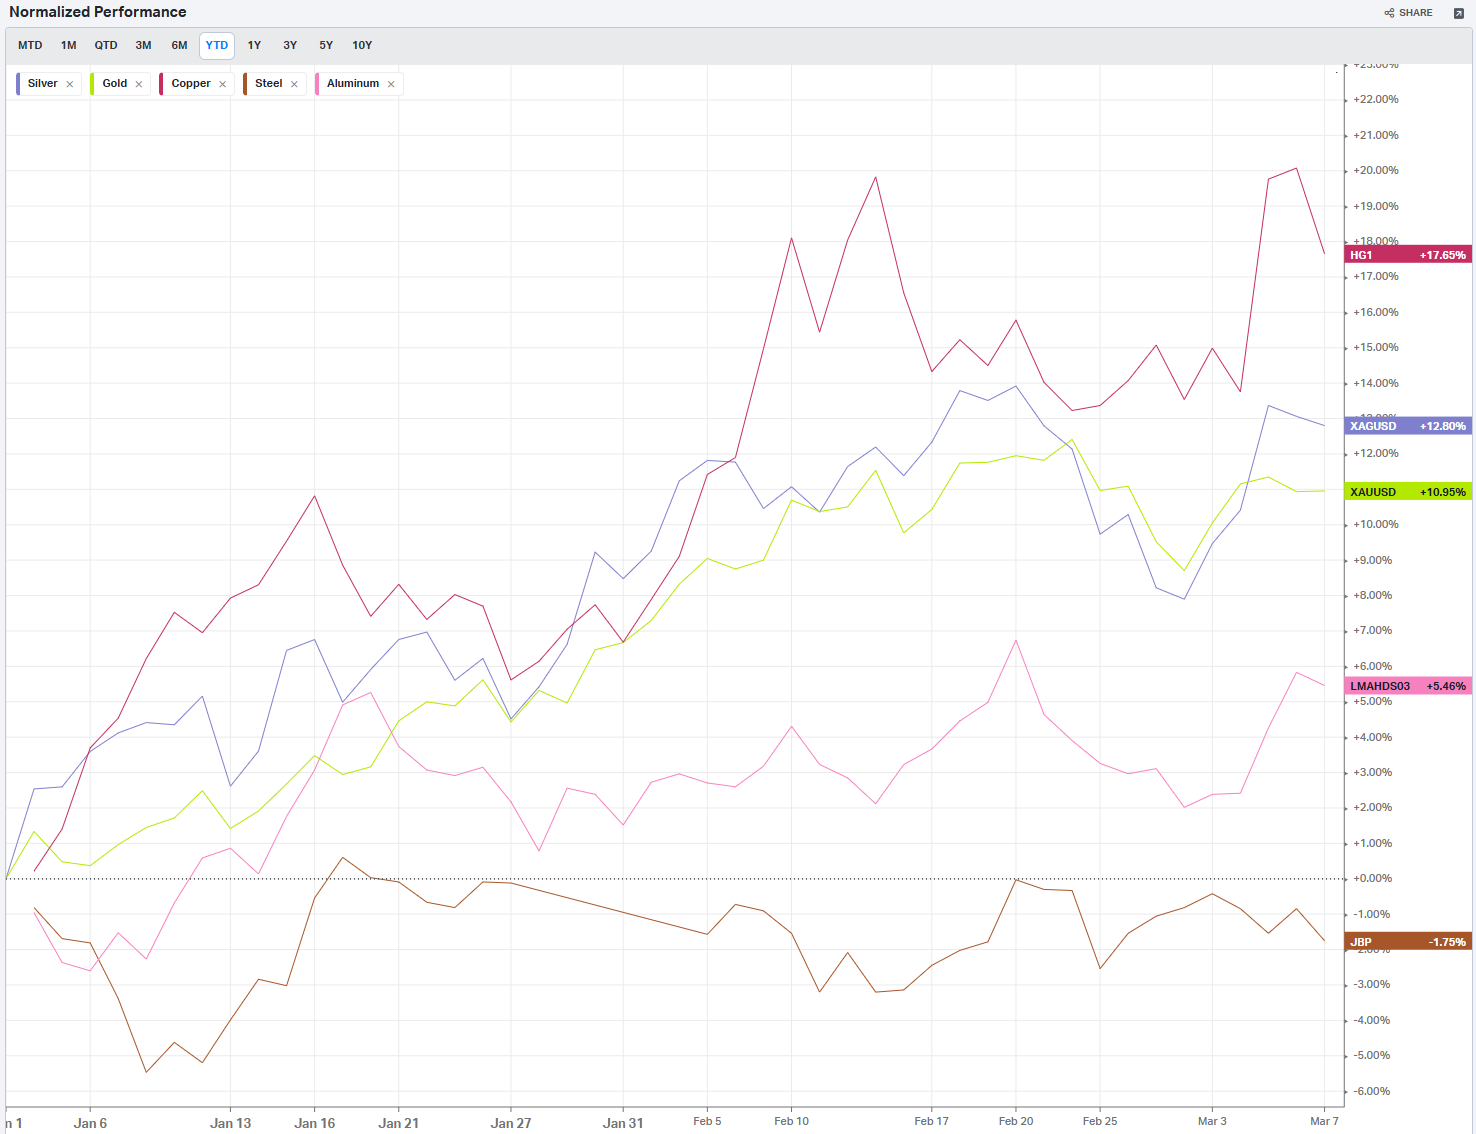
Commodities: Metals
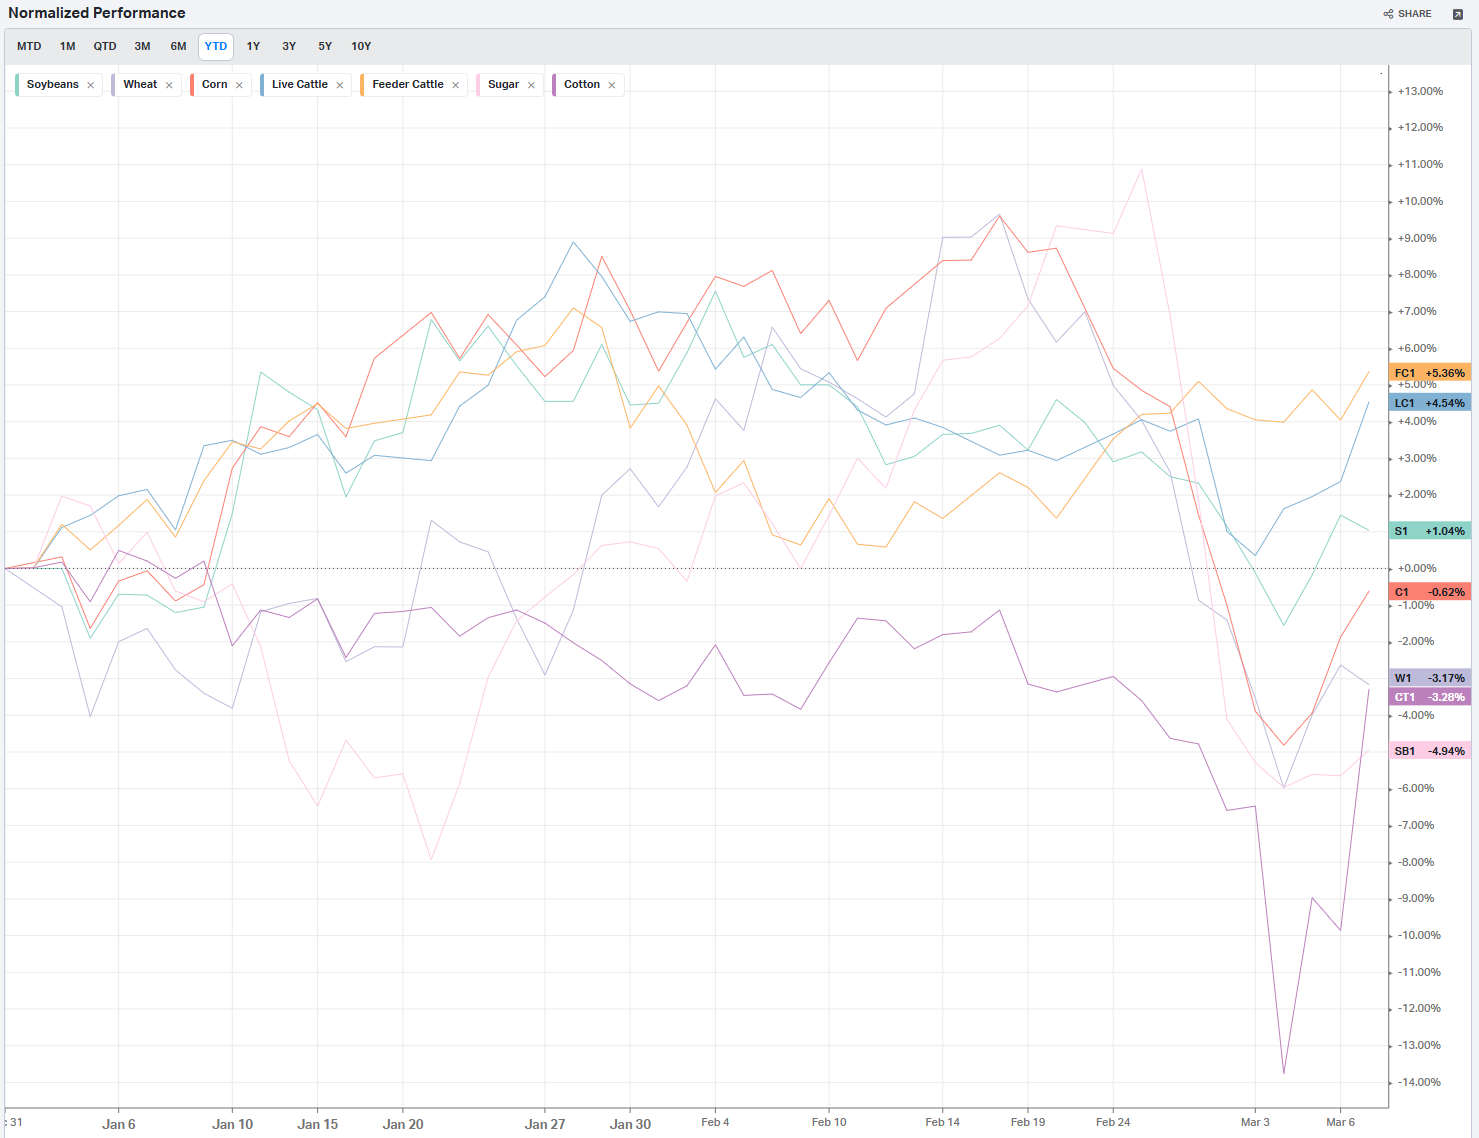
Commodities: Agriculture
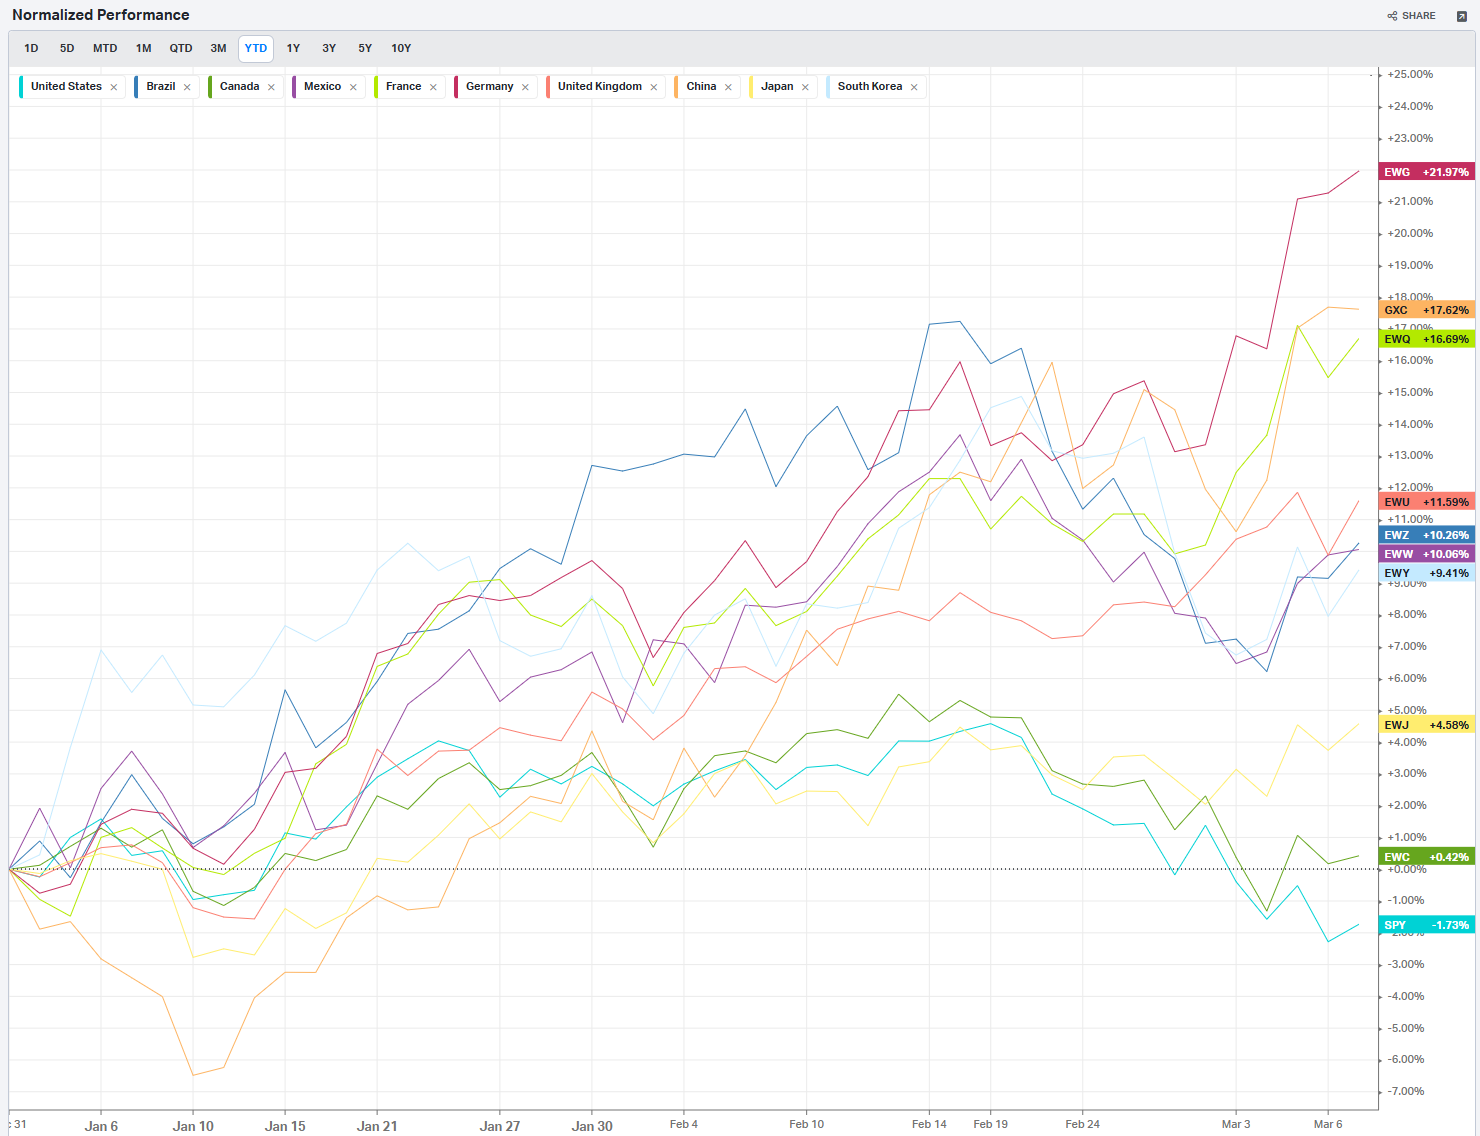
Country ETFs
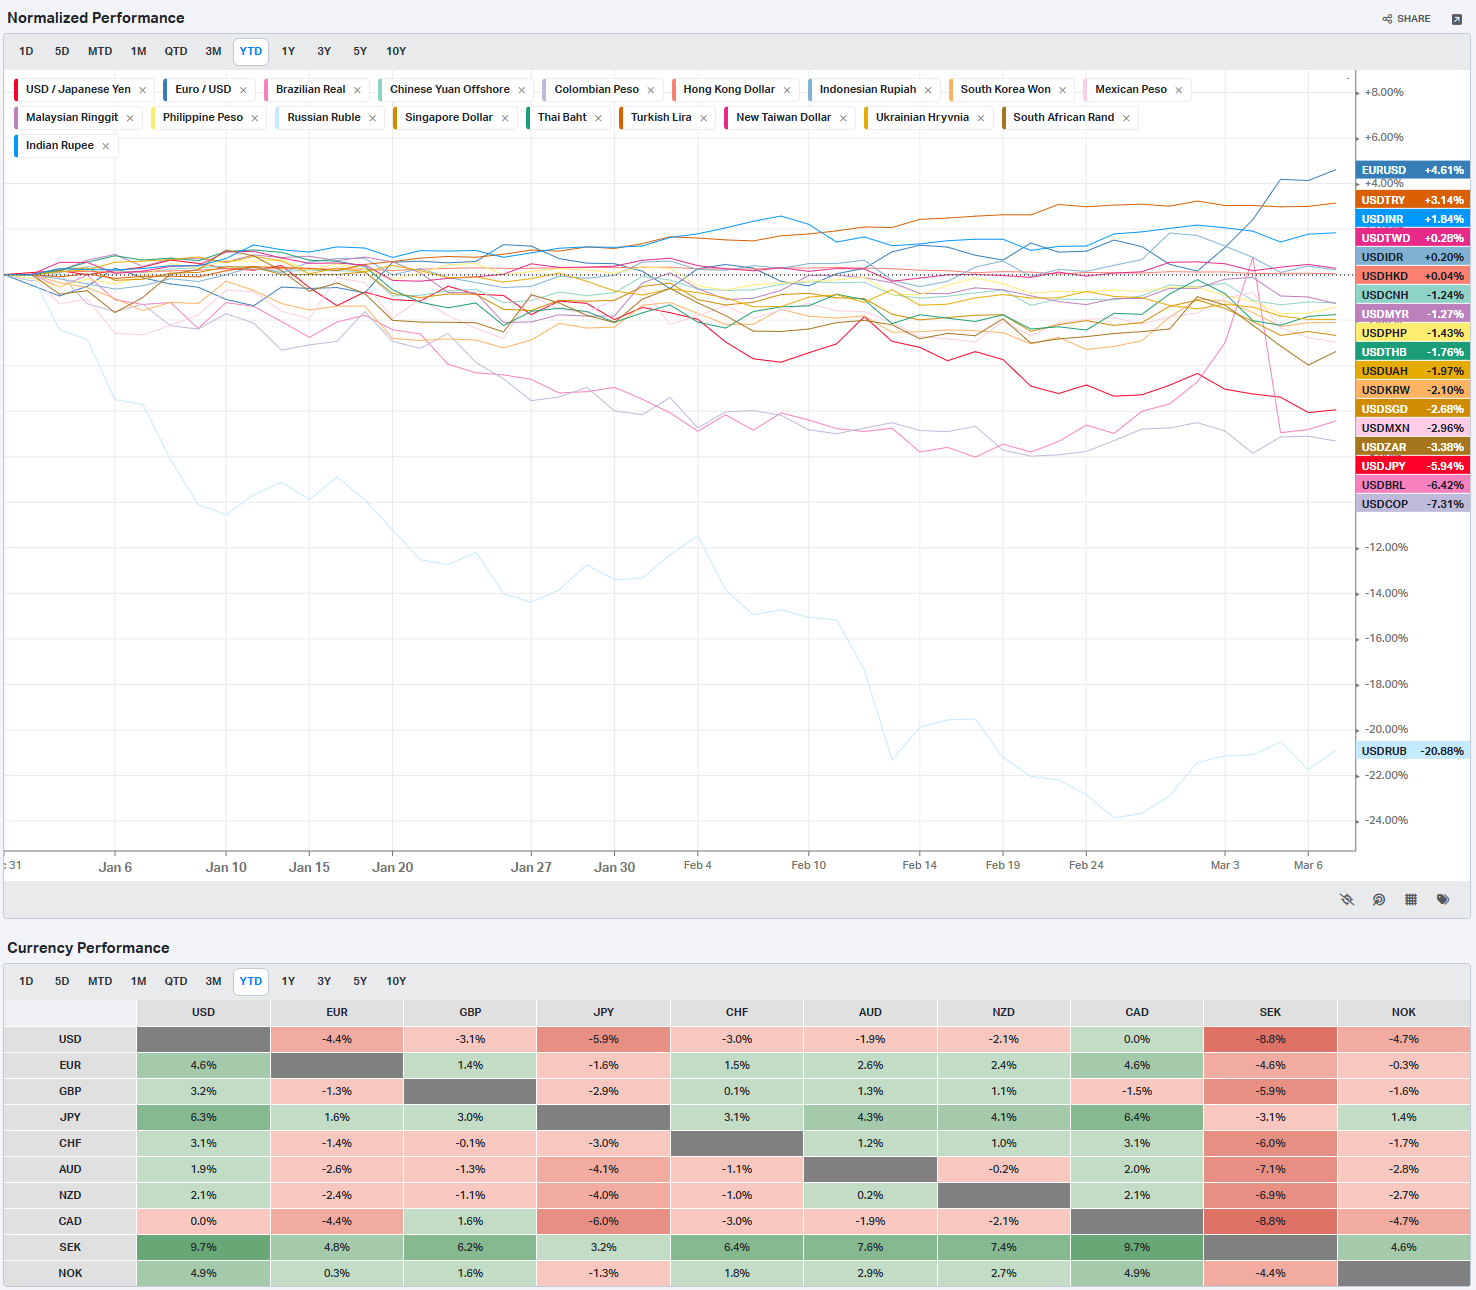
Currencies
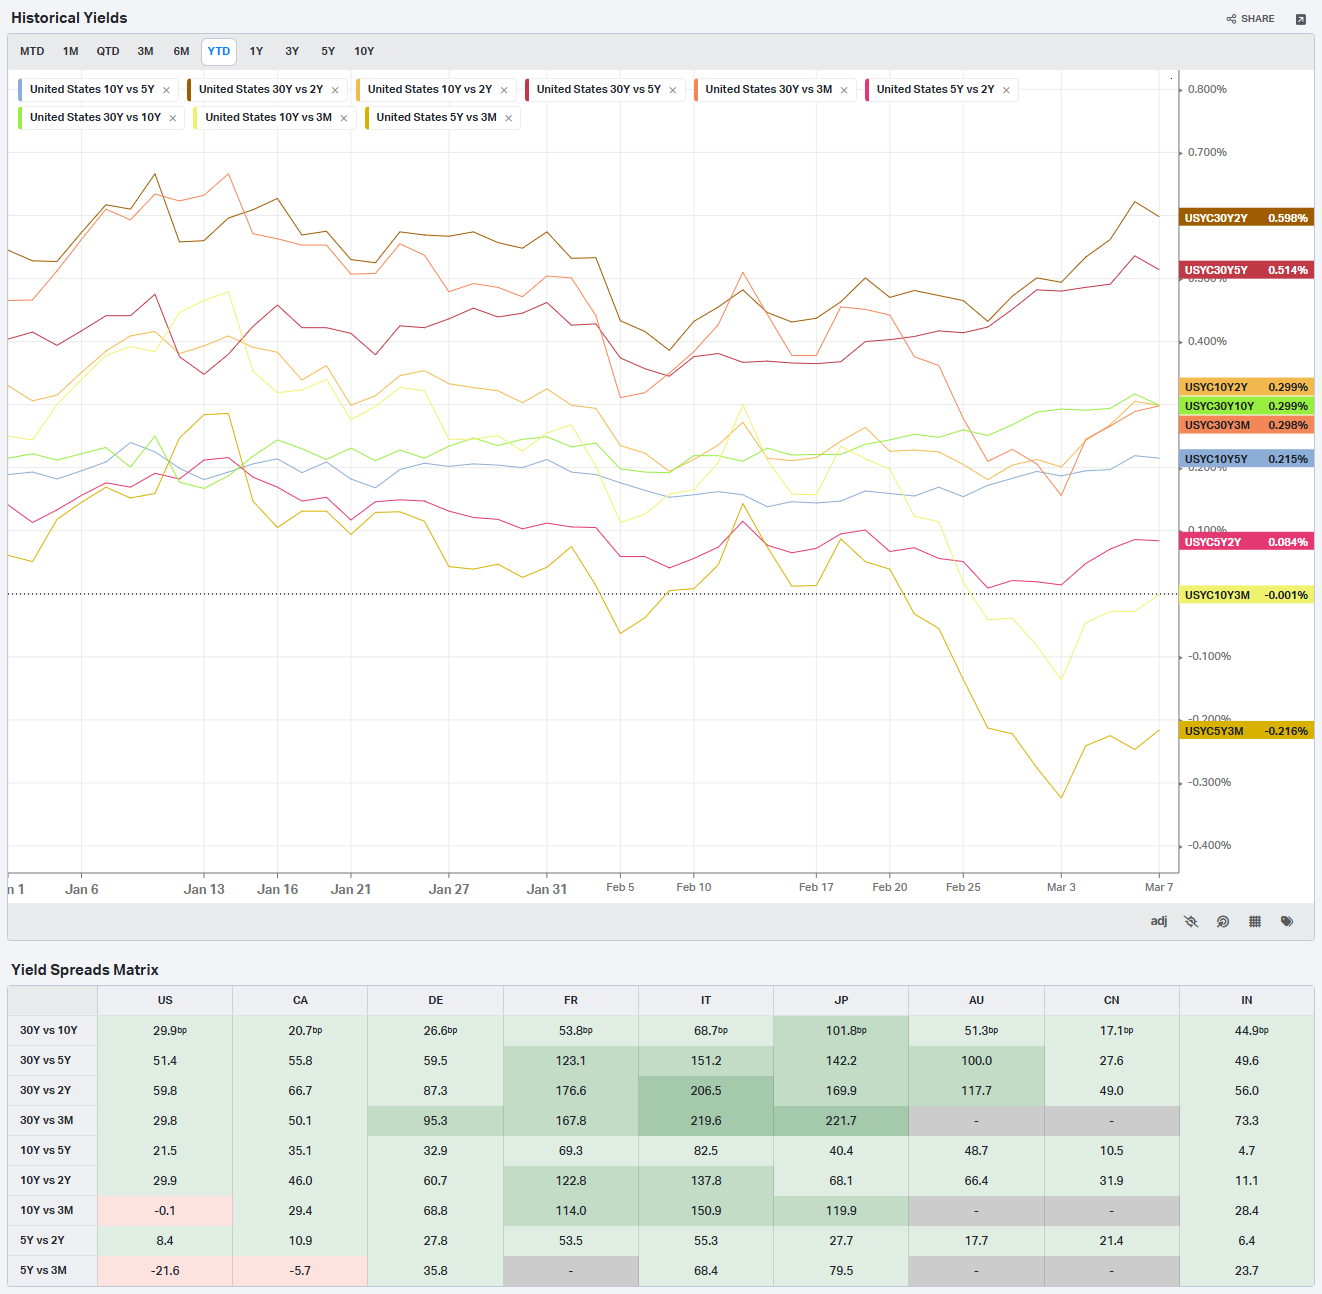
Global Yields
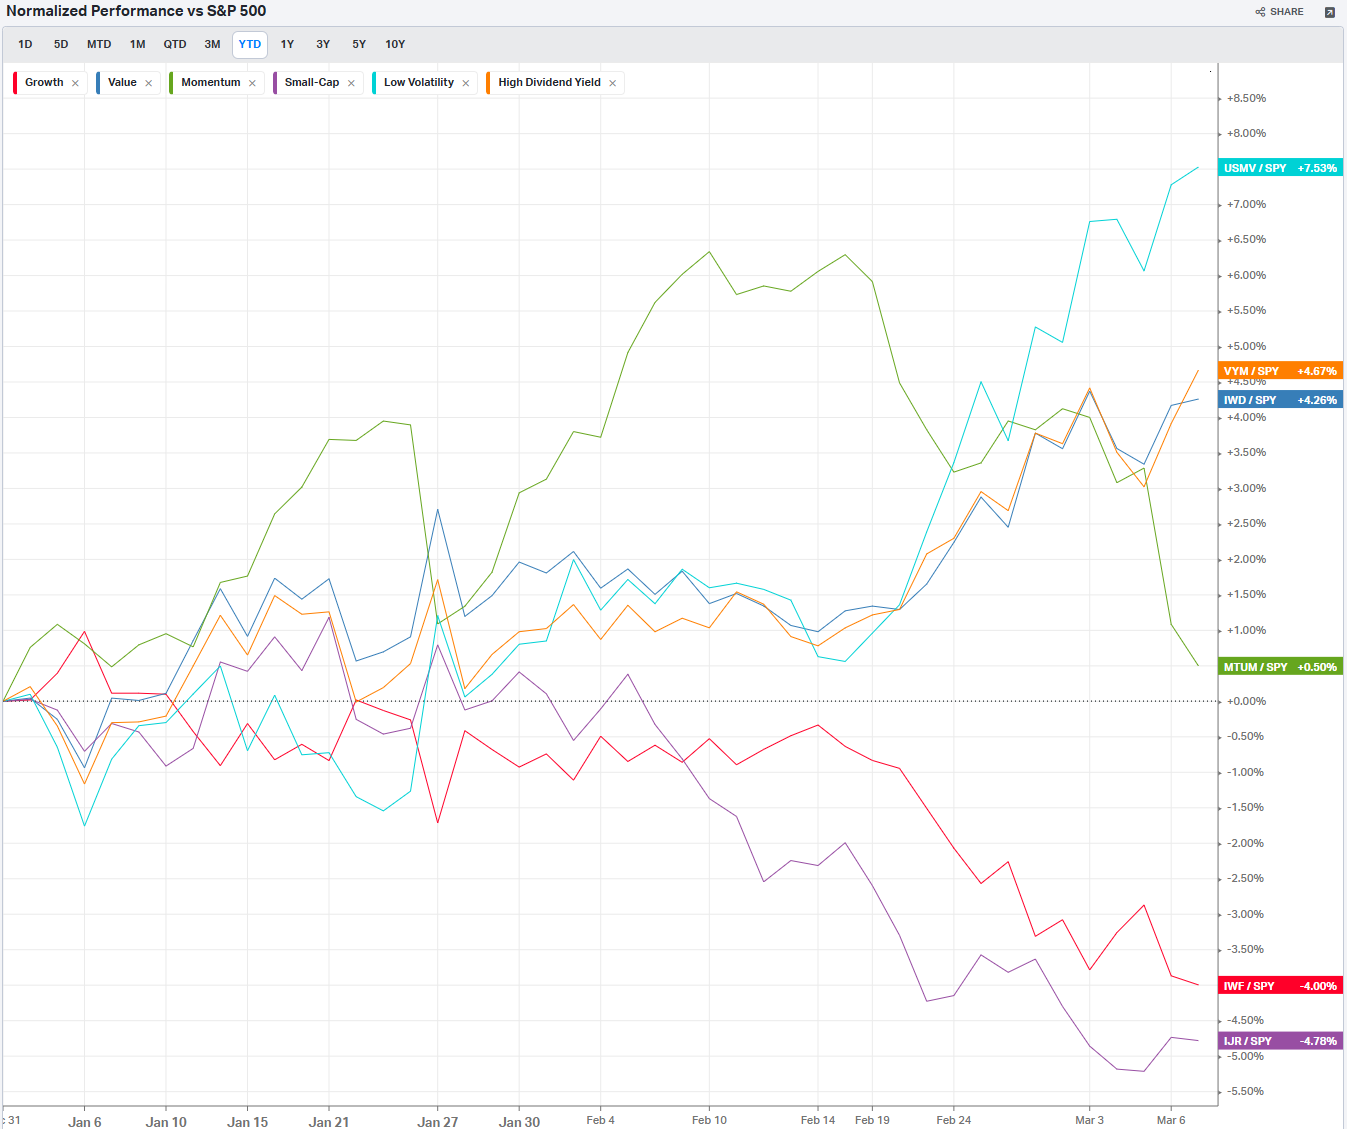
Factors: Style
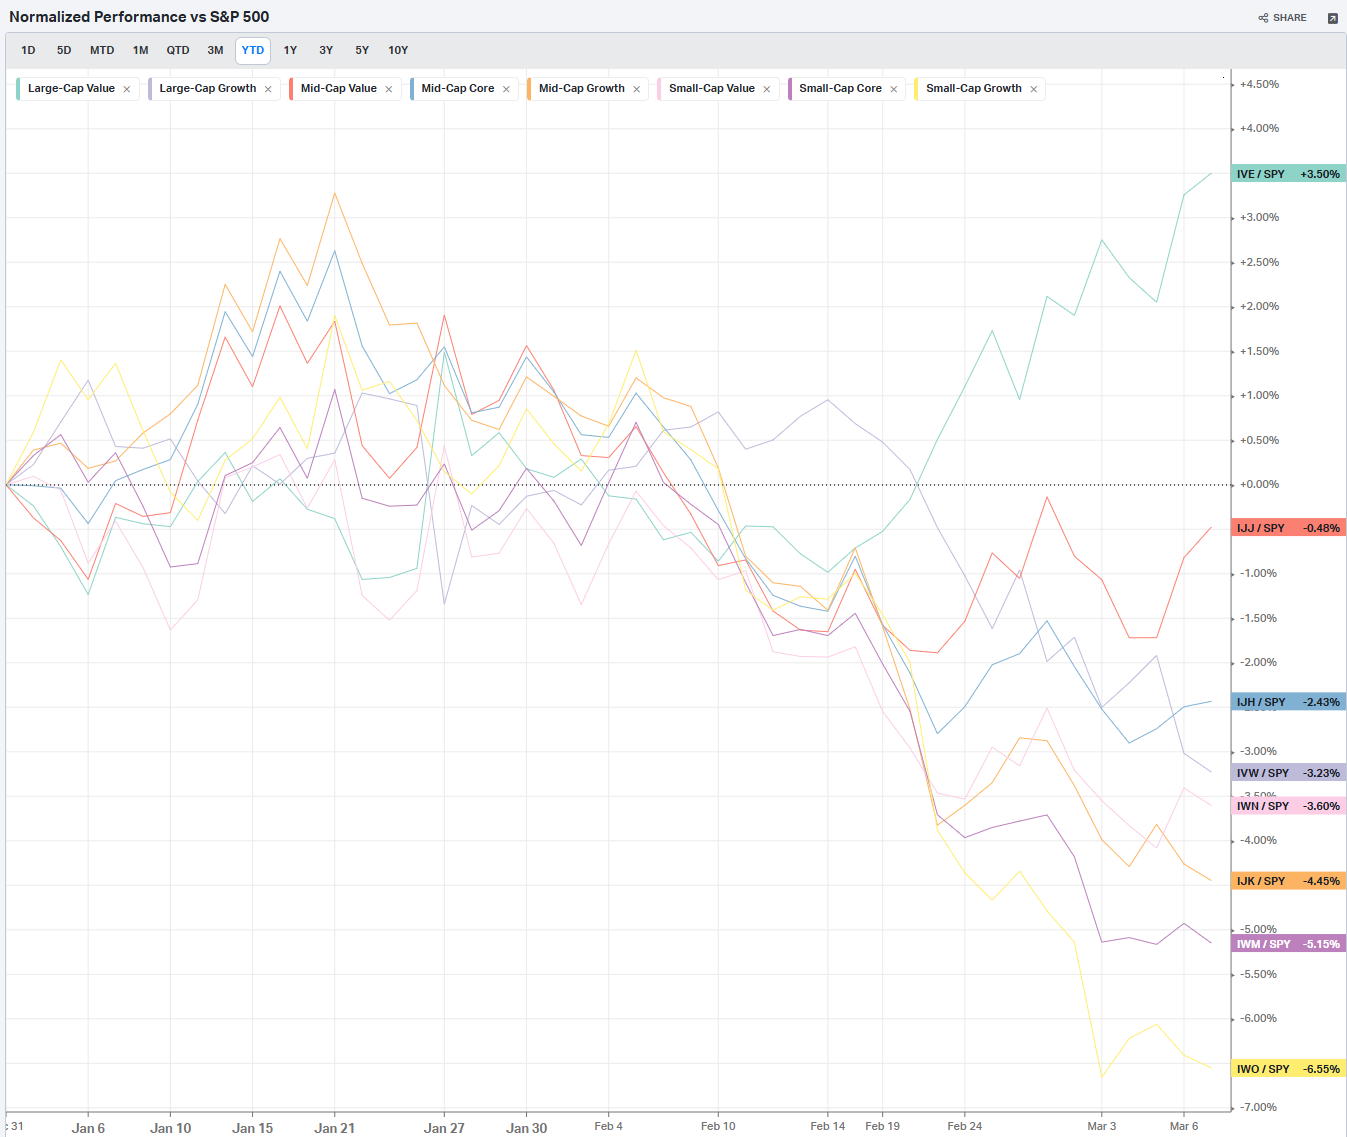
Factors: Size vs Value
Factors: Qualitative
Social Media Favs
Analyzing social sentiment can provide valuable insights for investment strategies by offering a pulse on public perception, mood, and market sentiment that traditional financial indicators might not capture. Here’s how social sentiment analysis can enhance investment decisions:
Market Momentum: Positive or negative social sentiment can signal impending momentum shifts. When public opinion on a stock, sector, or asset class changes sharply, it can create buying or selling pressure, especially if that sentiment becomes widespread.
Early Detection of Trends: Social sentiment data can help investors spot trends before they show up in technical or fundamental data. For example, increased positive chatter around a particular company or sector might indicate growing interest or excitement, which could lead to price appreciation.
Gauge Retail Investor Impact: With the rise of retail investor platforms, collective sentiment on social media can lead to significant price movements (e.g., meme stocks). Understanding how retail investors view certain stocks can help in identifying high-volatility opportunities.
Event Reaction Monitoring: Social sentiment can provide real-time reactions to news events, product releases, or earnings reports. Investors can use this information to gauge market reaction quickly and adjust their strategies accordingly.
Complementing Quantitative Models: By adding a social sentiment layer to quantitative models, investors can enhance predictions. For example, a model that tracks historical price and volume data might perform even better when factoring in sentiment trends as a measure of market psychology.
Risk Management: Negative sentiment spikes can be a signal of potential downturns or increased volatility. By monitoring sentiment, investors might avoid or hedge against investments in companies experiencing a public relations crisis or facing negative perceptions.
Long-Term Sentiment Trends: Sustained sentiment trends, whether positive or negative, often mirror longer-term market cycles. Tracking sentiment trends over time can help identify shifts in investor psychology that could affect longer-term investments or sector rotations.
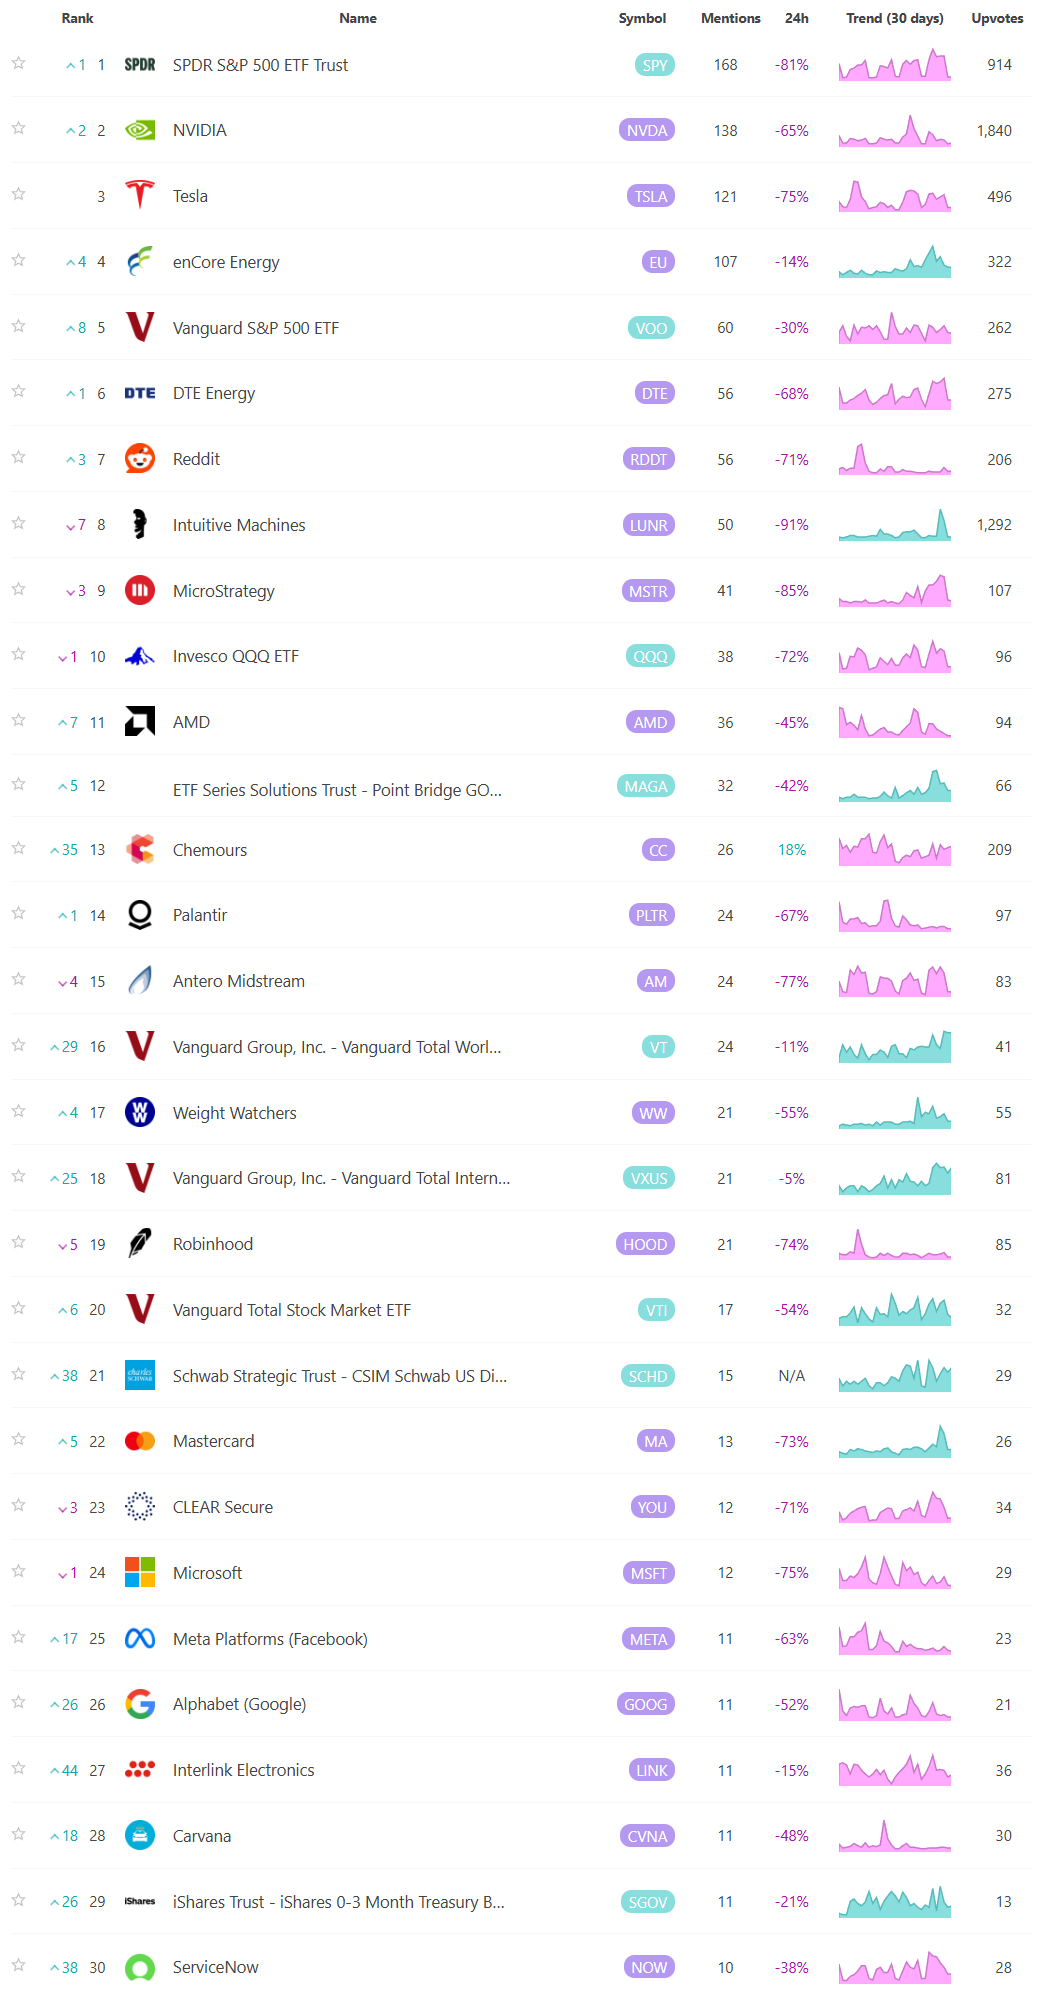
For these reasons, sentiment analysis, when combined with other tools, can provide a comprehensive view of both immediate market reactions and underlying investor attitudes, helping investors position themselves strategically across various time frames. Here are the most mentioned/discussed tickers on Reddit from some of the most active Subreddits for trading:
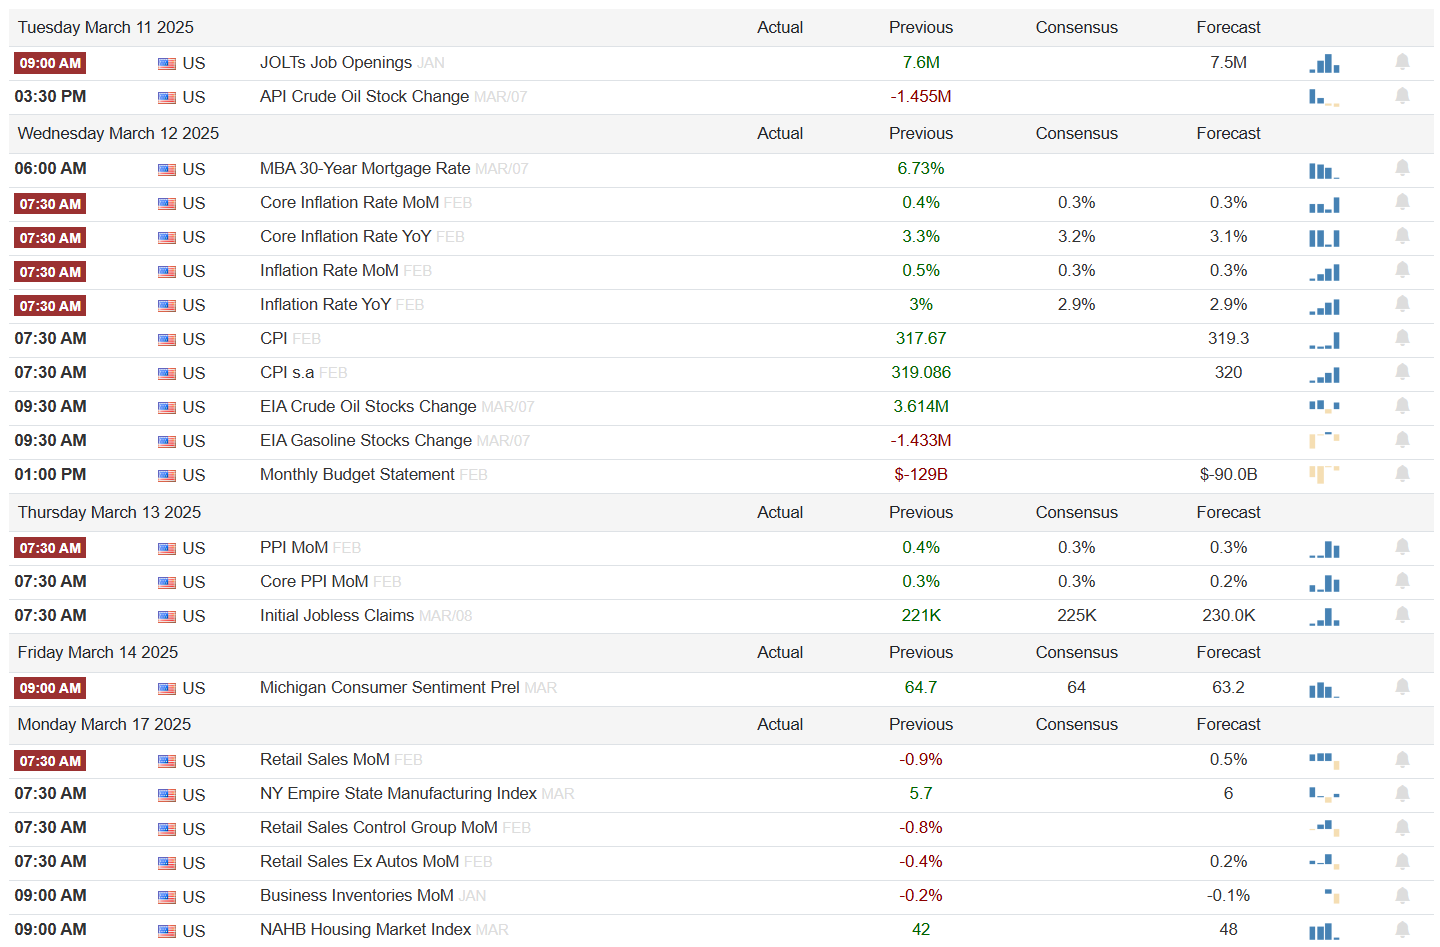
Events On Deck This Week
Here are key events happening this week that have the potential to cause outsized moves in the market or heightened short-term volatility.
Econ Events By Day of Week
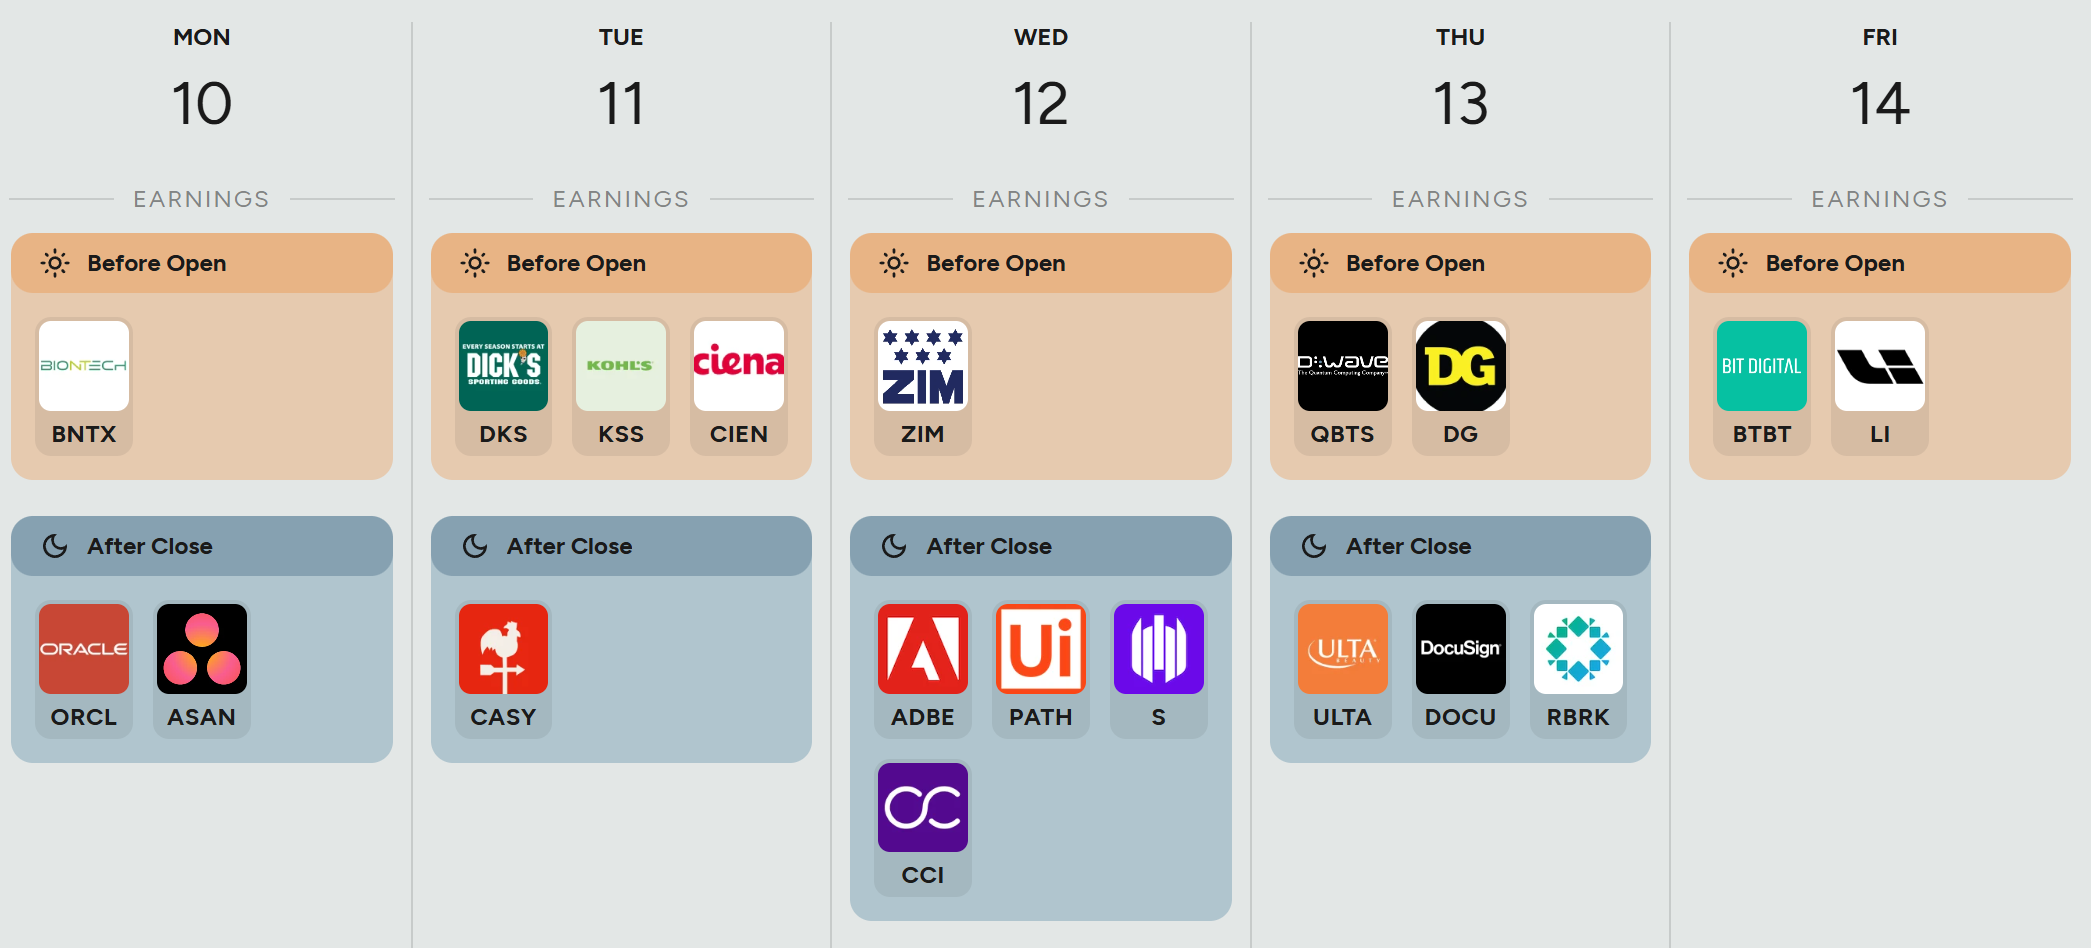
Anticipated Earnings By Day of Week
Thank you for being part of our community and for taking the time to read this publication. Your engagement and insights mean a great deal to all of us, and we're genuinely grateful to share this space with such dedicated and thoughtful readers. Wishing you a productive and successful week ahead in the markets. May the coming days bring clarity and great opportunities. Happy trading!