Market Momentum: Your Weekly Financial Forecast & Market Prep
Issue 38 / What to expect March 24, 2025 thru March 28, 2025
In This Issue
Market-On-Close: All of last week’s market-moving news and macro context in under 5 minutes + futures-at-a-glance
The Latest Investor Sentiment Readings
Institutional Support & Resistance Levels For Major Indices: Exactly where to look for support and resistance this week in SPY, QQQ, IWM & DIA
Institutional Activity By Sector: Institutional order flow by sector including the top institutionally-backed names in those sectors. We break it all down and provide the key insights and take-aways you need to navigate institutional positioning this week.
Top Institutional Order Flow In Individual Names: All of the largest sweeps and blocks on lit exchanges and hidden dark pools
Investments In Focus: Bull vs Bear arguments for CDNS, RDFN, WOLF
Top Institutionally-Backed Gainers & Losers: An explosive watchlist for day traders seeking high-volatility
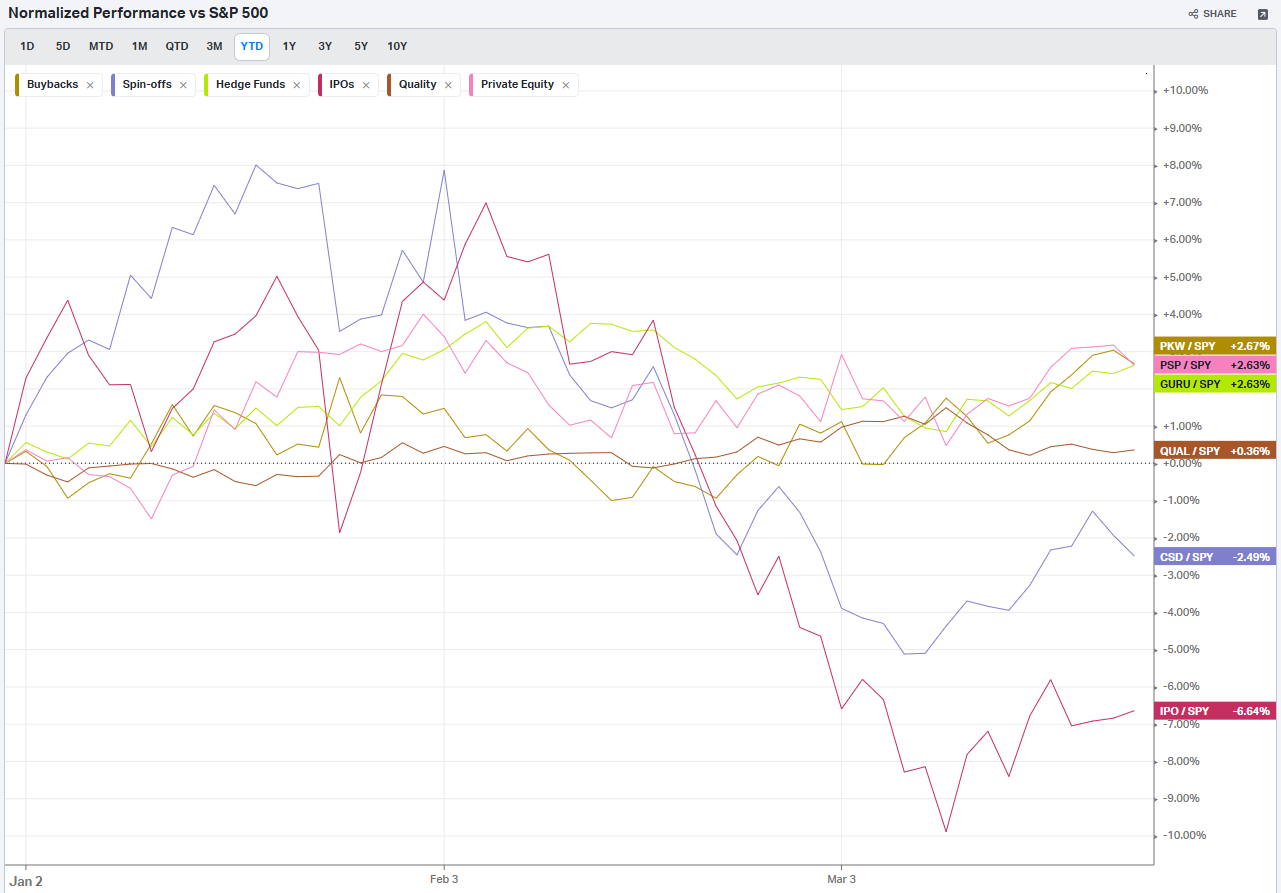
Normalized Performance By Thematics YTD (Sector, Industry, Factor, Energy, Metals, Currencies, and more): which corners of the markets are beating benchmarks, which ones are overlooked and which ones are over-crowded
Key Econ Events and Earnings On-Deck For This Week

Market-On-Close
Market Overview: Volatility Amid Policy Uncertainty
The US equity markets experienced a choppy trading week characterized by low volumes and diminished liquidity as investors navigated a complex landscape of central bank decisions, policy uncertainties, and mixed corporate signals. Despite closing the week with modest gains on Friday, the broader sentiment remained cautious as market participants braced for President Trump's April 2 deadline for the next phase of reciprocal tariff announcements.
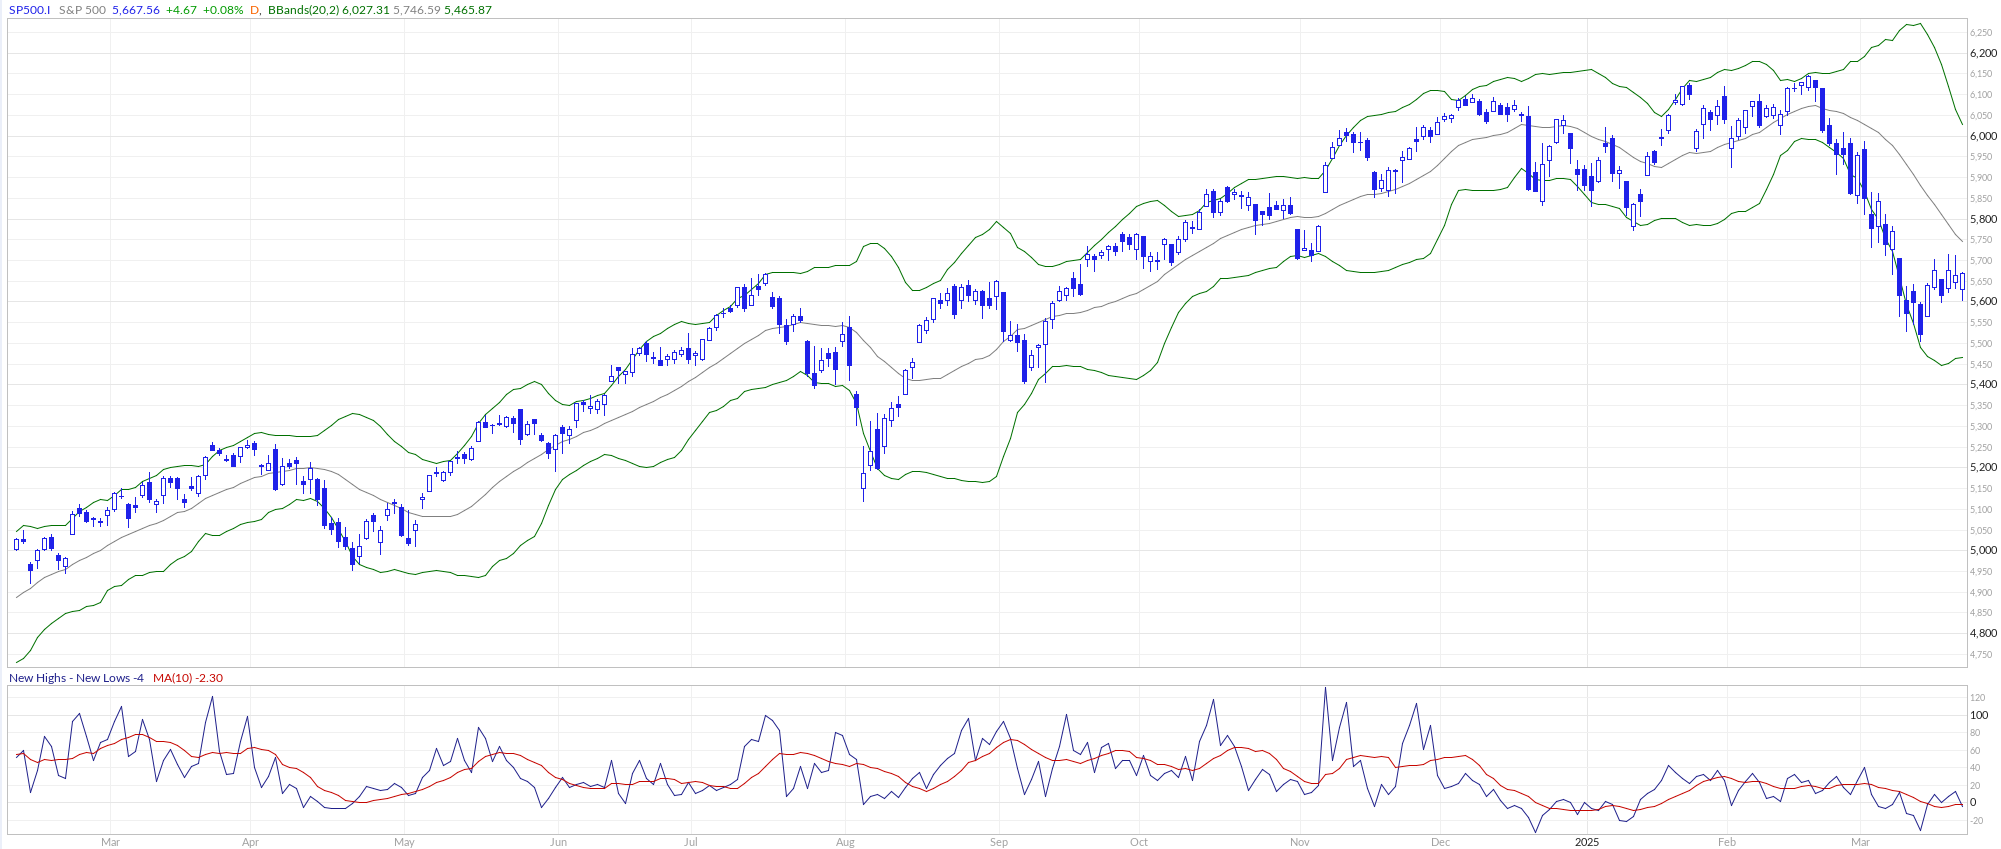
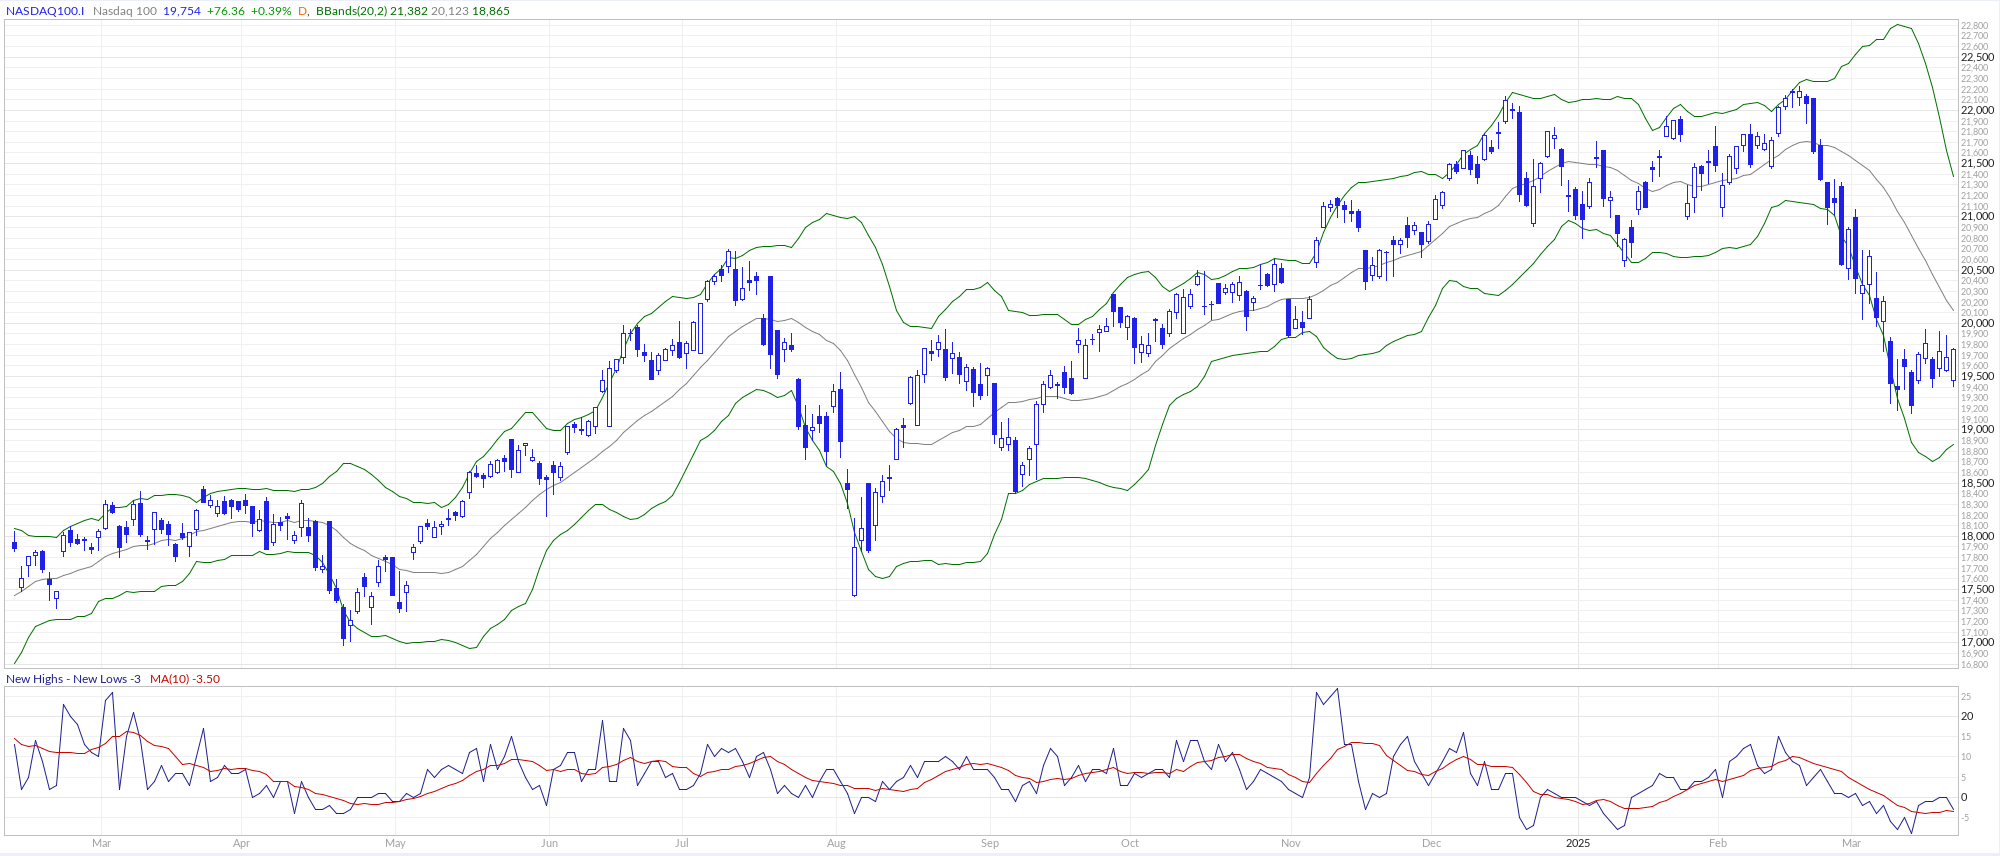
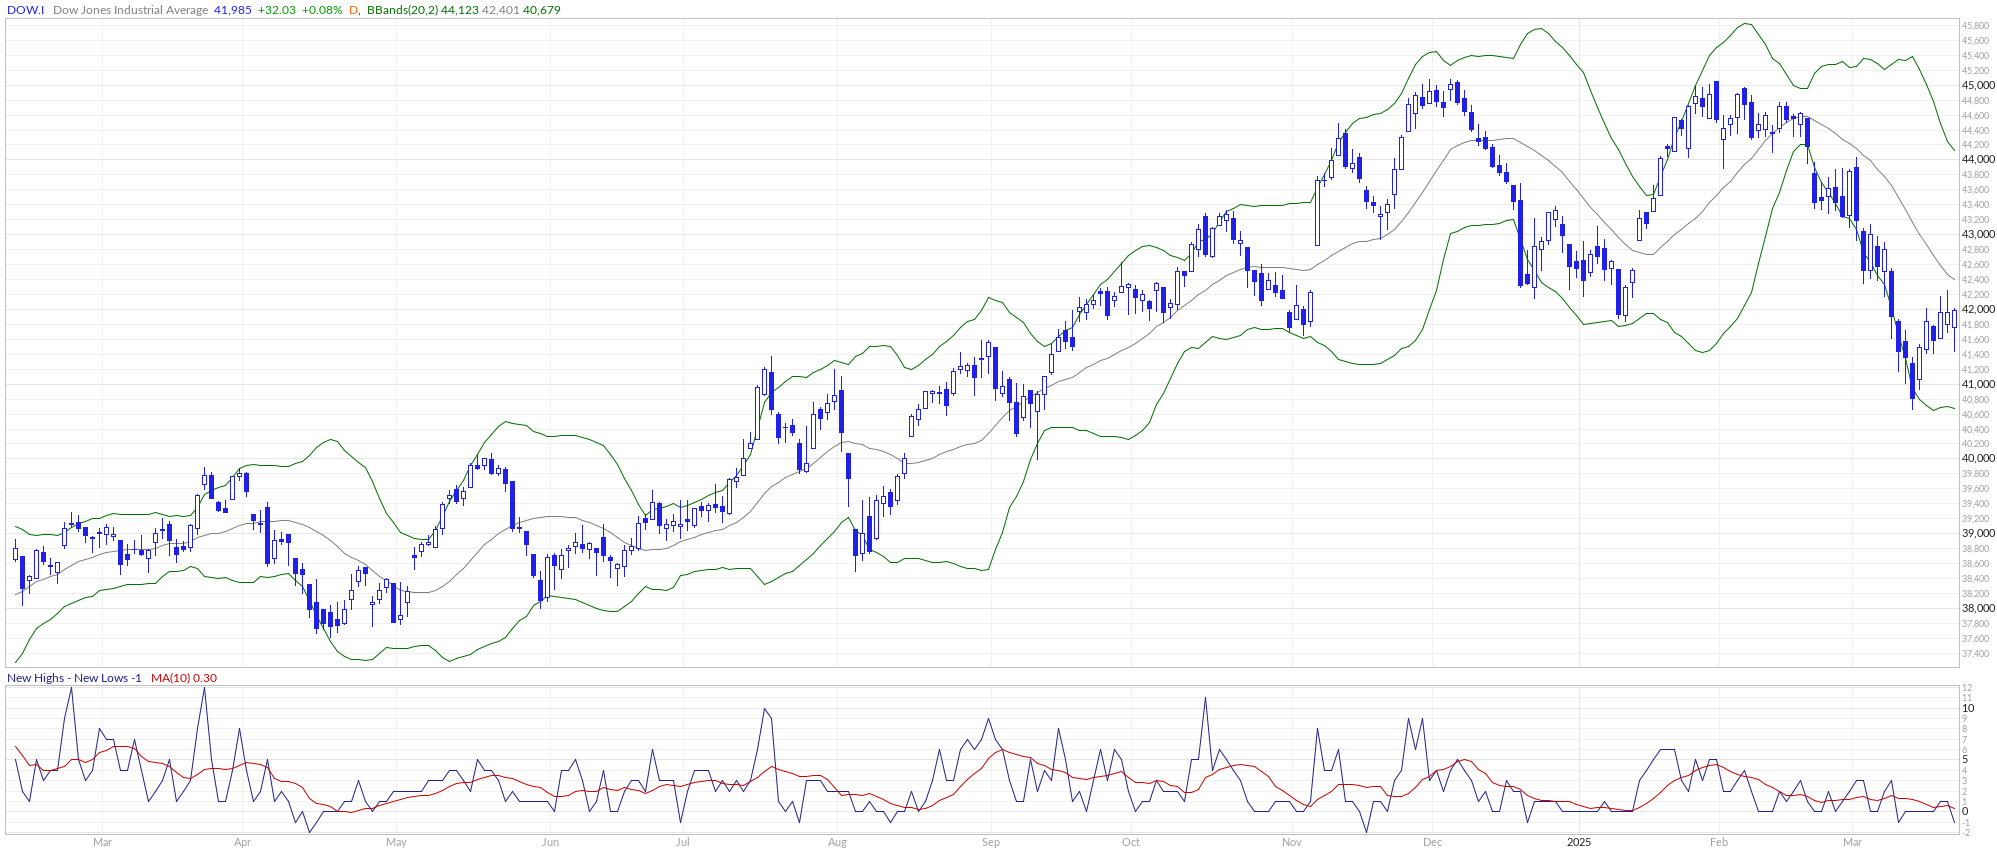
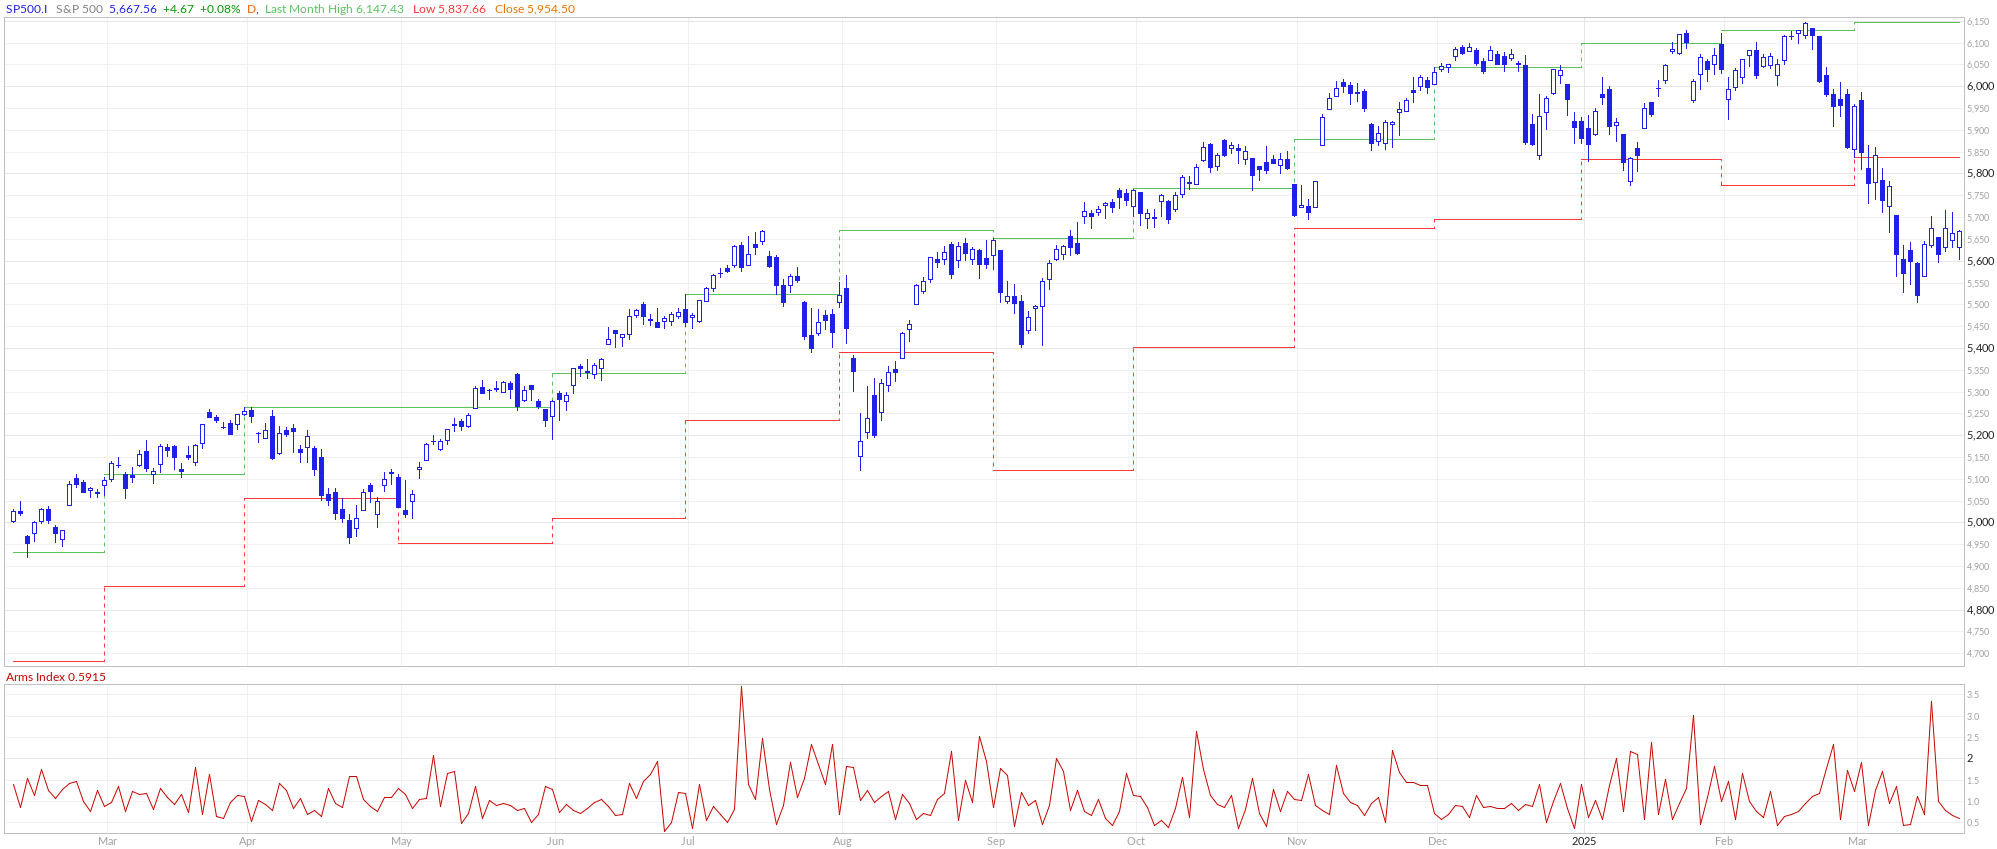
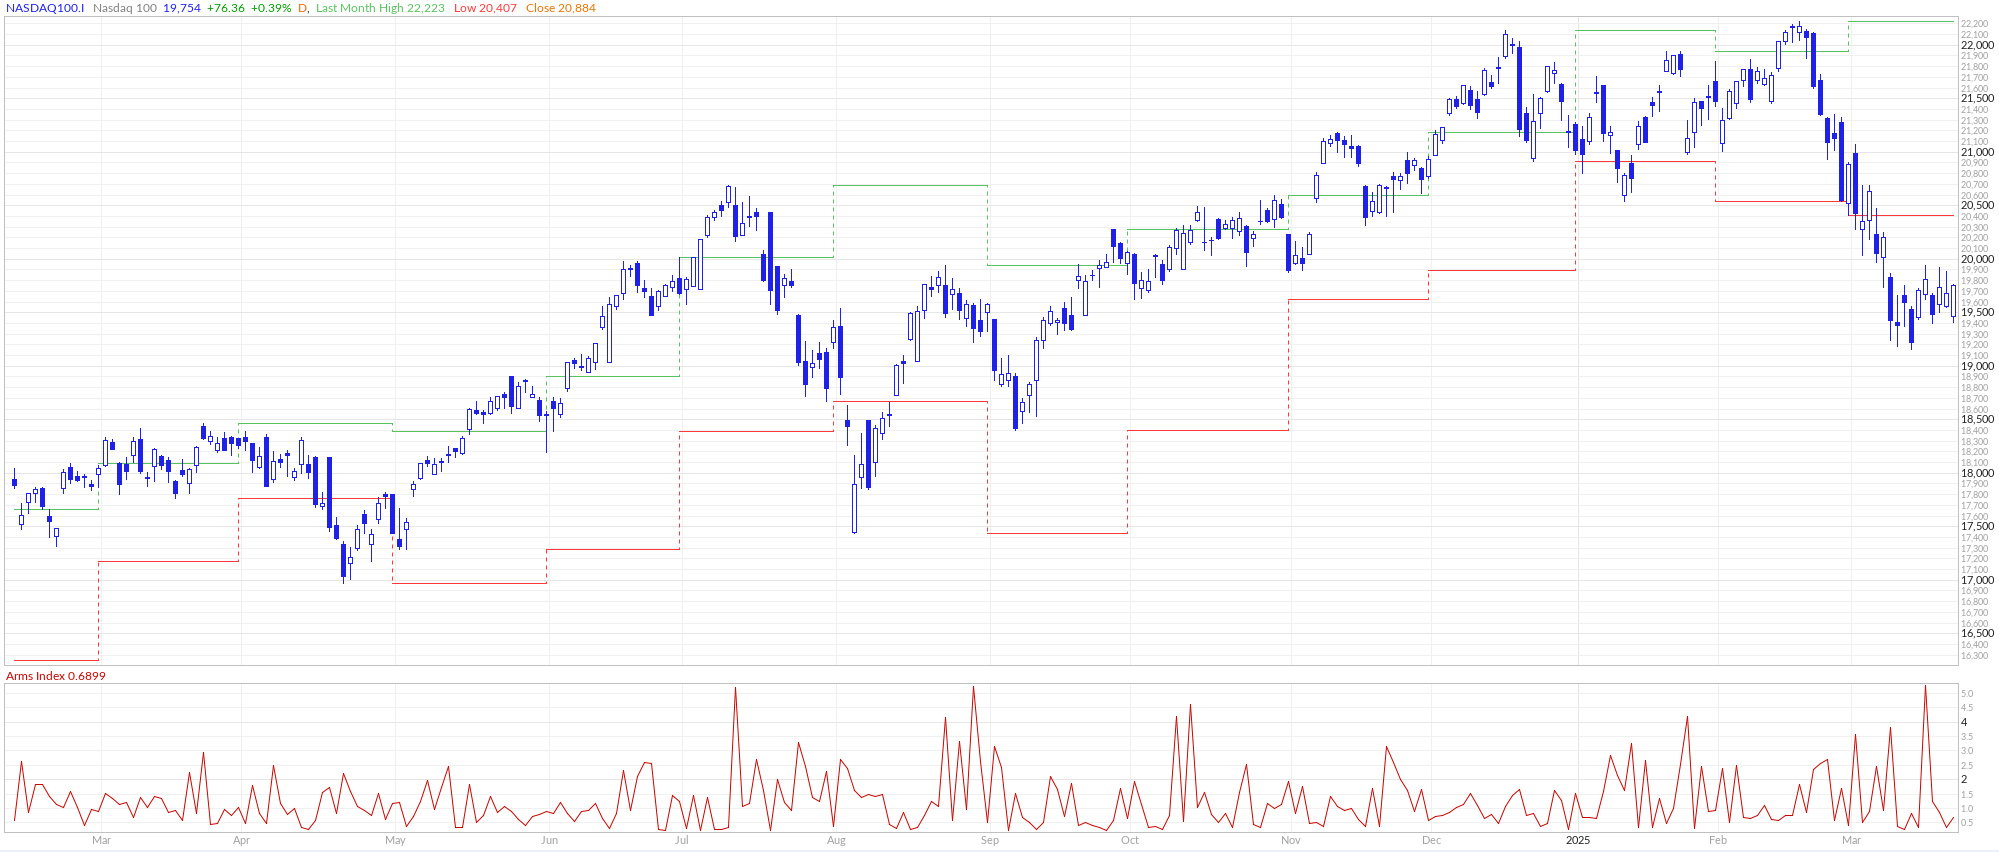
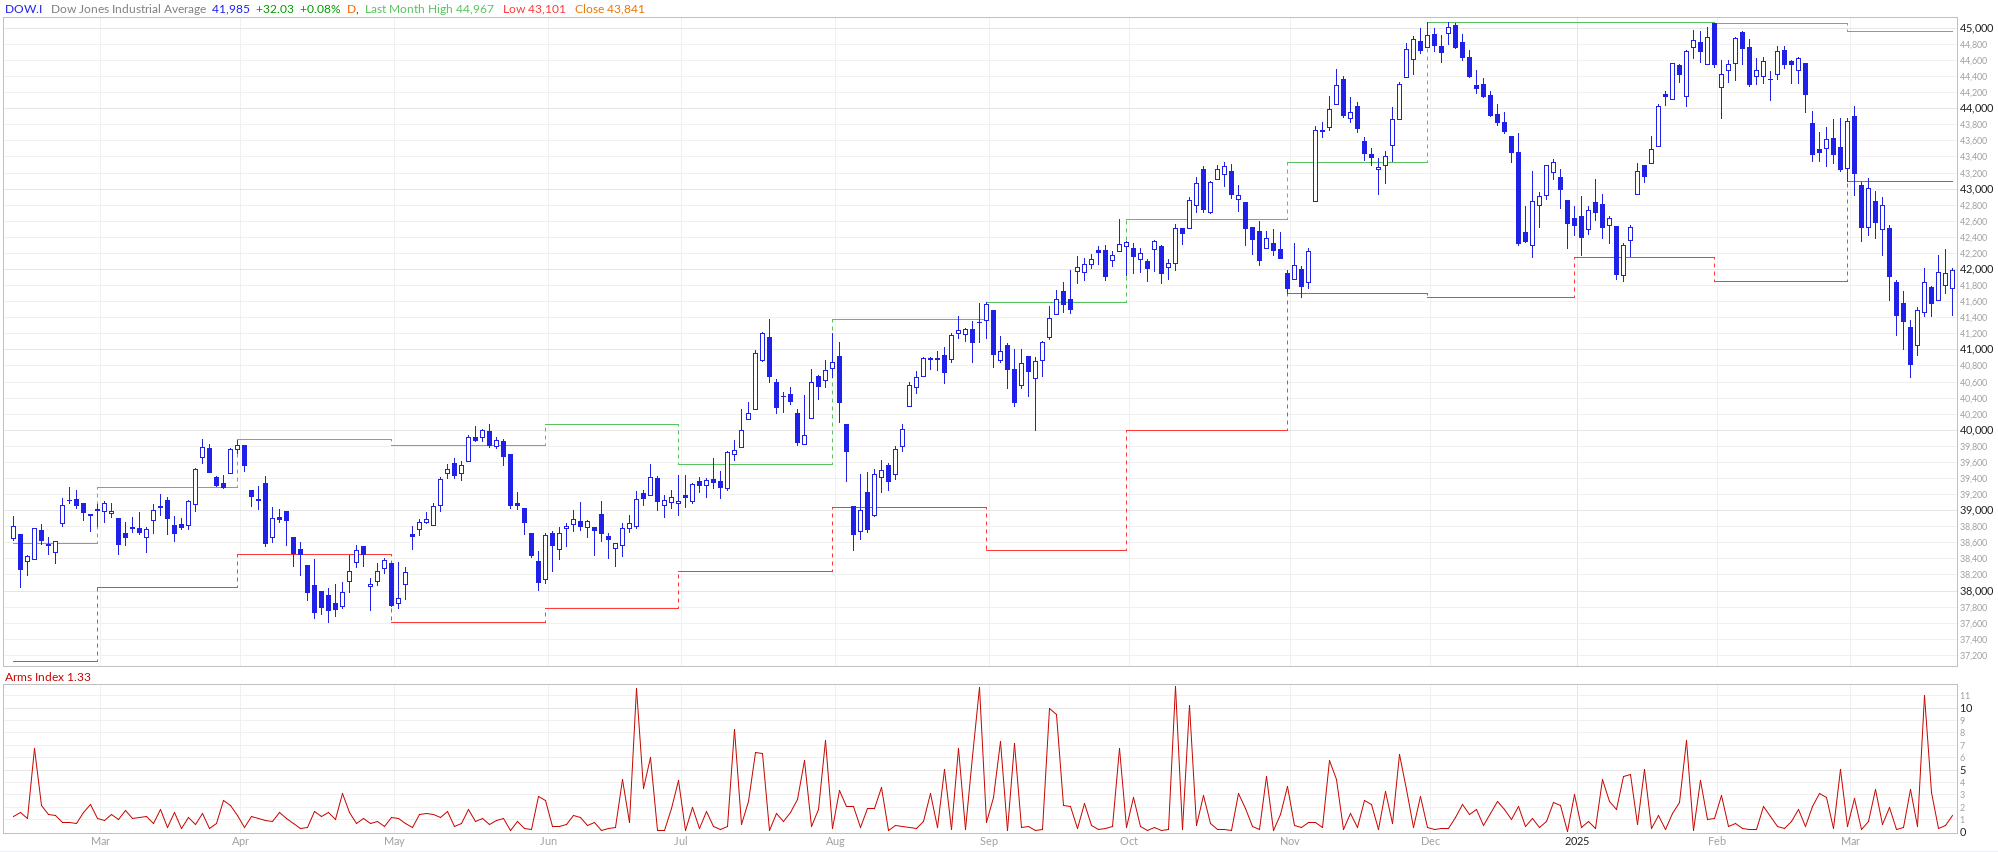
The S&P 500 managed to end in slightly positive territory after recovering from early losses on Friday, bolstered by a significant rally in the "Magnificent Seven" technology stocks that sparked short covering across the broader market. This late-week rebound helped major indices snap their multi-week declines, with the Dow Jones Industrial Average emerging as the week's top performer with a 1.2% advance. Meanwhile, the technology-heavy Nasdaq Composite lagged behind its peers as large-cap tech stocks generally underperformed.
All four major index ETFs remains under their 200-day SMA, reflecting investors' hesitancy amid concerns over potential supply chain disruptions, increased input costs, and implications for corporate profitability as new tariff policies take shape.
Federal Reserve: Steady Policy Amid Increasing Uncertainty
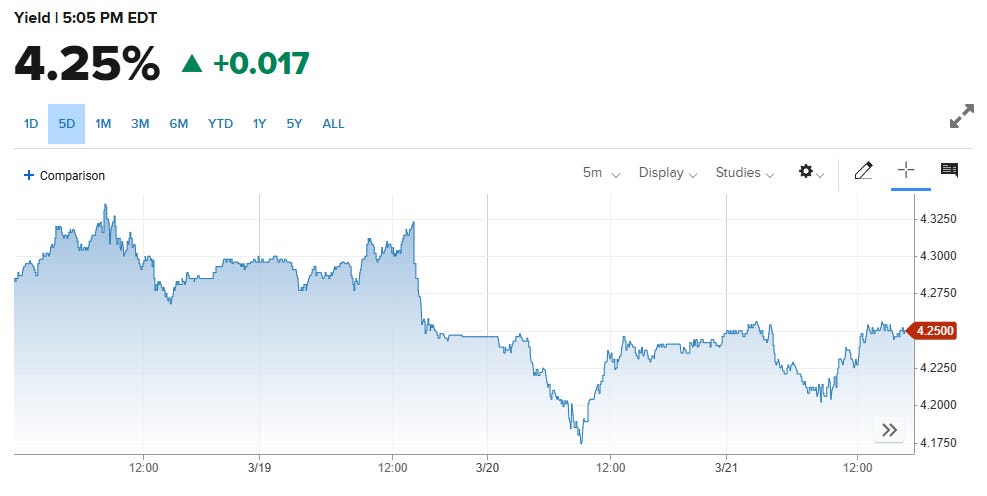
The Federal Open Market Committee (FOMC) concluded its March meeting as expected, maintaining its target range for the federal funds rate at 4.25%-4.5% for the second consecutive meeting. The committee's decision reflects a more patient approach toward easing monetary policy amid slowing economic growth and heightened policy uncertainty.
Fed Chair Jerome Powell's comments struck a cautiously optimistic tone, noting that while uncertainty had increased, the Fed's "base case" scenario considers the impact of tariffs to be transitory. The Fed maintained its projection of two rate cuts in 2025, despite raising inflation expectations to 2.7% for the year (up from 2.5% previously) and lowering economic growth forecasts to 1.7% (down from 2.1% in December).

In a significant policy adjustment, the Fed announced plans to slow its balance sheet reduction program, known as quantitative tightening (QT). Starting in April, holdings of U.S. Treasury securities will be reduced by $5 billion per month, down from the current $25 billion, while holdings of U.S. government agency debt and mortgage-backed securities will continue to decline by up to $35 billion monthly. This calibrated slowdown in QT effectively represents a modest easing of monetary conditions, as the Fed will increase its participation in Treasury bond auctions, potentially helping to contain upward pressure on bond yields.
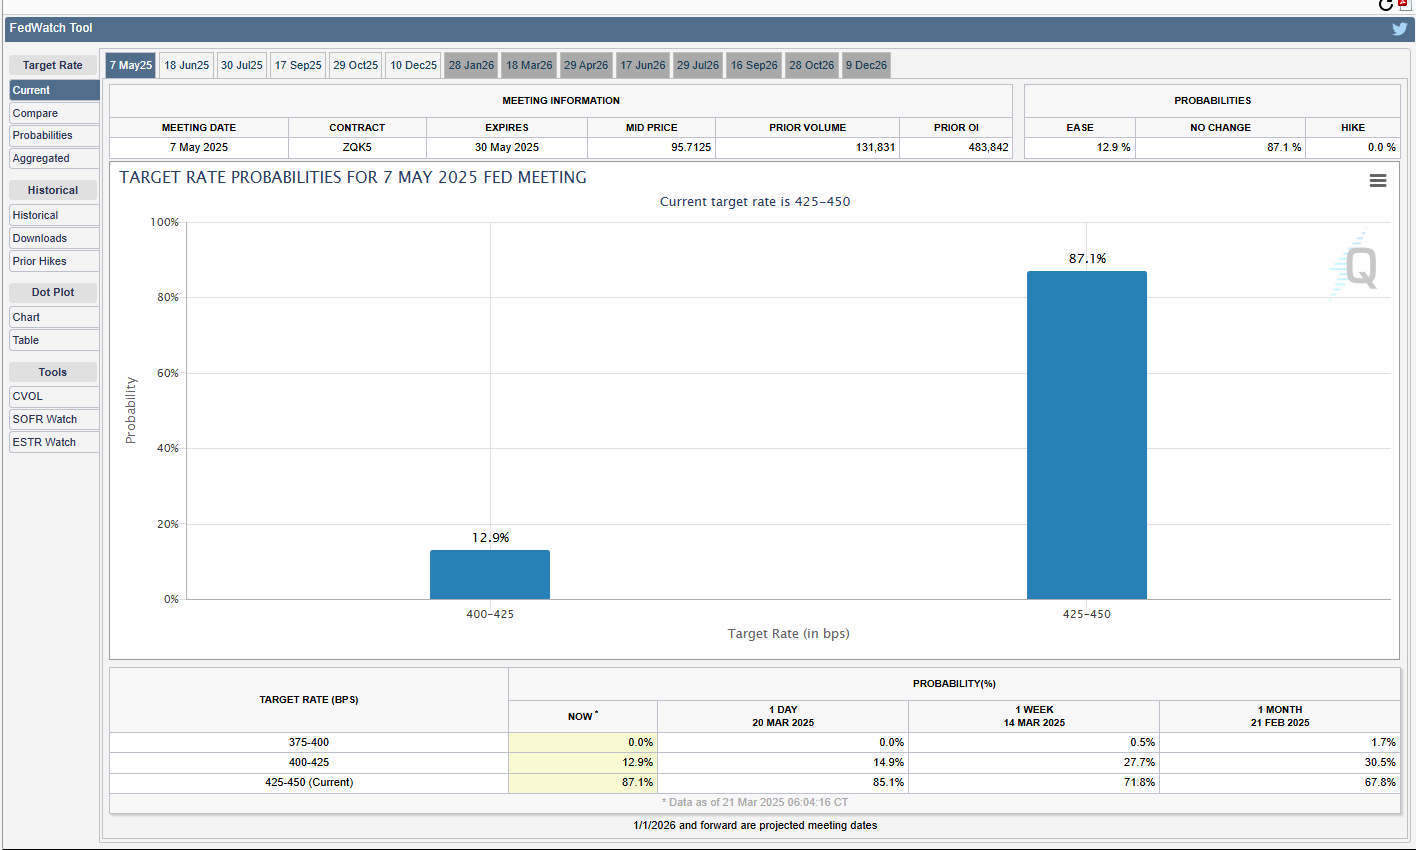
Markets are currently pricing in approximately 70 basis points of rate cuts by year-end, with only a 21% probability of a 25 basis point cut at the May 6-7 FOMC meeting. The current federal funds rate of approximately 4.35%, compared to PCE inflation at 2.5%, indicates monetary policy remains restrictive, with rates well above the neutral level typically considered to be around 1% above the inflation rate.
Fixed Income Markets: Yields Edge Higher on Fed Hawkishness
Treasury markets experienced modest pressure on Friday as yields edged slightly higher following hawkish comments from Federal Reserve officials. New York Fed President Williams characterized the current "modestly restrictive stance" as "entirely appropriate" given the solid labor market and inflation still running above the Fed's 2% target. Similarly, Chicago Fed President Goolsbee signaled support for steady policy, citing strength in economic data and the need for the Fed to maintain a steady hand.
The 10-year Treasury yield rose 0.9 basis points to 4.246% on Friday, as June T-notes relinquished early gains to close down 2.5 ticks. Earlier strength in T-notes had been supported by weakness in equity markets and positive momentum in 10-year German bunds, which provided some carryover support.
European bond yields presented a mixed picture, with the 10-year German bund yield falling 1.5 basis points to 2.765%, while the 10-year UK gilt yield increased 6.7 basis points to 4.712%. The Eurozone March consumer confidence index unexpectedly declined by 0.9 to -14.5, falling short of expectations for an improvement to -13.0.
In contrast to the Federal Reserve's steady stance, the European Central Bank appears poised for monetary easing, with ECB Governing Council member Stournaras indicating that "everything points in the direction of an ECB rate cut in April." Swaps are currently discounting a 59% probability of a 25 basis point rate cut at the ECB's April 17 policy meeting.
Corporate Earnings: Mixed Signals from Key Economic Barometers
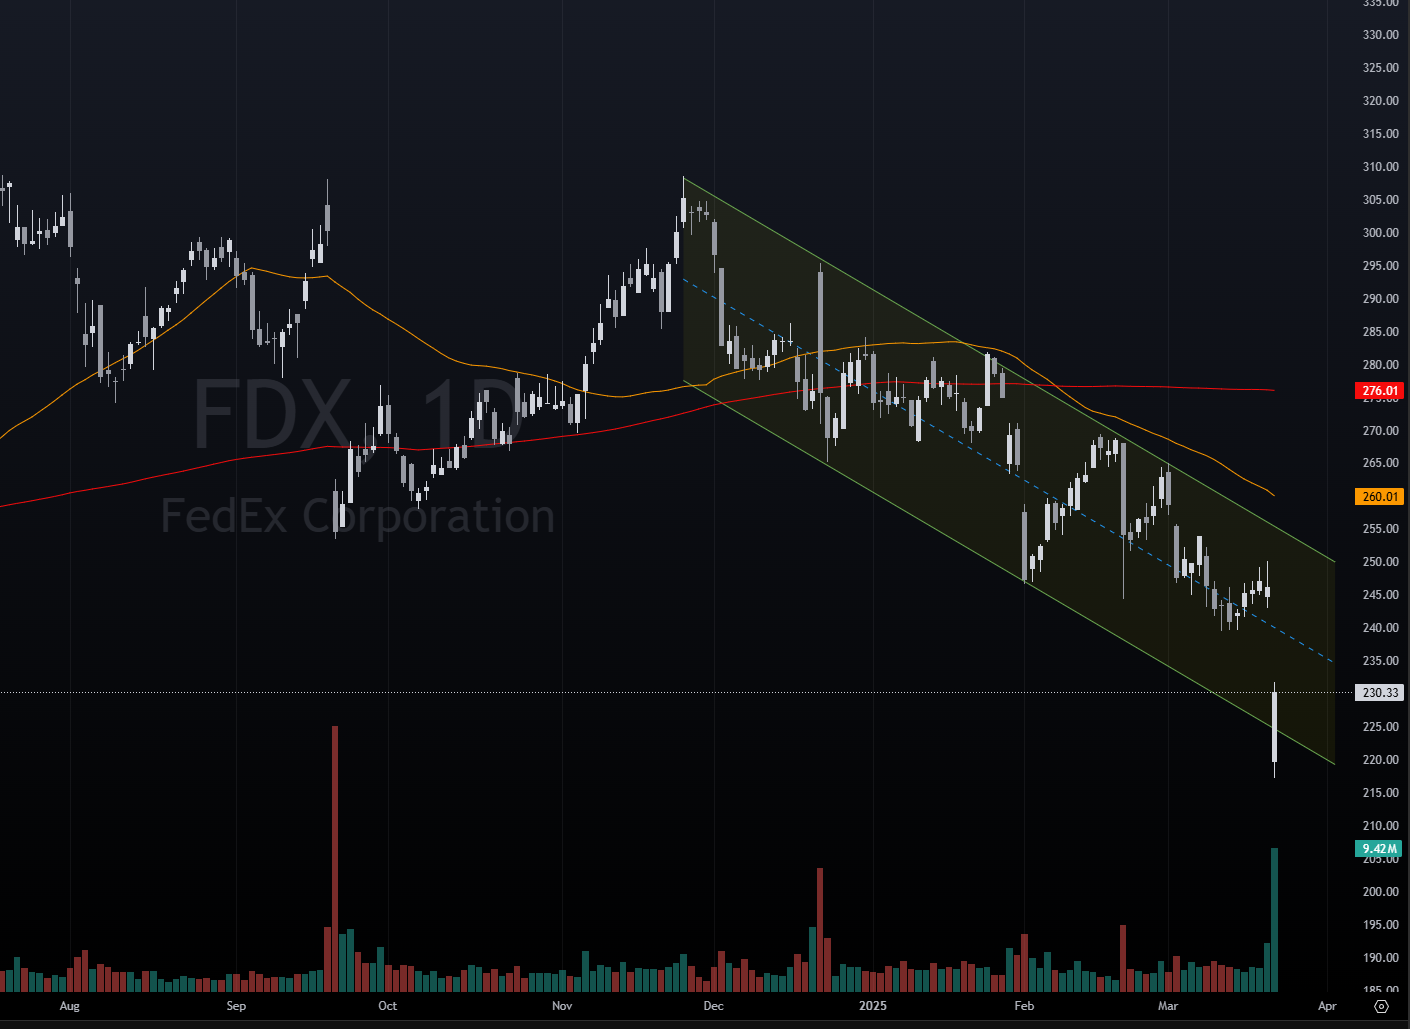
Corporate earnings reports sent mixed signals about the health of the economy and raised concerns about the potential impact of tariffs on future profitability. FedEx, widely considered an economic barometer, closed down more than 6% after cutting its profit outlook for the third consecutive quarter, citing cost pressures and weakening demand. The company reduced its full-year adjusted EPS forecast to $18.00-$18.60 from a previous estimate of $19.00-$20.00, falling short of the consensus expectation of $18.95.
The semiconductor sector faced significant pressure as Micron Technology closed down more than 8% after forecasting third-quarter adjusted gross margins below consensus estimates. This weakness spread throughout the chip sector, affecting companies like Lam Research, ASML Holding, Applied Materials, KLA Corp, Nvidia, and NXP Semiconductors, all of which closed lower by at least 1%.
Nike provided another source of concern, closing down more than 5% after warning of double-digit declines in digital traffic in fiscal 2026 and elevated inventory levels across categories. The company specifically cited tariffs on products from China and Mexico as contributing factors to its challenges.
Homebuilders also faced headwinds, with Lennar Corp declining more than 4% after reporting first-quarter home sales gross margins of 18.7% versus 21.8% year-over-year and forecasting second-quarter new orders below consensus expectations. This weakness extended to peers like PulteGroup, DR Horton, and Toll Brothers.
On a more positive note, Alnylam Pharmaceuticals surged more than 11% after winning expanded approval for its heart drug, Amvuttra, to treat transthyretin amyloid cardiomyopathy. Super Micro Computer climbed more than 7% following an upgrade from JPMorgan Chase, while Boeing advanced more than 3% after being selected by the US government to build the next-generation US fighter jet, edging out rival Lockheed Martin, which subsequently fell more than 4%.
Economic Data: Signs of Cooling from Above-Trend Pace
Recent economic indicators suggest the US economy is moderating from its above-trend pace, though not to levels indicating an imminent recession. The Conference Board's Leading Economic Index (LEI) continued its downward trend, falling 0.3% to 101.1 in February, primarily driven by weaker consumer expectations for business conditions and lower manufacturing new orders. However, the index's six-month change, while still negative, maintained its upward trajectory, suggesting that a recession is not imminent.
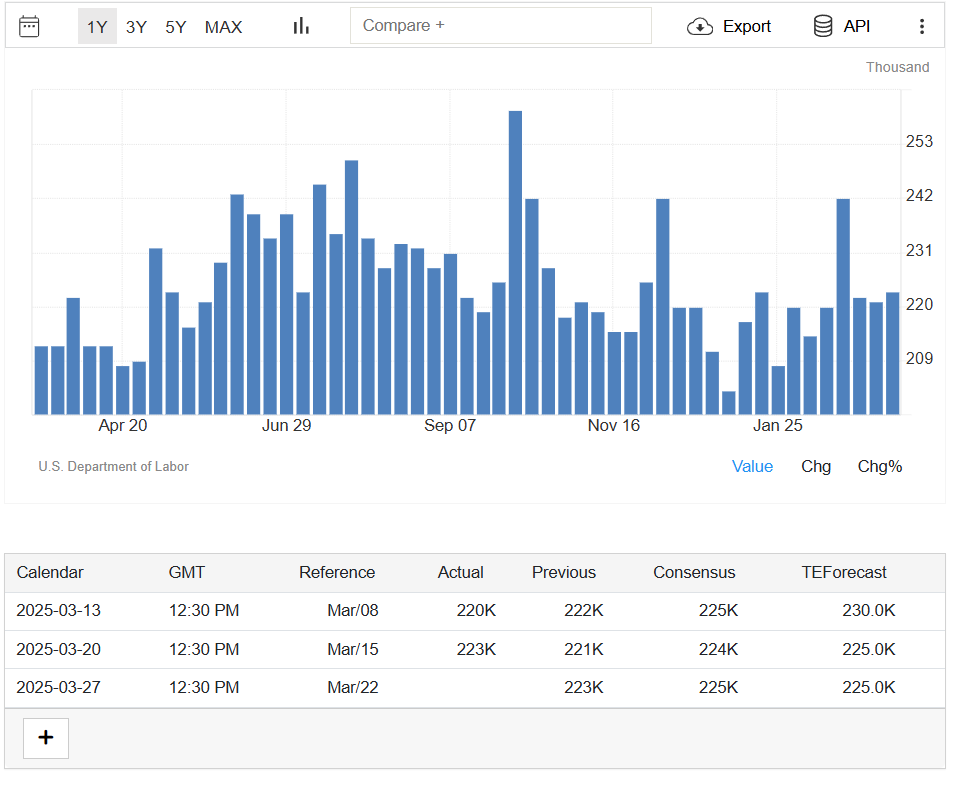
Labor market conditions remained generally favorable, with initial jobless claims rising to 223,000, slightly below estimates of 224,000. Claims have averaged about 227,000 over the past four weeks, modestly above the weekly average of 223,000 for 2024. While federal government layoffs may drive claims higher in the coming months, the underlying labor market remains healthy with the unemployment rate at 4.1% and job openings exceeding unemployment, supporting positive real wage growth.
The manufacturing sector showed surprising strength, with industrial production rising 0.7% in February, exceeding expectations for a 0.3% increase and reaching its highest level on record. Manufacturing output, which represents the majority of industrial production, increased by 0.9%, outpacing forecasts for a 0.3% rise and benefiting significantly from a surge in automotive output. This stronger-than-expected performance may partially reflect businesses accelerating purchases of inputs ahead of potential tariffs, suggesting the pace may not be sustainable.
Retail sales data painted a more subdued picture, with February sales rising just 0.2%, well below consensus estimates for a 0.7% increase. January's reading was also revised down to -1.2%, marking the steepest decline since July 2021. However, control group sales—which feed directly into the GDP calculation and exclude several volatile categories—rose 1% during the month, exceeding estimates for a 0.4% gain.
The housing market showed signs of improvement, with existing home sales increasing 4.2% in February, driven by improved supply conditions. February housing starts also surprised to the upside with an adjusted annual rate of 1.5 million starts, up 11.2% from January, although this represented a 2.9% year-over-year decline.
Sector Performance: Value Outpaces Growth
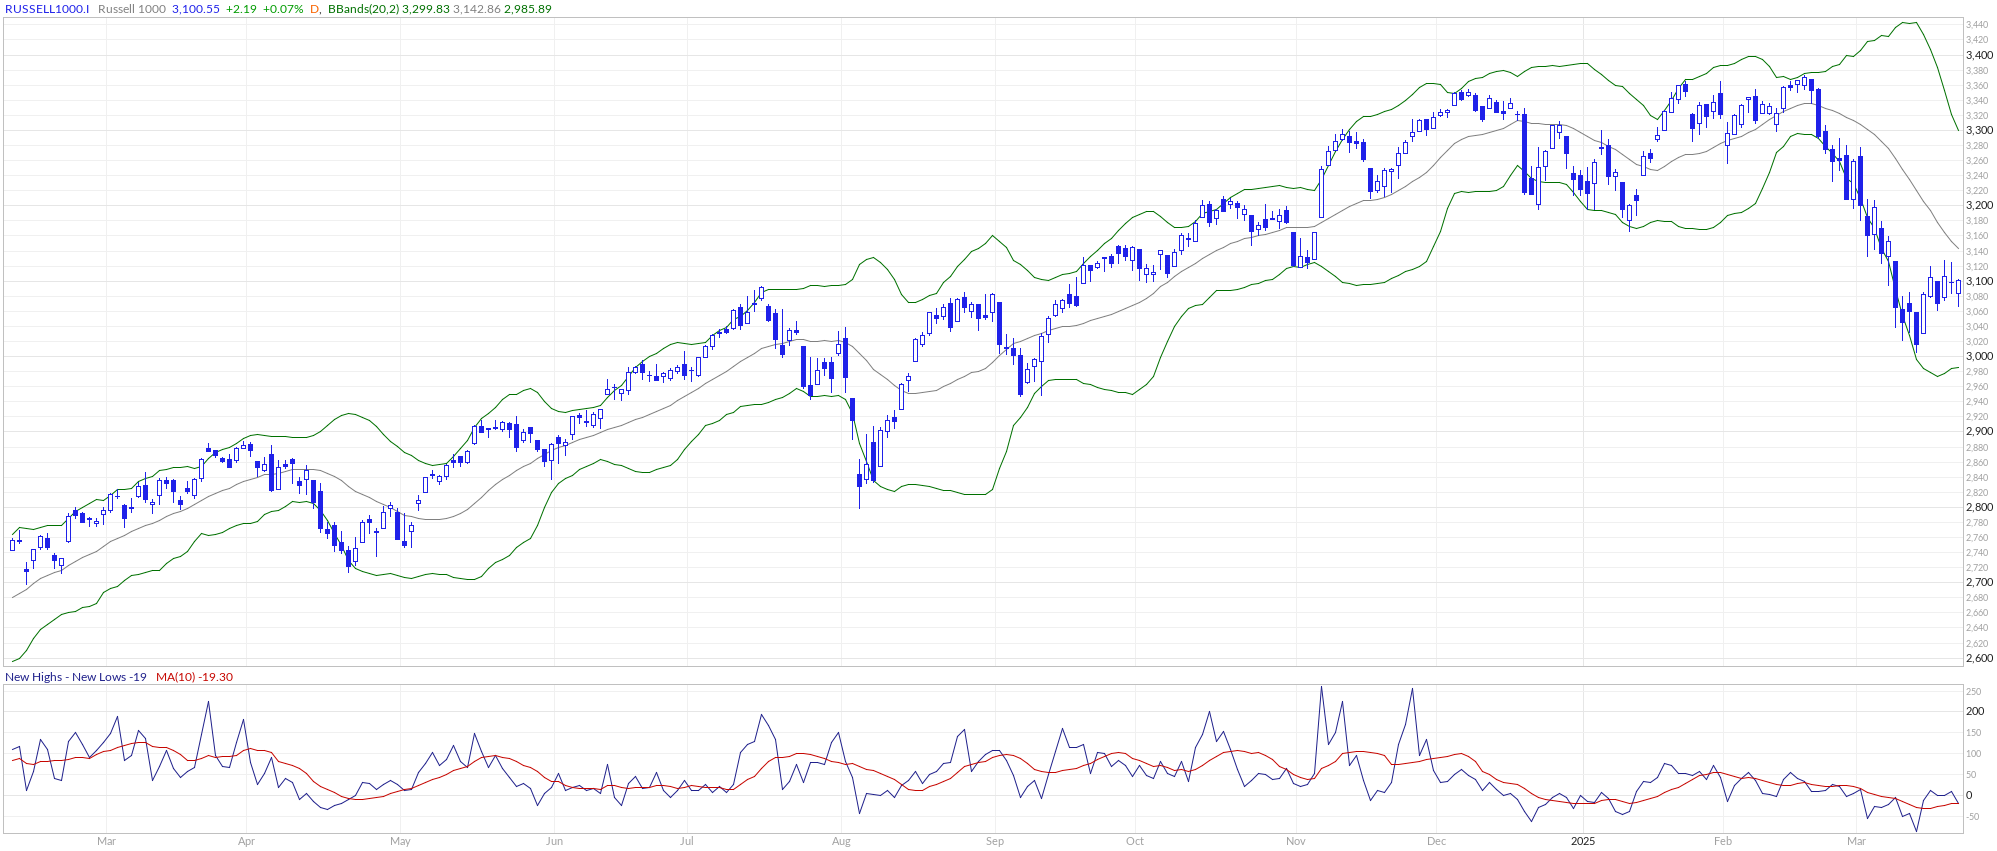
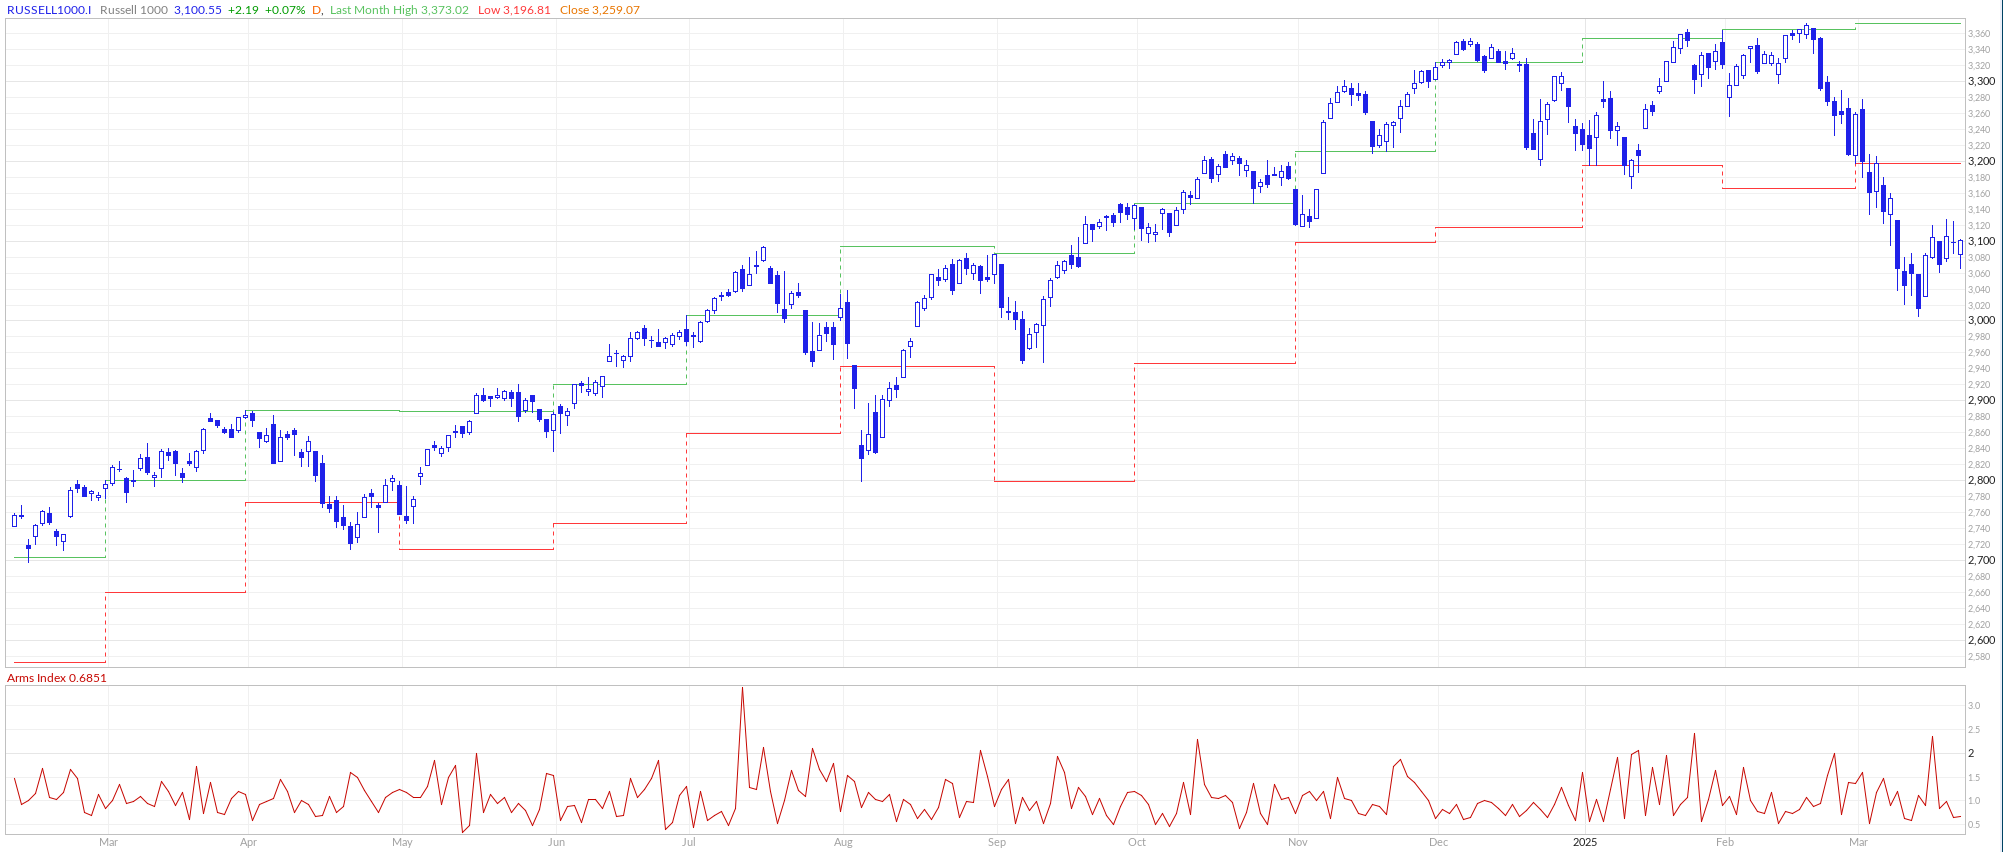
Value stocks continued their recent outperformance relative to growth counterparts, marking the fifth consecutive week of superior returns. As measured by the Russell 1000 indices, value has now outperformed growth by 897 basis points (8.97 percentage points) year-to-date, reflecting a significant rotation in market leadership.
The rebound of the Magnificent Seven stocks on Friday helped facilitate the broader market recovery. Tesla led gainers in the Nasdaq 100 with a more than 5% increase, while Apple, Meta Platforms, and Microsoft all gained more than 1%. Alphabet and Amazon.com also closed in positive territory, rising 0.73% and 0.65% respectively.
Within the broader market, industrials received a boost from Boeing's selection as the builder of the next-generation US fighter jet, while the healthcare sector benefited from Alnylam Pharmaceuticals' regulatory win. Consumer discretionary stocks faced pressure from Nike's disappointing outlook, and semiconductors broadly declined following Micron's underwhelming guidance.
International Markets: Diversification Benefits Emerge
International markets have emerged as a source of portfolio diversification benefits as US stocks experienced their recent pullback. International stocks have generated the strongest returns among major asset classes year-to-date, led by developed-market large-cap stocks. European markets, in particular, have benefited from expectations of a multi-year plan to increase defense and infrastructure spending, which could help stimulate growth in a region that has experienced economic stagnation in recent years.

Chinese stocks have also rallied on anticipation of additional fiscal and monetary stimulus measures aimed at boosting consumption and addressing deflation concerns. The weakening of the US dollar from its January peak has further enhanced returns for investments denominated in major international currencies.
Despite these positive catalysts, global markets closed lower on Friday. The Euro Stoxx 50 declined 0.50%, China's Shanghai Composite Index fell to a one-week low, closing down 1.29%, and Japan's Nikkei Stock 225 finished down 0.20%.
Fixed Income Performance: Solid Returns Amid Rate Expectations
US bond markets have produced robust returns in recent months, buoyed by expectations for Federal Reserve interest rate cuts and forecasts for slower economic growth. US investment-grade bonds, which form the foundation of fixed-income portfolios, have delivered among the strongest returns within the fixed-income universe.
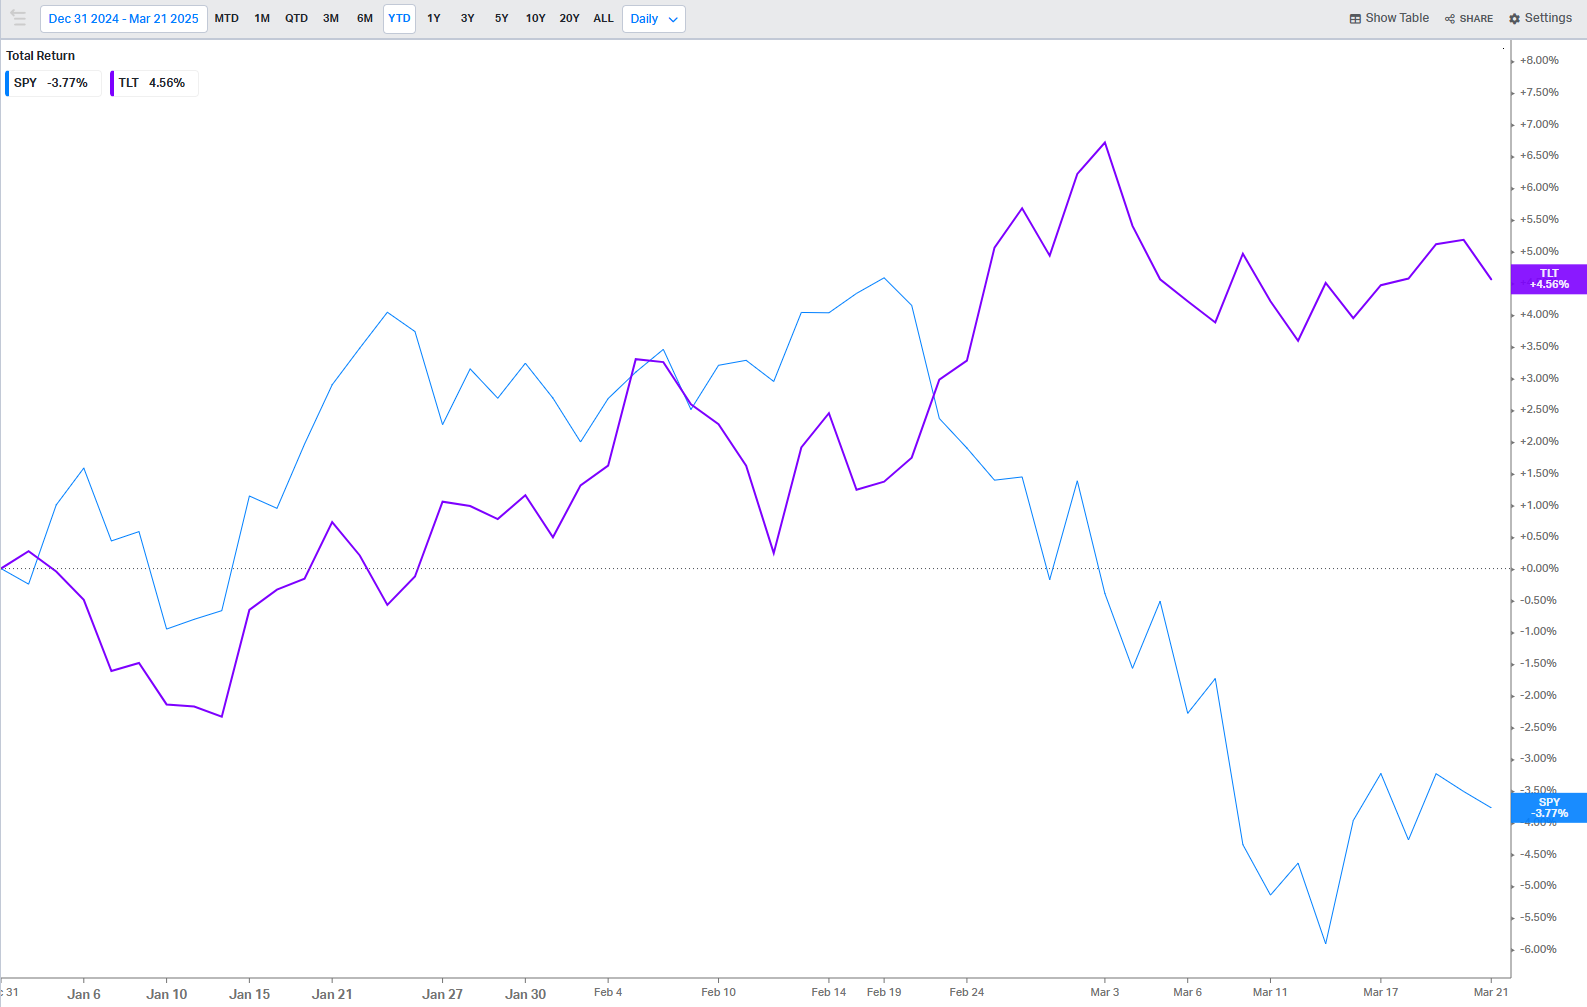
Emerging market debt has been the top performer in fixed income, extending last year's strong returns and highlighting the value of diversifying bond allocations beyond US securities. The favorable performance of fixed-income assets has provided an important counterbalance to equity market volatility, reinforcing the benefits of maintaining well-diversified portfolios.
Geopolitical Risks: Middle East Tensions Persist
Heightened geopolitical risks in the Middle East continued to weigh on market sentiment. Israel launched a series of airstrikes across Gaza, ending a two-month ceasefire with Hamas, as Israeli Prime Minister Netanyahu pledged to act "with increasing military strength" to free hostages and disarm Hamas.
Concurrently, the US maintained its campaign of strikes against Yemen's Houthi rebels, with US Defense Secretary Hegseth characterizing the strikes as "unrelenting" until the group ceases attacks on vessels in the Red Sea. The Houthi rebels have threatened to respond by targeting US vessels in the region, raising concerns about potential disruptions to global shipping routes.
These persistent geopolitical tensions, combined with uncertainty surrounding US trade policy, have contributed to increased demand for safe-haven assets, with gold trading near record highs at $3,012 per ounce, representing a 13.3% gain year-to-date.
Market Technical Factors: Triple Witching and Pension Rebalancing
Market volatility was heightened on Friday due to the quarterly "triple witching" expiration of nearly $4.5 trillion of March options and futures contracts tied to stocks, indexes, and exchange-traded funds. This event typically creates the potential for sudden price movements as contracts expire and traders roll over existing positions.
Looking ahead, several technical factors could influence market direction in the near term. Systematic trading strategies have reached maximum short positions, potentially setting the stage for a reversal if market conditions improve. Additionally, pension funds are projected to purchase approximately $29 billion of equities during their quarterly rebalancing period, representing a historically high level of potential buying pressure.
Trade Policy Concerns: Tariff Implementation Timeline Approaches
Market participants remain focused on President Trump's April 2 deadline for implementing a series of broad reciprocal tariffs on foreign nations. These trade policy concerns have pressured stocks over the past two weeks, with investors expressing apprehension about the potential negative impact on economic growth and corporate earnings.
The administration has already implemented significant tariff increases, imposing 25% tariffs on Canadian and Mexican goods and doubling the tariff rate on Chinese goods to 20% from 10% on March 4. President Trump recently reiterated his intention to impose reciprocal tariffs and additional sector-specific tariffs on April 2, maintaining pressure on markets as this deadline approaches.
Looking Ahead: Growth Outlook and Policy Impact
Despite the various challenges facing financial markets, expectations persist for an acceleration in economic growth later in the year, supported by anticipated lower interest rates and pro-growth policies such as deregulation and tax cuts. The Fed's measured approach to monetary policy, combined with its plans to slow the pace of quantitative tightening, should help provide a more supportive backdrop for both the economy and markets as 2025 progresses.
However, the implementation and potential impact of tariffs remain significant sources of uncertainty that could influence both economic growth trajectories and inflation dynamics. The Fed has acknowledged these uncertainties in its projections, lowering its growth forecast while raising its inflation expectations, suggesting it anticipates tariffs will slow economic growth while triggering a one-time adjustment in prices that leads to a short-term increase in inflation.
As these policy developments unfold in the coming weeks, market participants will be closely monitoring their implications for global supply chains, input costs, and overall corporate profitability. The market's reaction to these developments will likely determine whether the recent technical signals suggesting potential upside can materialize into a more sustained market recovery.
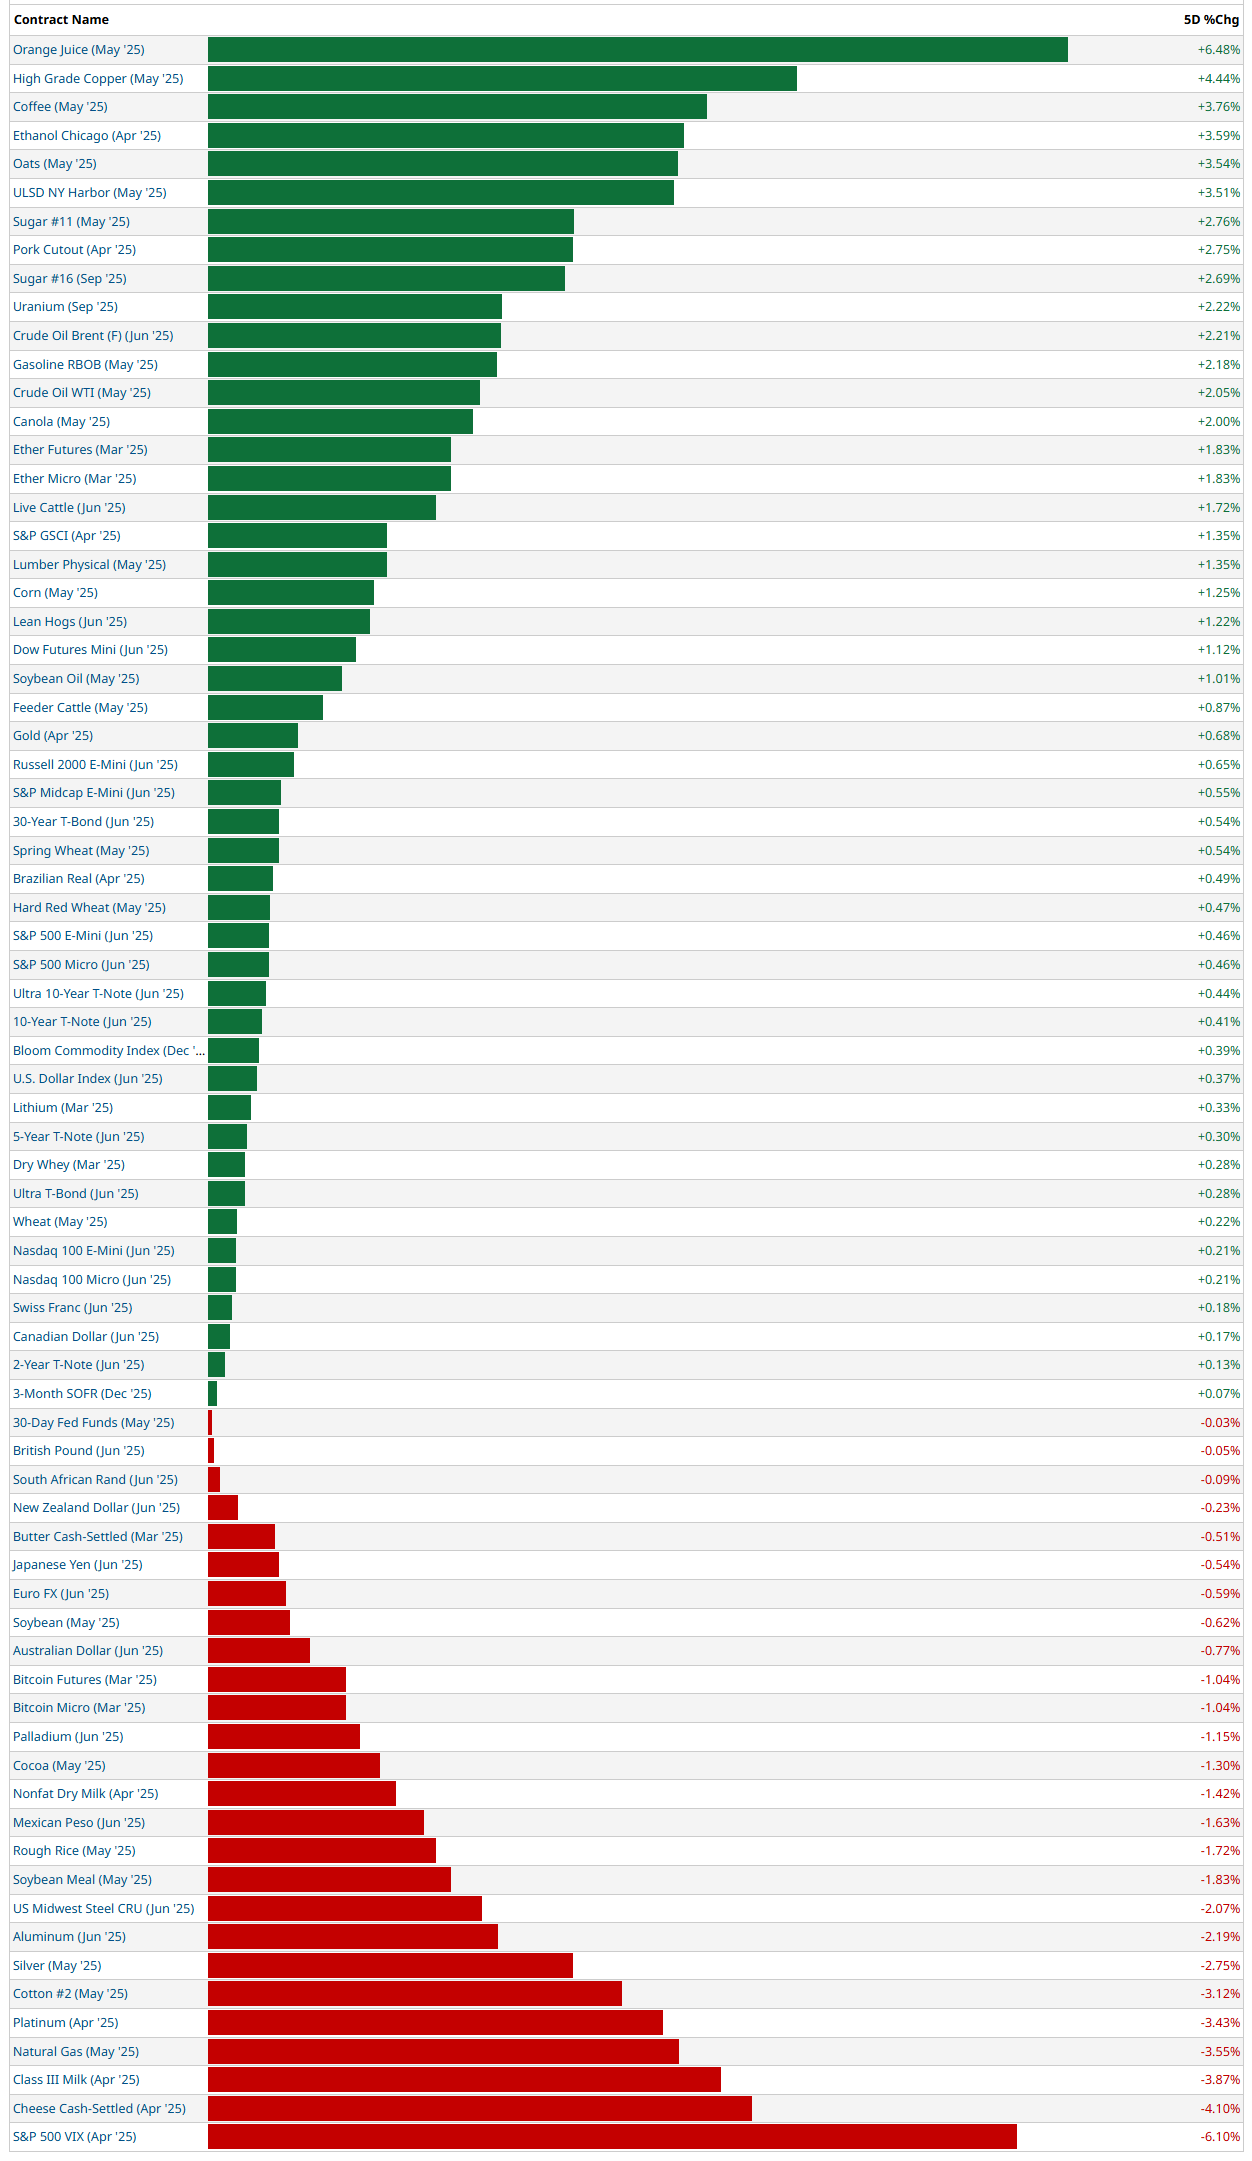
5-Day Futures Performance Leaders
Equity Futures (S&P 500, Dow Jones, Nasdaq):
Market Recovery: After a period of volatility, U.S. stock markets showed resilience. The S&P 500 and Nasdaq both snapped four-week losing streaks, with the S&P 500 rising by 0.5% and the Nasdaq by 0.2% for the week. The Dow Jones Industrial Average also posted a weekly gain of 1.2%.
Earnings Reports: Corporate earnings had a notable impact on equity futures. FedEx ( FDX 0.00%↑ ) shares declined by 6.5% after reporting weaker-than-expected fiscal third-quarter earnings and lowering its full-year guidance due to ongoing industrial economic challenges. Nike ( NKE 0.00%↑ ) shares fell 5.5% following a forecasted decrease in sales for the current quarter. Additionally, Micron Technology's ( MU 0.00%↑ ) stock dropped 8% despite exceeding earnings expectations, as investors expressed concerns over future demand.
Commodity Futures (Oil, Gold):
Oil Prices: Oil futures experienced gains this week amid a complex backdrop of geopolitical tensions and economic factors. New U.S. sanctions on Iran and issues in the Middle East supported price increases. However, fears of a global recession and increasing output from OPEC+ exerted downward pressure. Consequently, oil prices fluctuated but managed to score a weekly rise.
Gold Prices: Gold futures surged, briefly surpassing the $3,000 per ounce mark for the first time ever. This increase was driven by investors seeking safe-haven assets amid economic uncertainties and market volatility.
Currency Futures (U.S. Dollar):
Dollar Weakness: The U.S. dollar faced a 4.4% year-to-date decline, challenging expectations of its continued rise post-election. This depreciation influenced currency futures and reflected shifting investor sentiment.
S&P 500 Sector Insights
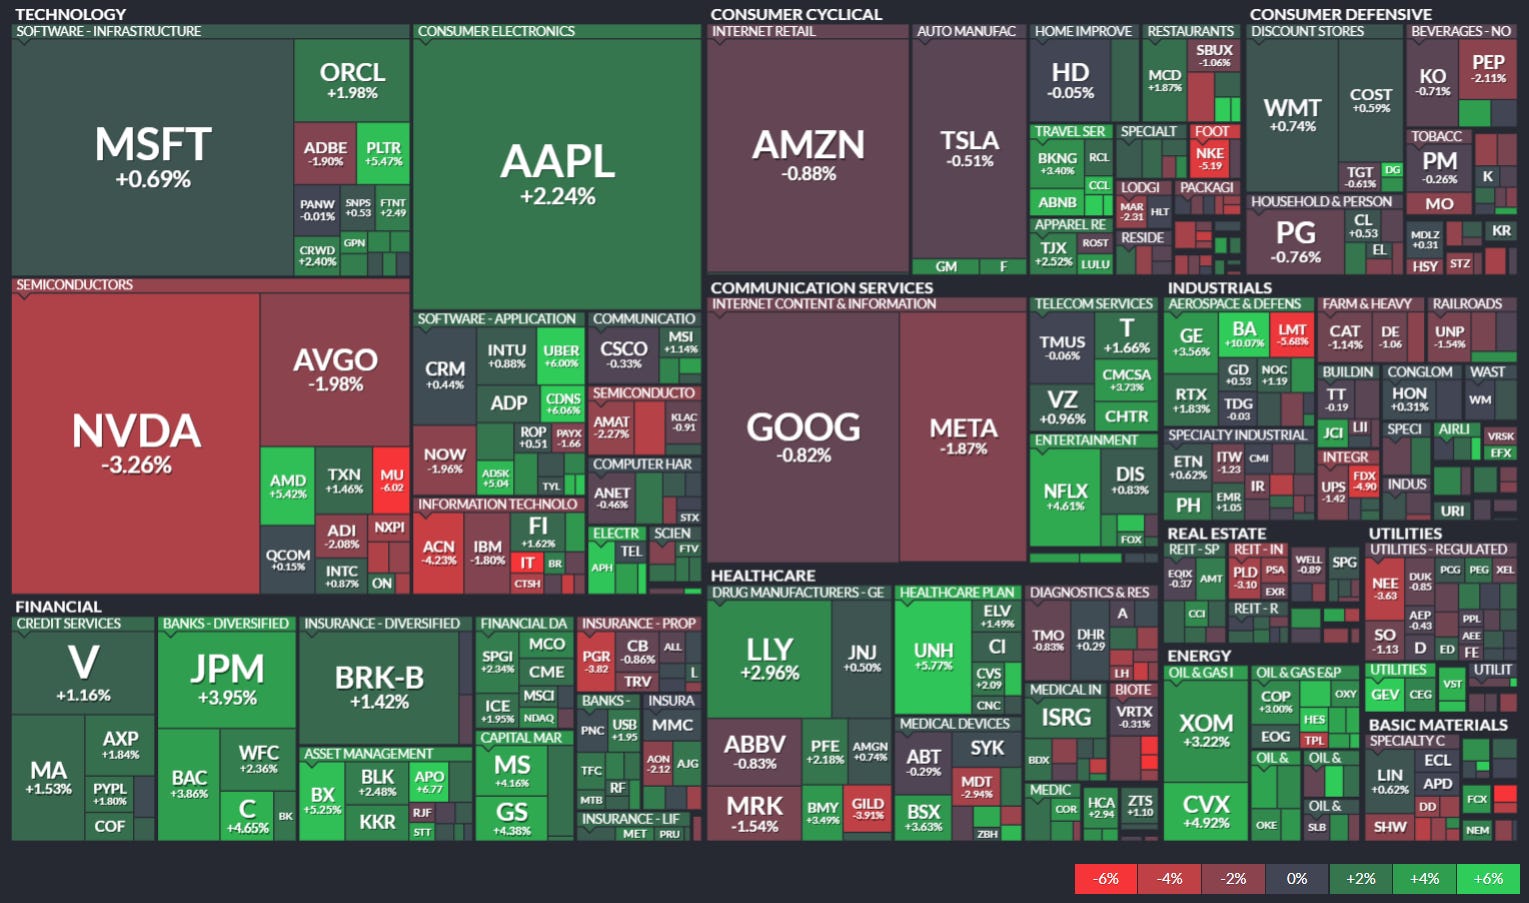
Technology Sector
Mixed Performance: Microsoft ( MSFT 0.00%↑ ) and Apple ( AAPL 0.00%↑ ) posted gains, while Nvidia ( NVDA 0.00%↑ ) and Broadcom ( AVGO 0.00%↑ ) saw notable losses.
Key News:
Nvidia (NVDA -3.26%) Decline: The drop in Nvidia follows a recent pullback in AI-related stocks, profit-taking, and concerns about China’s semiconductor restrictions impacting demand.
Microsoft (MSFT +0.69%) & Apple (AAPL +2.24%) Gains:
Microsoft is benefitting from its continued AI expansion with OpenAI.
Apple surged as investors anticipate a revival in iPhone sales, particularly in China, after recent setbacks.
Semiconductors
Overall Weakness: Nvidia (NVDA), Broadcom (AVGO), Micron (MU), and Advanced Micro Devices (AMD) saw divergent performance.
Key News:
Micron (MU -6.02%) Dropped Sharply: Despite beating earnings expectations, the company issued a cautious forward outlook that impacted the semiconductor sector.
AMD (AMD +5.42%) Gains: AMD continues to benefit from its AI chip momentum, driven by expectations of strong server demand.
Financials
Strong Performance: JPMorgan ( JPM 0.00%↑ +3.95%), Goldman Sachs ( GS 0.00%↑ +4.38%), and Bank of America ( BAC 0.00%↑ +3.86%) led gains.
Key News:
Banks surged after Fed signals fewer rate cuts than expected, reinforcing higher-for-longer interest rates, which benefit banking profits.
Communication Services
Weak Performance: Google ( GOOG 0.00%↑ -0.82%) and Meta ( META 0.00%↑ -1.87%) were down.
Key News:
Meta is facing headwinds driven by EU regulations on data privacy that could impact advertising revenue.
Industrials
Mixed Performance: Boeing ( BA 0.00%↑ +10.07%) soared, while Lockheed Martin ( LMT 0.00%↑ -5.65%) slumped.
Key News:
Boeing’s Surge: Driven by new aircraft orders from Japan Airlines and improved analyst expectations.
Lockheed Martin’s Drop: Tied to budget concerns surrounding defense spending and project delays.
Energy
Strong Performance: ExxonMobil ( XOM 0.00%↑ +3.22%) and Chevron ( CVX 0.00%↑ +4.92%) were among top gainers.
Key News:
Oil Prices Surged amid Middle East tensions and U.S. sanctions on Iran, fueling oil and gas stock gains.
Consumer Discretionary
Weak Performance: Amazon ( AMZN 0.00%↑ -0.88%) and Tesla ( TSLA 0.00%↑ -0.51%) saw declines.
Key News:
Tesla’s Decline: Amid China EV competition concerns, as BYD continues to dominate in affordability.
Nike (NKE -5.19%) Slid: Lowered sales expectations due to weak consumer demand in China.
Final Takeaways:
Tech & Semiconductors struggled due to AI sector pullbacks, regulatory concerns, and Micron’s outlook.
Financials surged as the Fed maintained a higher-for-longer rate stance.
Energy spiked as oil prices rose on geopolitical risks.
Industrials were mixed, with Boeing soaring but defense stocks slipping.
Consumer Discretionary underperformed, hit by China demand concerns.
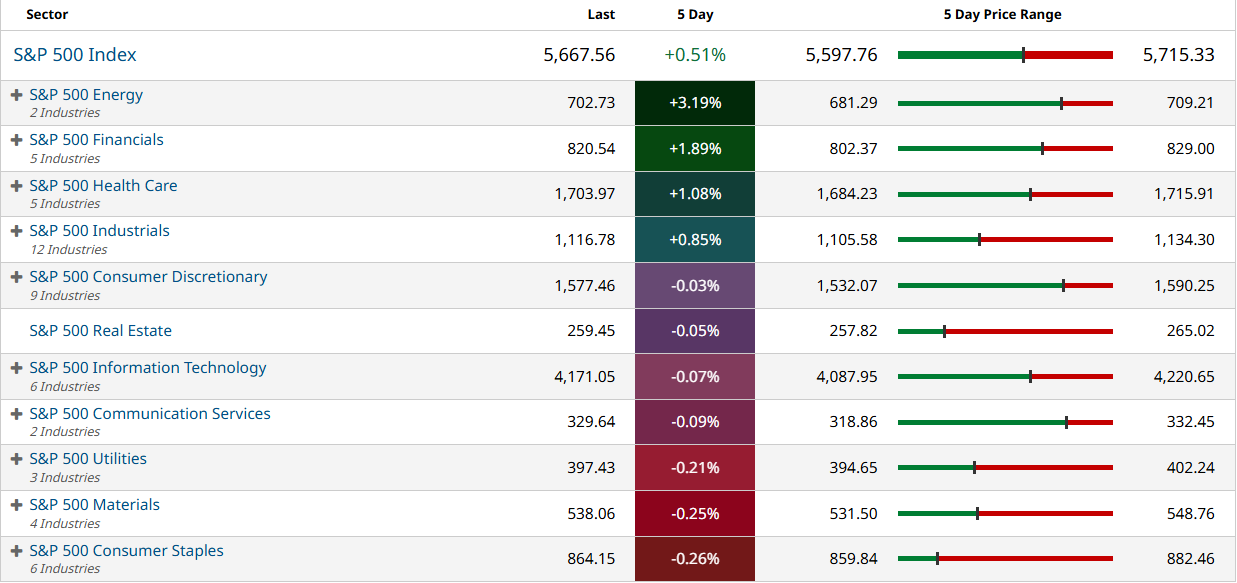
5-Day Sector Leaderboard
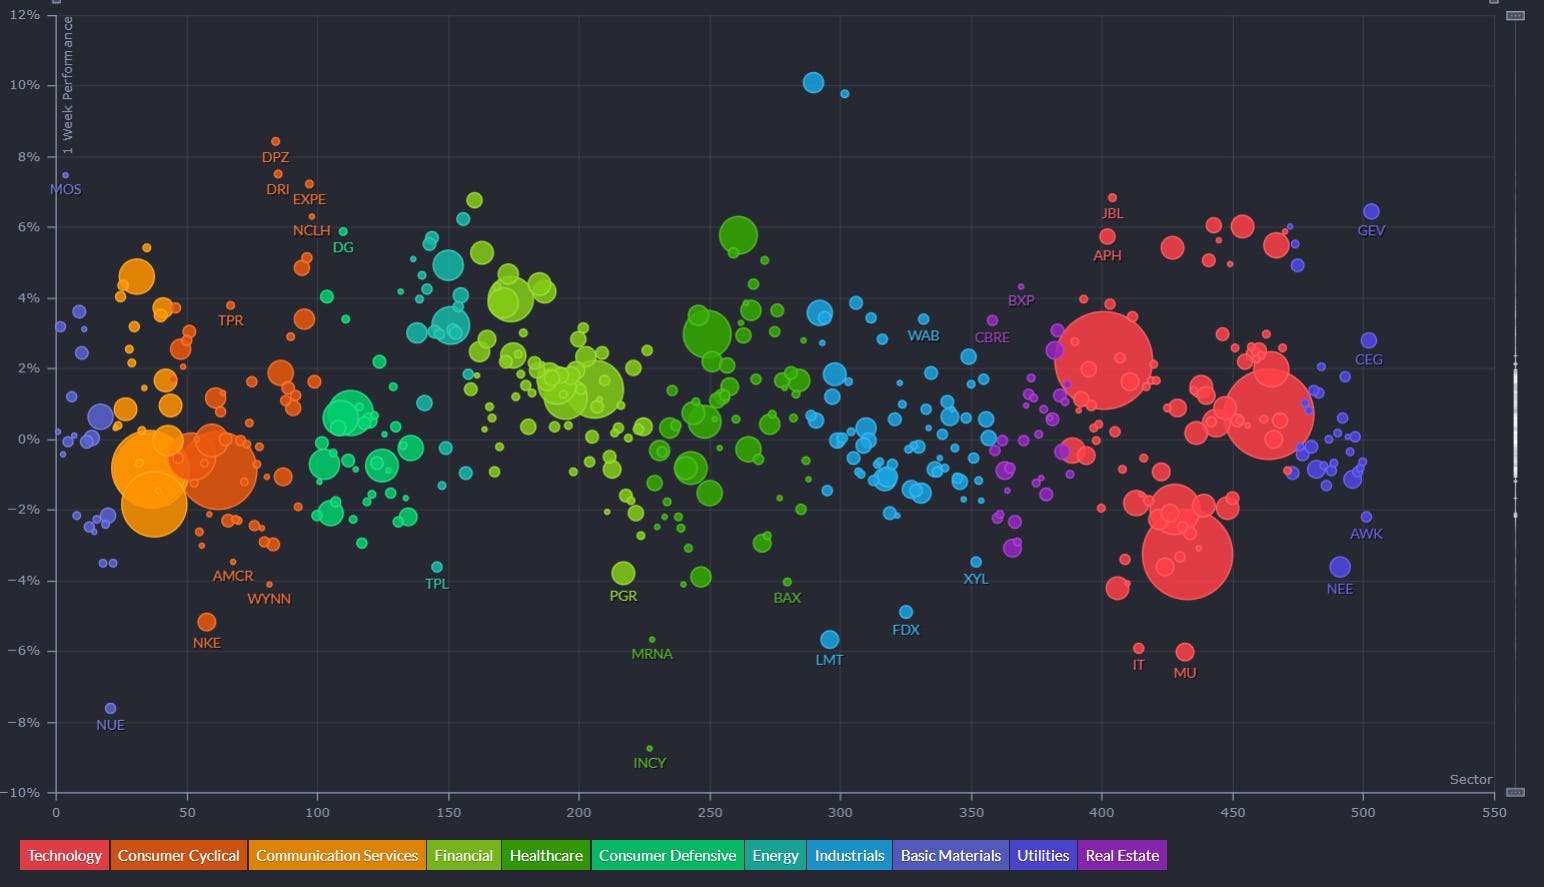
5-Day Individual Performance Grouped By Sector (Size By Market Cap)
ETF Insights
Reviewing a heatmap like this weekly can be incredibly helpful for investors as it provides a quick and visual summary of market performance across various sectors, asset classes, and geographies.
1. Sector and Asset Class Trends
Identify Strong and Weak Sectors: Investors can quickly spot which sectors (e.g., technology, energy, healthcare) are performing well or underperforming.
Asset Class Diversification: Seeing how commodities, fixed income, equities, and cryptocurrencies performed helps assess diversification.
2. Market Sentiment
Risk-On or Risk-Off: A green-dominated map suggests bullish sentiment, while red indicates bearish sentiment. Investors can align their strategies accordingly.
Volatility Indicators: Observing movements in volatility indices (e.g., VIX) can highlight changing market dynamics.
3. Regional Analysis
Global Insights: Performance in developed and emerging markets (e.g., Europe, China, Asia-Pacific) helps in gauging international investment opportunities or risks.
Currency Impacts: Movements in forex or country-specific ETFs can indicate currency-driven market trends.
4. Thematic Trends
Growth vs. Value: Comparing the performance of growth ETFs (e.g., VUG) versus value ETFs (e.g., VTV) reveals the prevailing market preference.
Industry Leadership: Highlighting leadership within industries (e.g., gold miners, semiconductors) can inform thematic plays.
5. Monitoring Investments
Portfolio Alignment: Investors can track how their existing investments or watchlist align with broader market trends.
Rotation Signals: Seeing week-over-week changes in sector dominance may signal sector rotation opportunities.
6. Risk Management
Recognizing Overbought/Oversold Conditions: Consistent underperformance or overperformance in specific areas may indicate potential mean-reversion trades.
Correlation Awareness: By observing how different asset classes move, investors can manage portfolio correlation and risk.
7. Decision Support
Identify Outperformers/Underperformers: ETFs, sectors, or indices that repeatedly outperform or underperform can help refine trading or investment strategies.
Macro Perspective: Weekly trends highlight macroeconomic or geopolitical influences affecting markets.
Regularly reviewing a heatmap like this is a strategic practice that supports data-driven decision-making while fostering a holistic understanding of market dynamics.
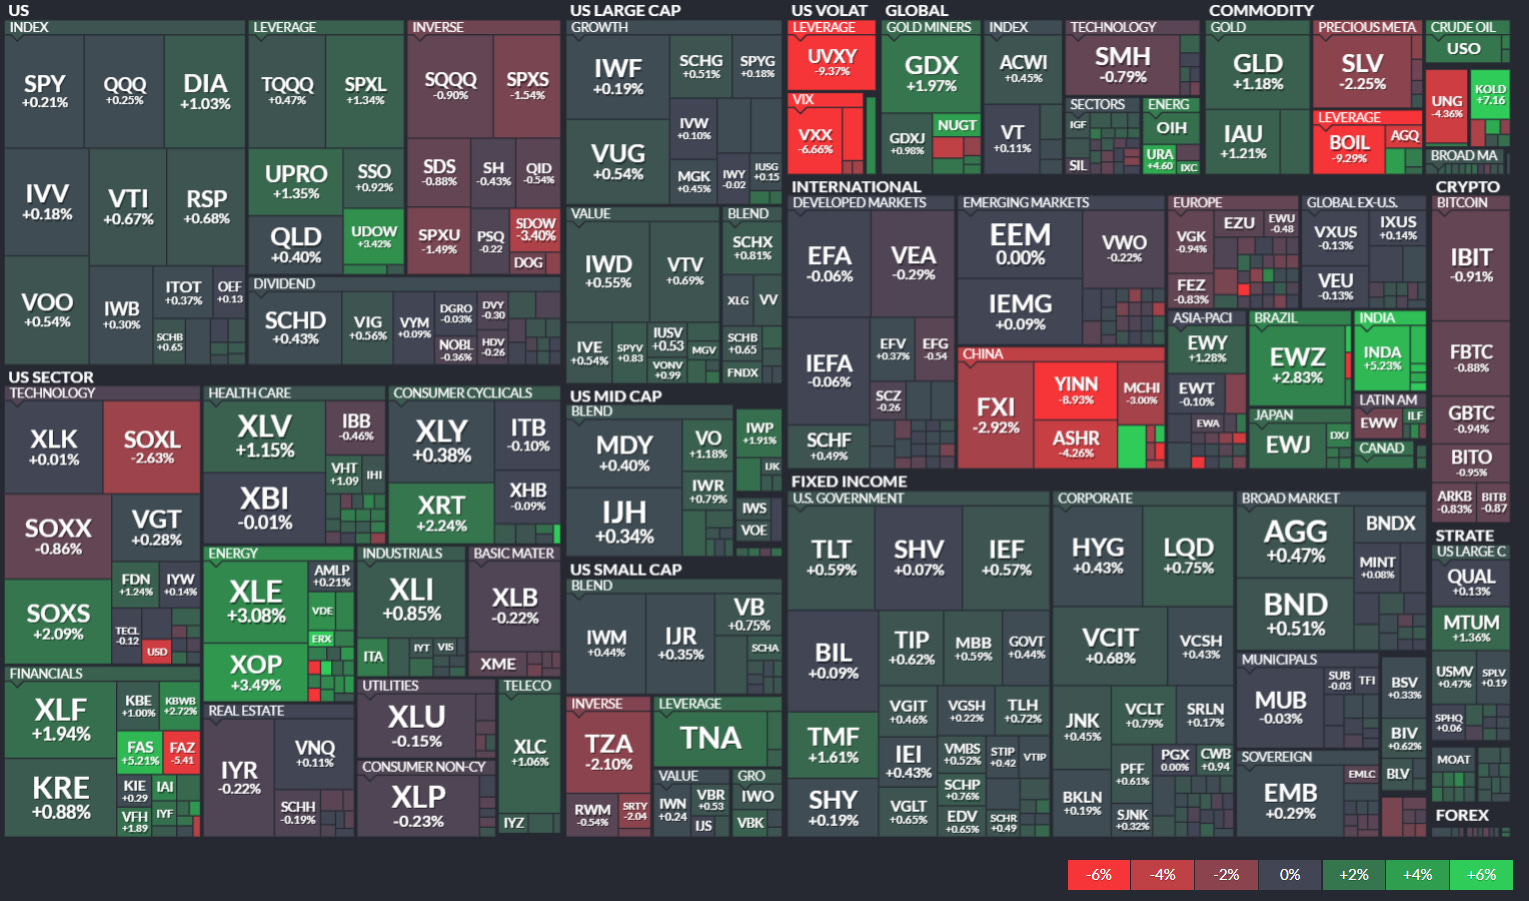
1. Broad Market & U.S. Equities
Slightly Positive Bias:
The S&P 500 ETF (SPY +0.21%), Nasdaq-100 ETF (QQQ +0.25%), and Dow Jones ETF (DIA +1.03%) all showed moderate gains, indicating a resilient market performance despite mixed sector moves.
Russell 2000 ETFs (IWM +0.44%) and mid-cap ETFs (MDY +0.40%) also showed slight gains, suggesting broader participation in the rally beyond just large-cap tech.
Value vs. Growth:
Value ETFs (VTV +0.81%, IWD +0.55%) outperformed growth ETFs (VUG +0.54%, IWF +0.19%), indicating that investors may be rotating into more defensive, established names amid market uncertainty.
2. Sector Performance
Winners:
Energy (XLE +3.08%, XOP +3.49%): Energy ETFs surged as oil and gas stocks rallied following geopolitical tensions and supply concerns.
Financials (XLF +1.94%): Financial stocks saw strong performance, likely due to higher interest rate expectations benefiting bank profit margins.
Losers:
Semiconductors & Tech (SMH -0.79%, SOXL -2.63%): Semiconductor stocks struggled, likely due to profit-taking and geopolitical risks affecting chipmakers.
Precious Metals & Miners (SLV -2.25%): Silver and other precious metals ETFs were among the worst performers, suggesting lower demand for safe-haven assets amid stable macroeconomic conditions.
3. Bonds & Fixed Income
Modest Gains Across Treasuries & Corporate Bonds:
Treasuries (TLT +0.59%, IEF +0.57%) and corporate bonds (LQD +0.75%, AGG +0.47%) saw slight positive moves, suggesting continued demand for income assets amid rate uncertainty.
Inflation-Protected Bonds (TIP +0.62%) also gained, indicating some expectations of inflationary pressures persisting.
4. Global Markets
Mixed Performance Across Regions:
China ETFs (FXI -2.92%, ASHR -4.26%, YINN -8.93%) were the biggest losers, reflecting concerns over China's economic slowdown, weak demand, and regulatory pressure.
India (INDA +1.53%) and Brazil (EWZ +2.83%) outperformed, suggesting emerging market strength outside of China.
European ETFs (EZU -0.48%, VGK -0.94%) were slightly lower, potentially due to growth concerns and ECB policy uncertainty.
5. Volatility & Leverage ETFs
Volatility Crushed:
VIX-related ETFs (UVXY -9.37%, VXX -6.66%) plummeted, showing that market fears have subsided, leading to lower demand for hedging instruments.
Leverage ETF Performance:
Bullish leveraged ETFs (TQQQ +0.47%, SPXL +0.45%) were positive, showing investors are still comfortable taking risk.
Inverse ETFs (SPXS -1.54%, SQQQ -0.90%) fell, further confirming that market sentiment was starting to assume a broadly risk-on stance.
Final Takeaways
Market Sentiment: Slightly Bullish with a risk-on bias.
Sector Strength: Energy & Financials led gains, while Tech & Semiconductors lagged.
Treasuries & Bonds: Positive but not aggressively bought, indicating stable rate expectations.
Global Markets: China ETFs were notably weak, while India and Brazil showed resilience.
Volatility Plummeted, indicating investors are not overly concerned about near-term risks.
Global Overview
Foreign ADR stocks listed on NYSE, NASDAQ & AMEX categorized by geographic location. Reviewing a global heatmap like this weekly is valuable for investors because it offers insights into international markets, helping to:
Identify Global Trends: Spot which regions or countries are performing well or underperforming.
Assess Sector and Regional Performance: Understand how industries are faring across different regions.
Diversify Portfolios: Uncover opportunities in emerging or developed markets for greater diversification.
Gauge Global Sentiment: Recognize the impact of macroeconomic events on specific regions.
Align with Global Strategies: Refine investment strategies based on regional strengths or weaknesses.
This overview ensures investors stay informed about global opportunities and risks, complementing their domestic market analysis.
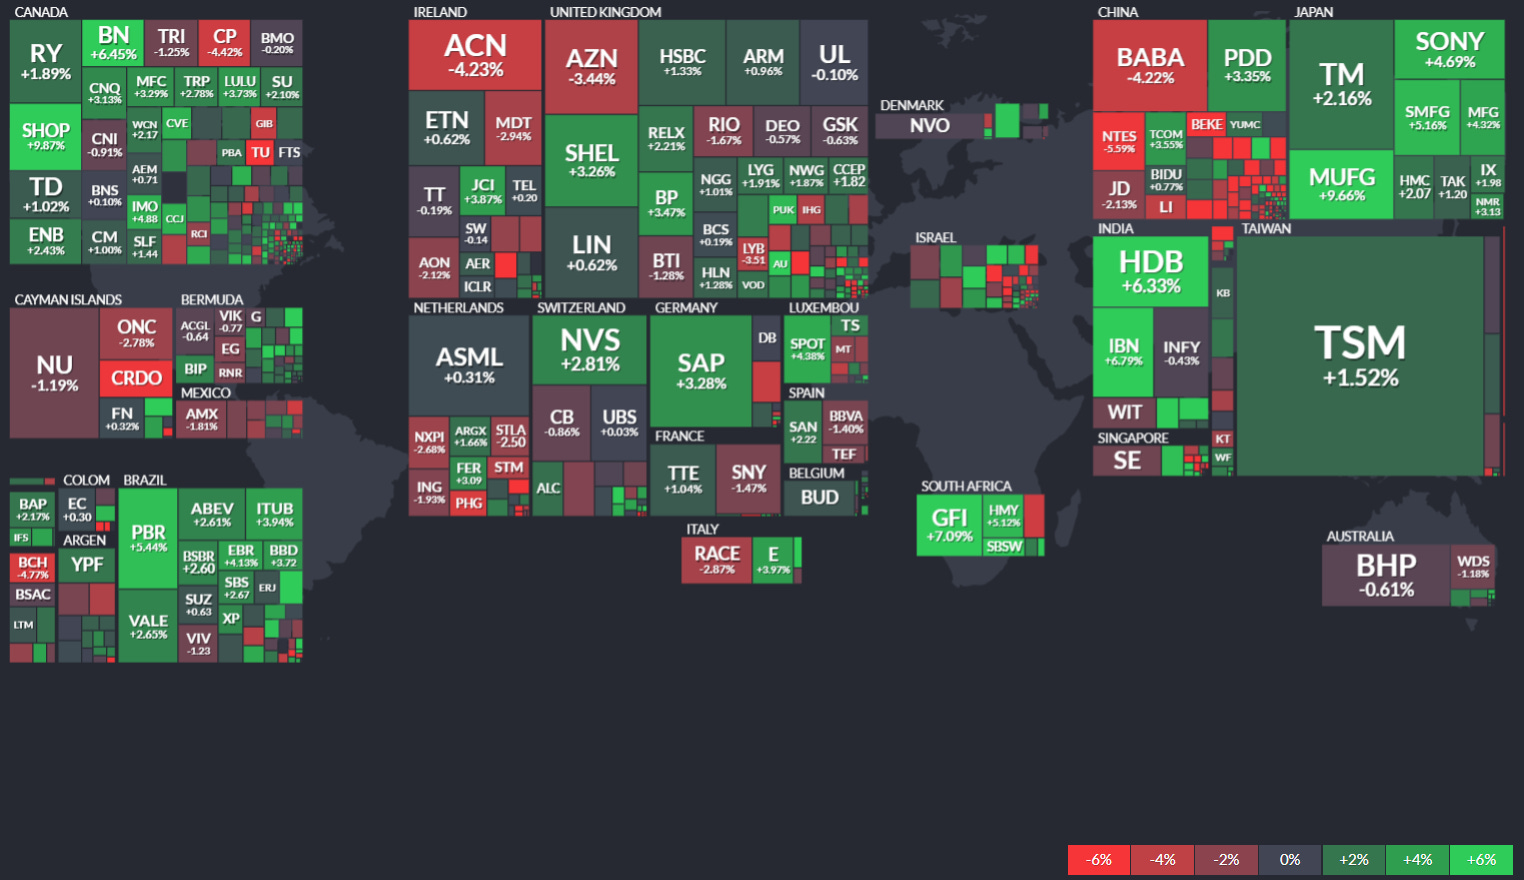
1. North America (Canada)
Positive Performance Overall
Biggest Gainers:
Royal Bank of Canada (RY +1.89%) and Bank of Montreal (BMO +2.06%) benefited from higher banking sector optimism amid rate stability.
Shopify (SHOP +9.87%) surged following strong earnings and improved growth outlook.
Decliners:
Canadian Pacific (CP -4.42%) was hit by weaker-than-expected freight demand.
2. Europe
Mixed Performance Across the Region:
United Kingdom:
Energy Stocks Like Shell (SHEL +3.26%) and BP (BP +3.47%) rallied due to higher oil prices following new U.S. sanctions on Iran and OPEC+ discussions.
Accenture (ACN -4.23%) dropped on a weaker-than-expected revenue forecast.
Germany & France:
SAP (SAP +3.28%) gained following positive AI-driven cloud growth expectations.
Sanofi (SNY -1.47%) fell due to regulatory concerns over drug pricing.
Netherlands & Switzerland:
ASML (ASML +0.31%) held steady despite ongoing concerns over U.S. semiconductor restrictions on China.
3. Asia-Pacific
China Underperformed, Taiwan & Japan Outperformed
China ADRs (Alibaba BABA -4.22%, NetEase NTES -5.59%) fell sharply amid continued regulatory pressure and weaker economic data.
Pinduoduo (PDD +3.35%) was an exception, likely benefiting from continued consumer resilience in lower-tier Chinese cities.
Taiwan Semiconductor (TSM +1.52%) continued higher on robust AI chip demand.
Japan Outperformed:
Mitsubishi UFJ (MUFG +9.66%) and Sony (SONY +4.69%) surged on strong financial sector gains and AI-driven optimism in entertainment.
4. Latin America
Strong Performance in Brazil
Petrobras (PBR +5.44%) and Vale (VALE +2.66%) rose as commodity prices remained resilient.
Bradesco (BBD +4.13%) and other banks also gained due to stable Brazilian central bank rate guidance.
Argentina & Mexico Weaker
Banco Macro (BMA -4.77%) struggled, possibly due to economic instability concerns.
América Móvil (AMX -1.81%) in Mexico slipped as telecom growth in Latin America remained sluggish.
5. Africa & Australia
South African Gold Miners Rallied
Gold Fields (GFI +7.09%) and Harmony Gold (HMY +5.12%) surged as gold prices hit new highs amid economic uncertainty.
Australia Mixed
BHP (BHP -0.61%) saw a slight decline, possibly due to weaker Chinese demand for raw materials.
Final Takeaways:
Winners:
Brazil, Japan, South African gold miners, and Taiwan ADRs performed well.
Shopify and Canadian banks saw strong gains.
Energy stocks (Shell, BP, Petrobras) benefited from rising oil prices.
Losers:
China ADRs struggled significantly due to economic weakness & regulatory issues.
European industrials and U.K. stocks were mixed, with Accenture leading losses.
Argentina & Mexican financials also saw declines.

🔥 BIG MONEY MOVES: Insider Look at This Week's Top Institutional Trades
Smart Money's Latest Positions Revealed
Our exclusive institutional trading data has just been updated with thousands of new datapoints…the most significant trades this week represent over $334 billion in capital movement. These aren't retail trades—these are the calculated positions of the world's most sophisticated investors expressing their market thesis through substantial capital deployment, both long and short.
💰 The Mega Moves: Billions in Motion
DoorDash ( DASH 0.00%↑ ) registered a staggering $7.36 billion institutional position with a #1 rank—the single largest high-conviction trade in our dataset from this week. This massive capital commitment comes as DASH is slated to be one of several new tickers joining the S&P 500.
Healthcare Giants Under Scrutiny: Merck ( MRK 0.00%↑ ) and Pfizer ( PFE 0.00%↑ ) saw massive #1 ranked institutional positions worth $4.29 billion and $3.85 billion respectively, signaling major institutional players taking significant positions ahead of pipeline developments and drug pricing policy shifts.
Energy Sector Polarization: ConocoPhillips ( COP 0.00%↑ ) and Expro Group ( EXE 0.00%↑ ) both received top-ranked institutional positions exceeding $2.9 billion each, reflecting strong opposing views on energy market dynamics and fossil fuel demand forecasts.
🚀 Industry Positioning: Where Smart Money Is Taking Sides
Institutional capital is making significant moves across sectors, revealing major investment battlegrounds where bulls and bears are placing substantial bets:
Pharma's High-Stakes Game: Pharmaceutical trading saw an extraordinary $18.1 billion across just 21 trades, averaging $859.6 million per position—the highest concentration in the dataset. Merck and Pfizer's #1 ranked multi-billion-dollar positions suggest institutions taking definitive stances on upcoming pipeline catalysts.
Food Industry's Divergent Viewpoints: The Food Products industry showed exceptional institutional activity with 22.58% of its trades having top rank status and over $8.3 billion in capital flow. This concentrated positioning suggests smart money taking strong positions—both long and short—amid inflation concerns and changing consumer behaviors.
Banking Sector's Contested Future: The banking industry saw 119 institutional trades worth $15.1 billion with 14 top-ranked positions, including USB's massive $2.15 billion #1 ranked trade. This battleground reflects divergent views on interest rates, regulatory changes, and financial sector health.
Semiconductor Stakes Intensify: The semiconductor industry led all sectors with $22.1 billion in institutional positioning across 47 trades, reflecting major bets on both sides regarding AI expansion, computing infrastructure, and chip demand cycles.
📊 Sector Intelligence: Following the Money Flow
Technology Capital Concentration: The tech sector attracted a commanding $70.2 billion in institutional positioning—59% more than any other sector—with semiconductor stocks leading at $22.1 billion. NVIDIA ($4.5B) and Broadcom ($6.3B across multiple trades) show particularly strong institutional interest, representing significant conviction on both sides of the AI and chip demand debate.
Financial Services Division Lines: Financial institutions were the focus of $44.1 billion in institutional capital with 29 top-ranked trades, revealing sharp disagreement on sector prospects amid changing interest rate expectations and regulatory environments.
Consumer Discretionary Battleground: Despite broader retail concerns, this sector saw $36.3 billion in institutional positioning, highlighted by Williams-Sonoma's massive position and Target's (TGT) $2 billion #1 ranked trade. These trades reflect opposing institutional views on consumer spending resilience and retail winners versus losers.
💎 Hidden Gems: Top-Ranked Smaller Positions
While mega-cap positions dominate headlines, these smaller top-ranked trades may signal institutional conviction worth noting:
Playa Hotels & Resorts ( PLYA 0.00%↑ ): This hospitality player attracted a #1 ranked $94.5 million institutional position, potentially signaling a decisive stance on travel sector prospects—bullish anticipation of continued recovery or bearish concerns about overvaluation.
Sony Group ( SONY 0.00%↑ ): The Japanese tech giant saw a #1 ranked $85.8 million trade alongside 7 total institutional positions, reflecting institutional opinions on its gaming, entertainment, and technology segments amid shifting competitive landscapes.
Buckle ( BKE 0.00%↑ ): This specialty retailer drew a #1 ranked $82.9 million position despite broader retail sector challenges, suggesting a strong institutional perspective on its differentiated business model and valuation.
Select Energy Services ( WTTR 0.00%↑ ): This energy services provider received a #1 ranked $83.8 million position, representing institutional conviction regarding the outlook for North American oil and gas field services.
🧠 The Bottom Line
Institutional money is making decisive and concentrated moves that signals strong convictions across sectors. A remarkable 1,681 of highly ranked institutional trades worth over $304 billion occurred on March 21st alone—suggesting portfolio managers are aggressively taking positions ahead of anticipated market developments.
This unusual concentration of activity indicates sophisticated investors with strong opinions about upcoming catalysts. By understanding where and how institutions are positioning capital—both long and short—investors can identify sectors and stocks likely to experience significant price action in the coming weeks.

US Investor Sentiment
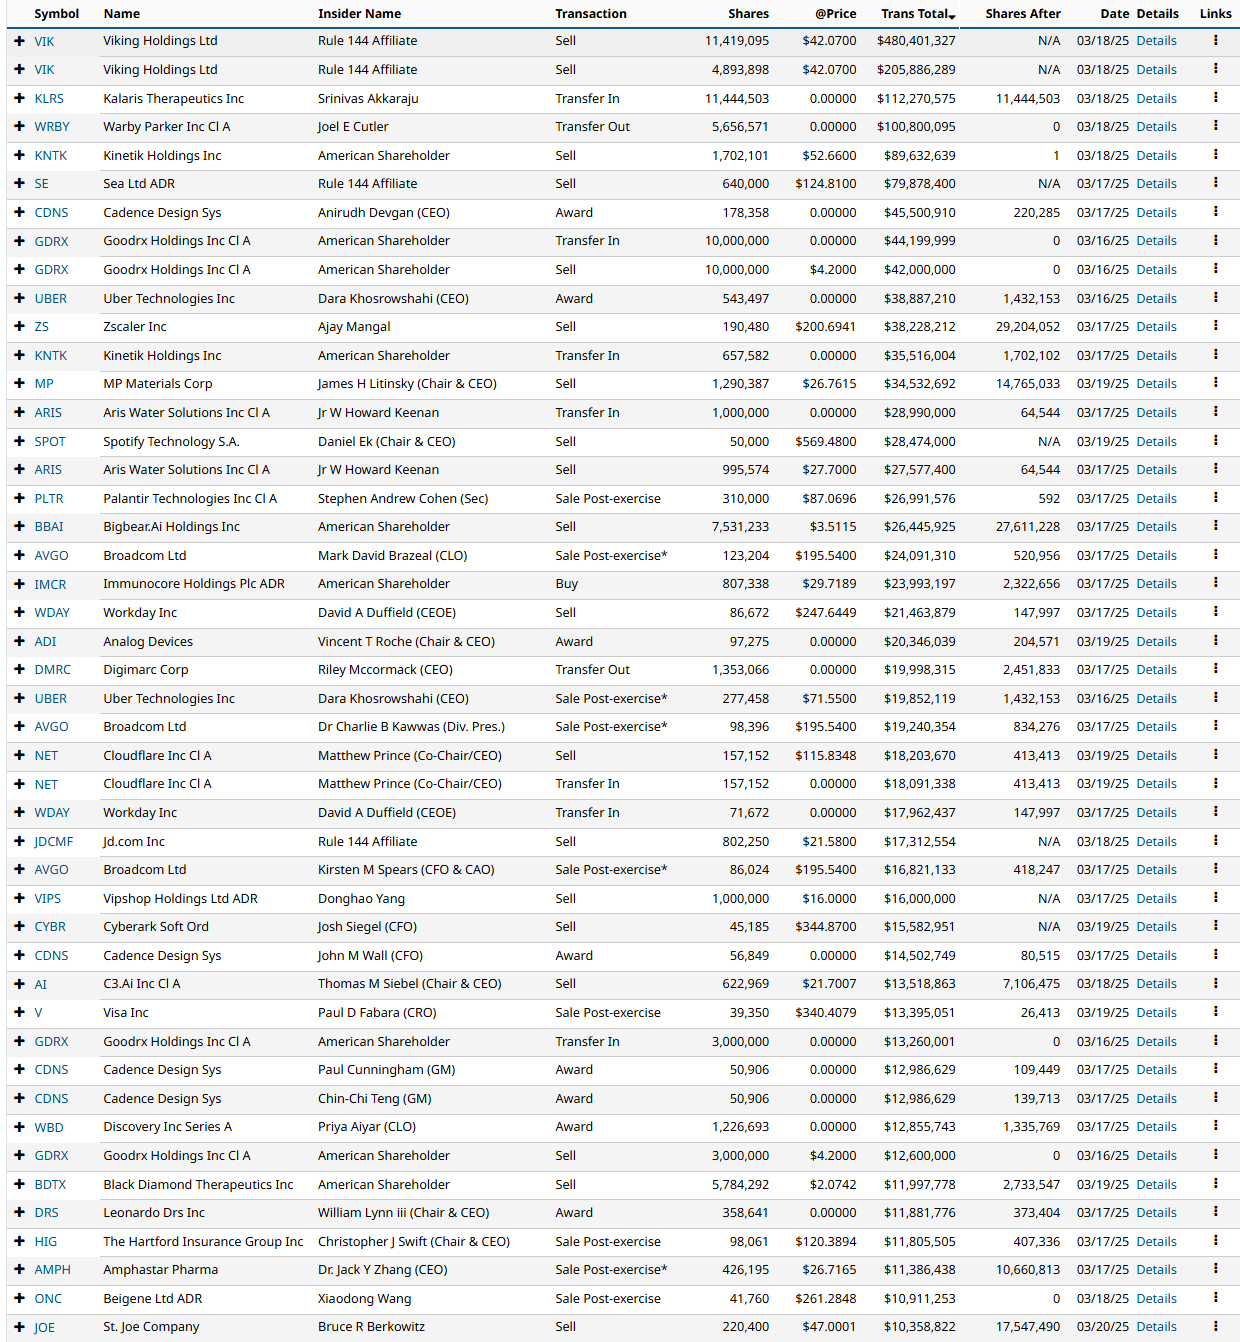
Insider Trading
Insider trading occurs when a company’s leaders or major shareholders trade stock based on non-public information. Tracking these trades can reveal insider expectations about the company’s future. For example, large purchases before an earnings report or drug trial results might indicate confidence in upcoming good news.
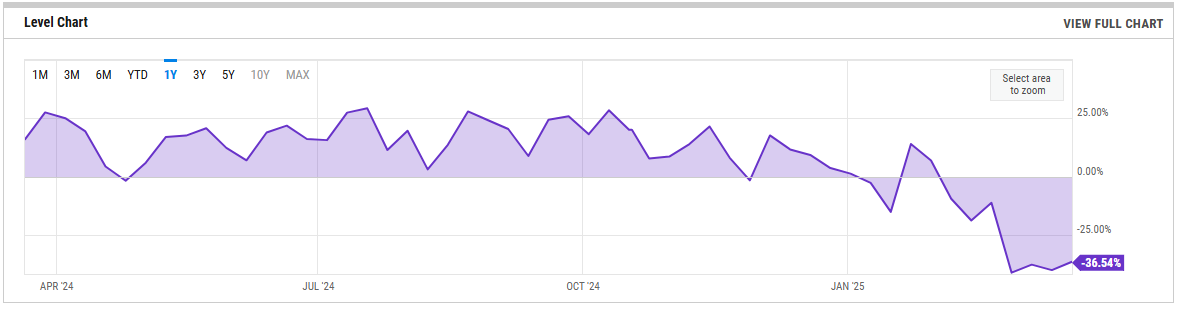
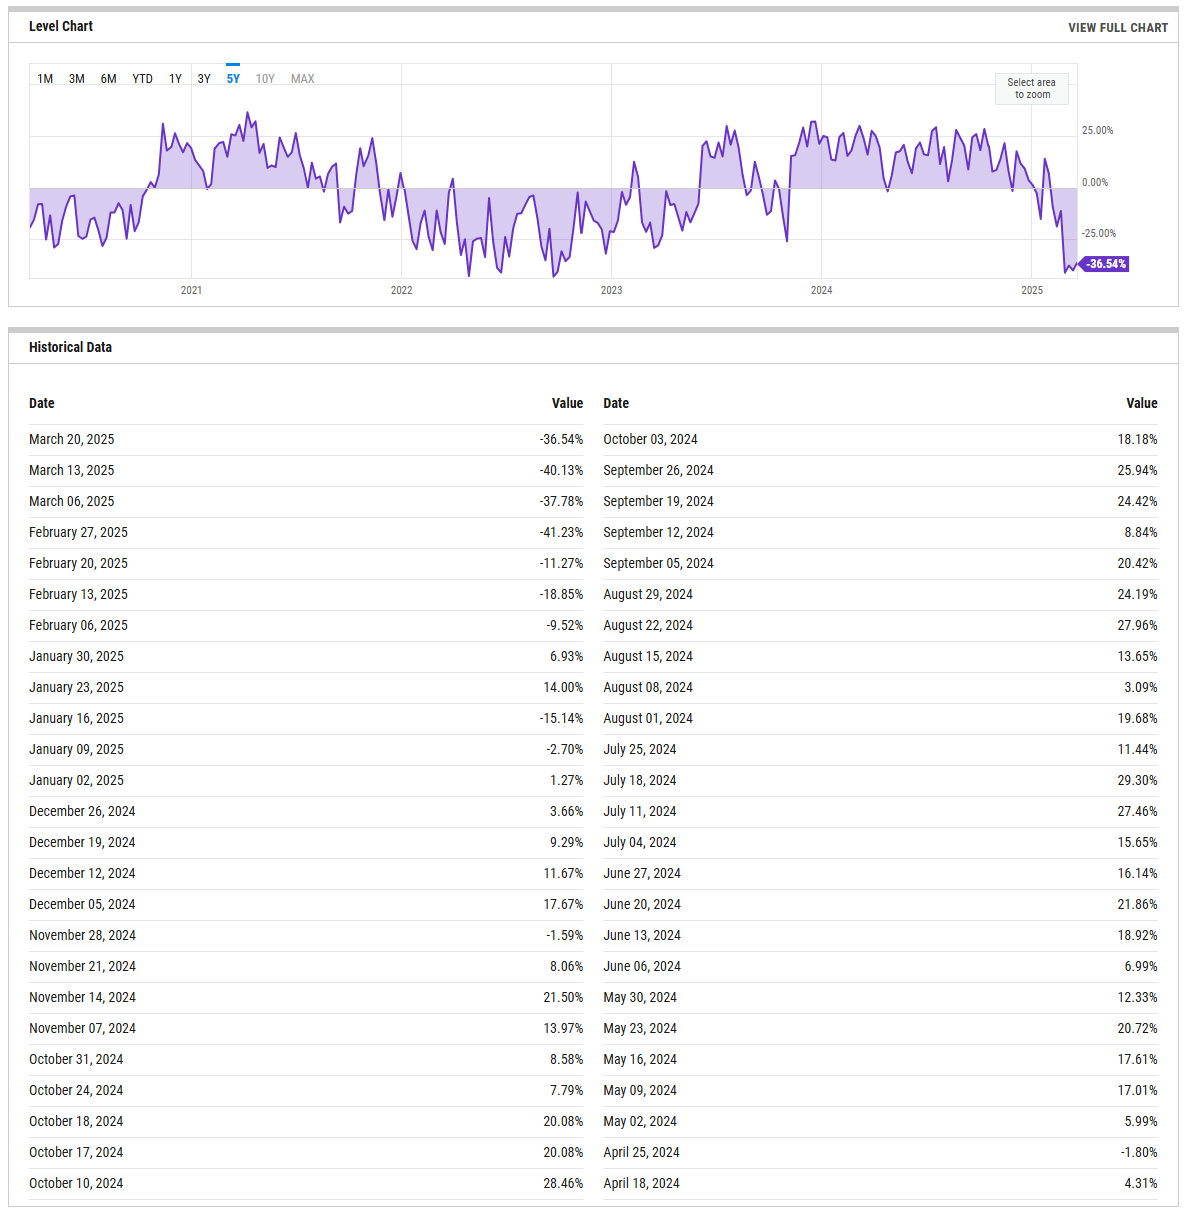
%Bull-Bear Spread
The %Bull-Bear Spread chart is a sentiment indicator that shows the difference between the percentage of bullish and bearish investors, often derived from surveys or sentiment data, such as the AAII (American Association of Individual Investors) sentiment survey. This spread tells investors about the prevailing mood in the market and can provide insights into market extremes and potential turning points.
Bullish or Bearish Sentiment:
When the spread is positive, it means more investors are bullish than bearish, indicating optimism about the market’s direction.
A negative spread indicates more bearish sentiment, meaning more investors expect the market to decline.
Contrarian Indicator:
The %Bull-Bear Spread is often used as a contrarian indicator. For example, extremely high levels of bullish sentiment might suggest that the market is overly optimistic and could be due for a correction.
Similarly, when bearish sentiment is extremely high, it might indicate that the market is overly pessimistic, and a rally could be on the horizon.
Market Extremes and Reversals:
Historically, extreme values of the spread (both positive and negative) can signal turning points in the market. A very high positive spread can signal market exuberance, while a very low or negative spread may indicate fear or capitulation.
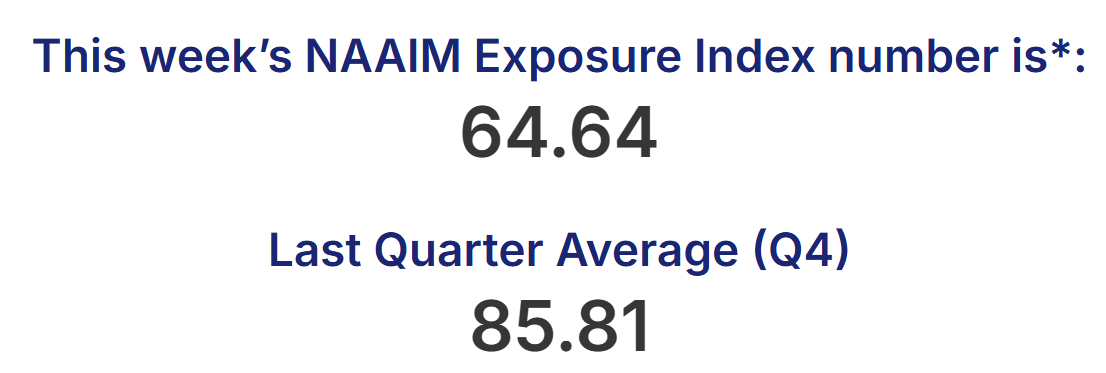
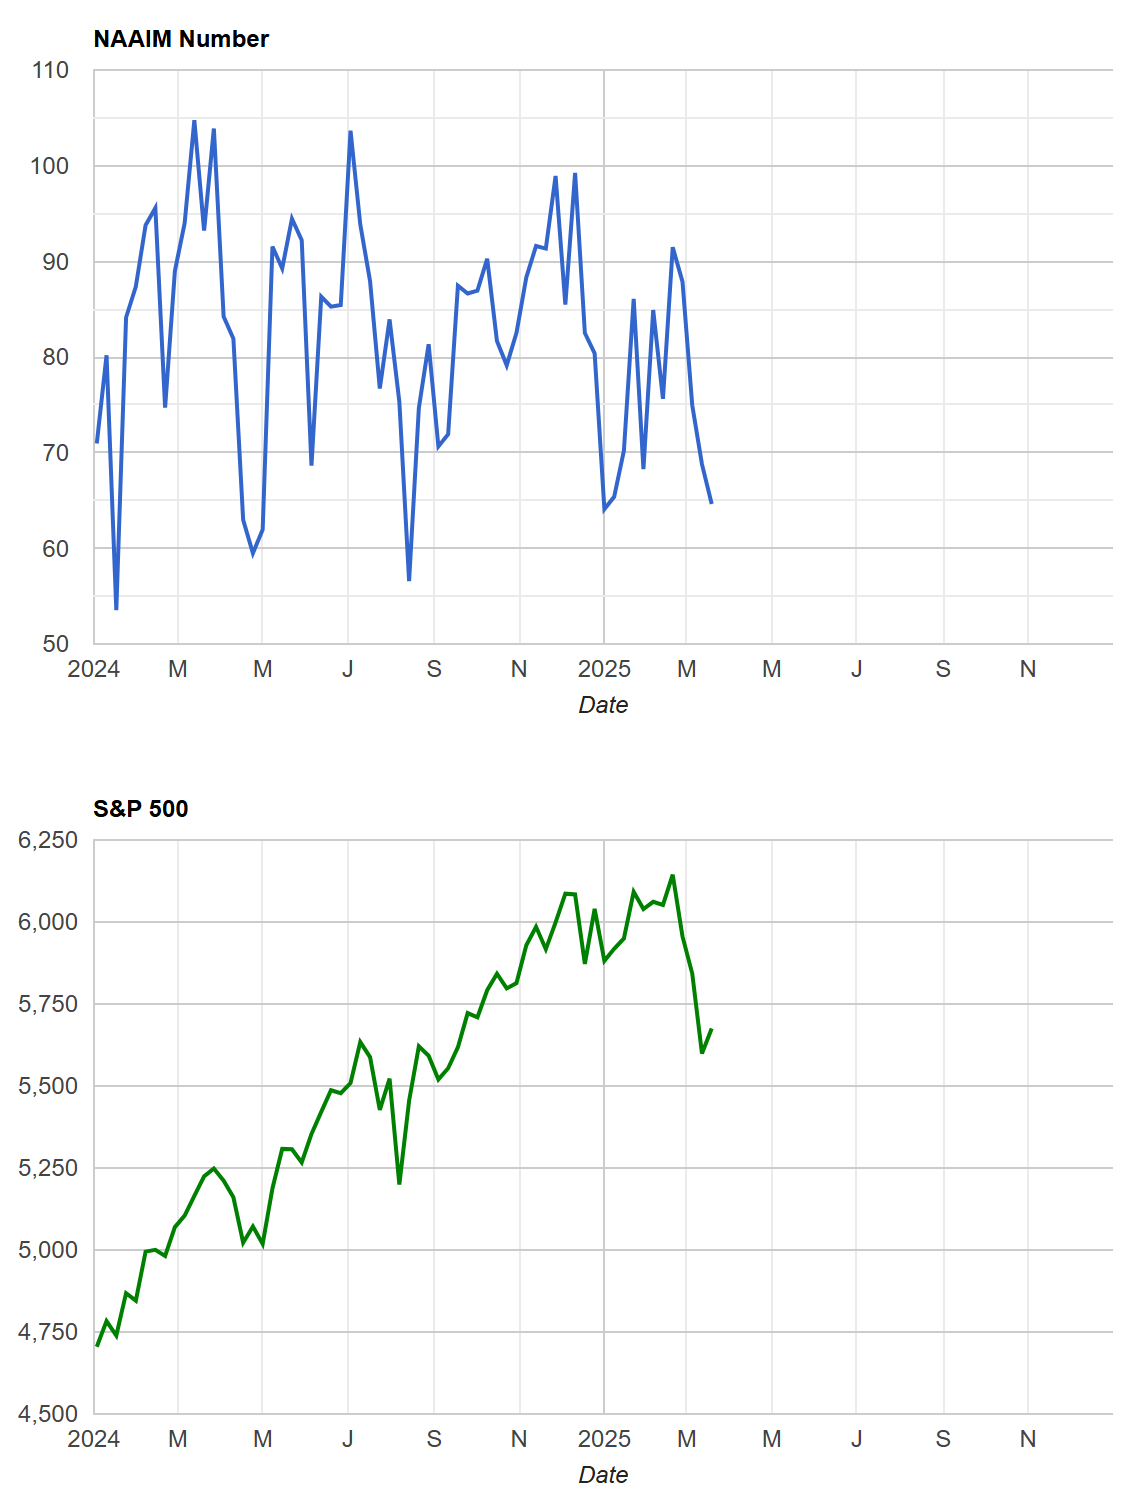
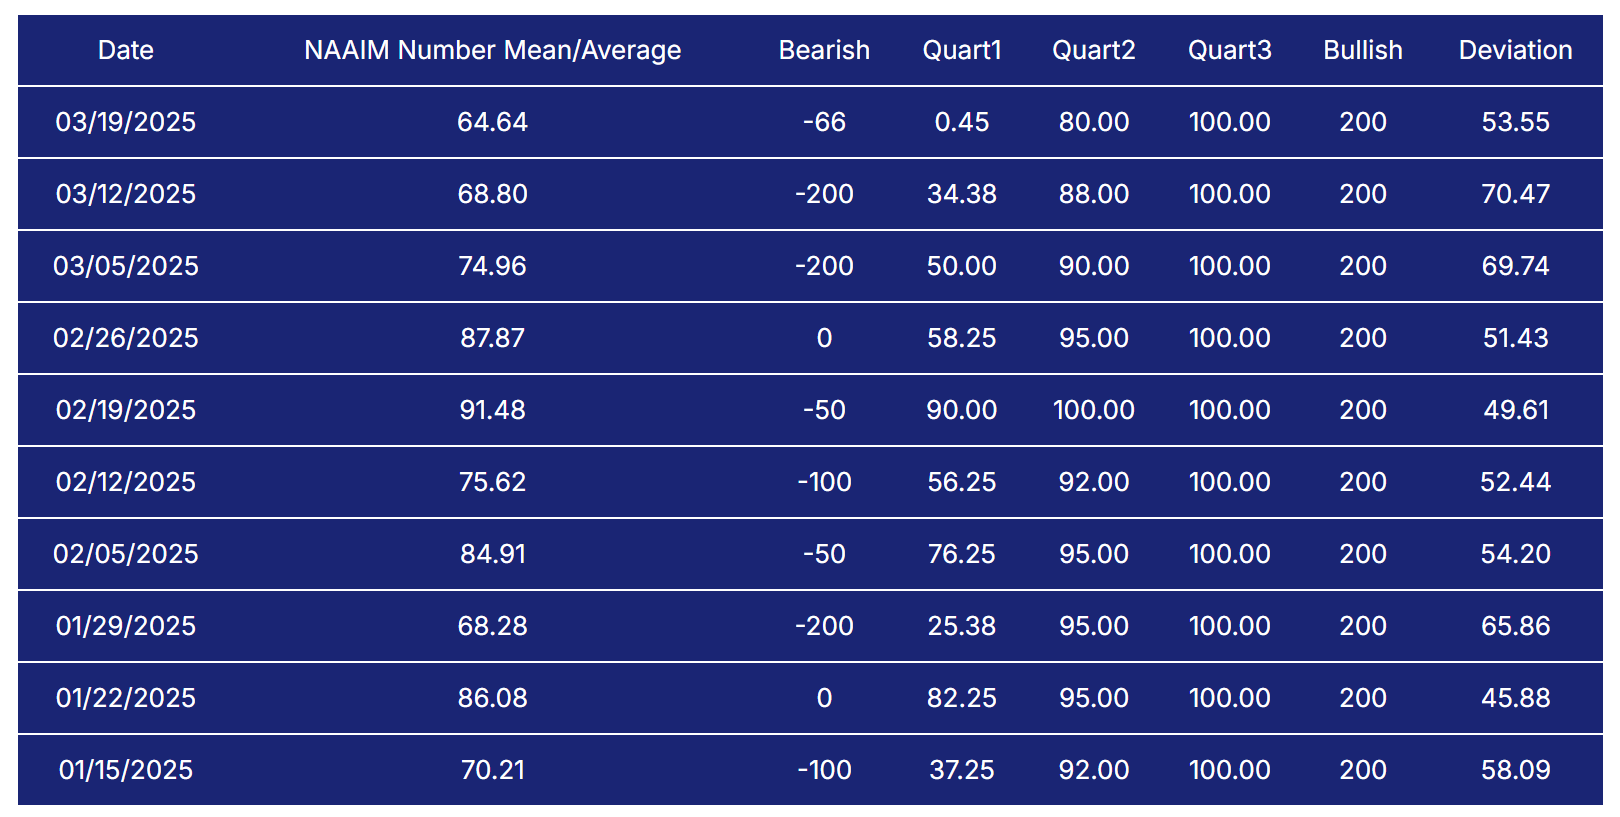
NAAIM Exposure Index
The NAAIM Exposure Index (National Association of Active Investment Managers Exposure Index) measures the average exposure to U.S. equity markets as reported by its member firms. These are typically active money managers who provide their equity exposure levels weekly. The index offers insight into how much these managers are investing in equities at any given time, ranging from being fully short (-100%) to leveraged long (up to +200%).
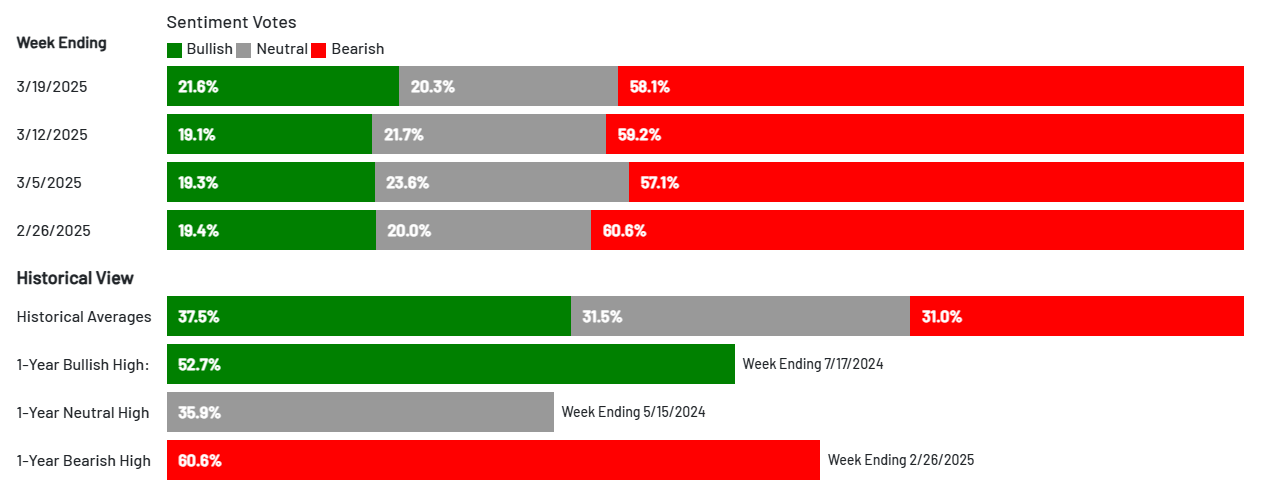
AAII Investor Sentiment Survey
The AAII Investor Sentiment Survey is a weekly survey conducted by the American Association of Individual Investors (AAII) to gauge the mood of individual investors regarding the direction of the stock market over the next six months. It provides insights into whether investors are feeling bullish (expecting the market to rise), bearish (expecting the market to fall), or neutral (expecting the market to stay about the same).
Key Points:
Bullish Sentiment: Reflects the percentage of investors who believe the stock market will rise in the next six months.
Bearish Sentiment: Represents those who expect a decline.
Neutral Sentiment: Reflects investors who anticipate little to no market movement.
The survey is widely followed as a contrarian indicator, meaning that extreme levels of bullishness or bearishness can sometimes signal market turning points. For example, when a large number of investors are overly optimistic (high bullish sentiment), it could suggest a market top, while excessive pessimism (high bearish sentiment) may indicate a market bottom is near.
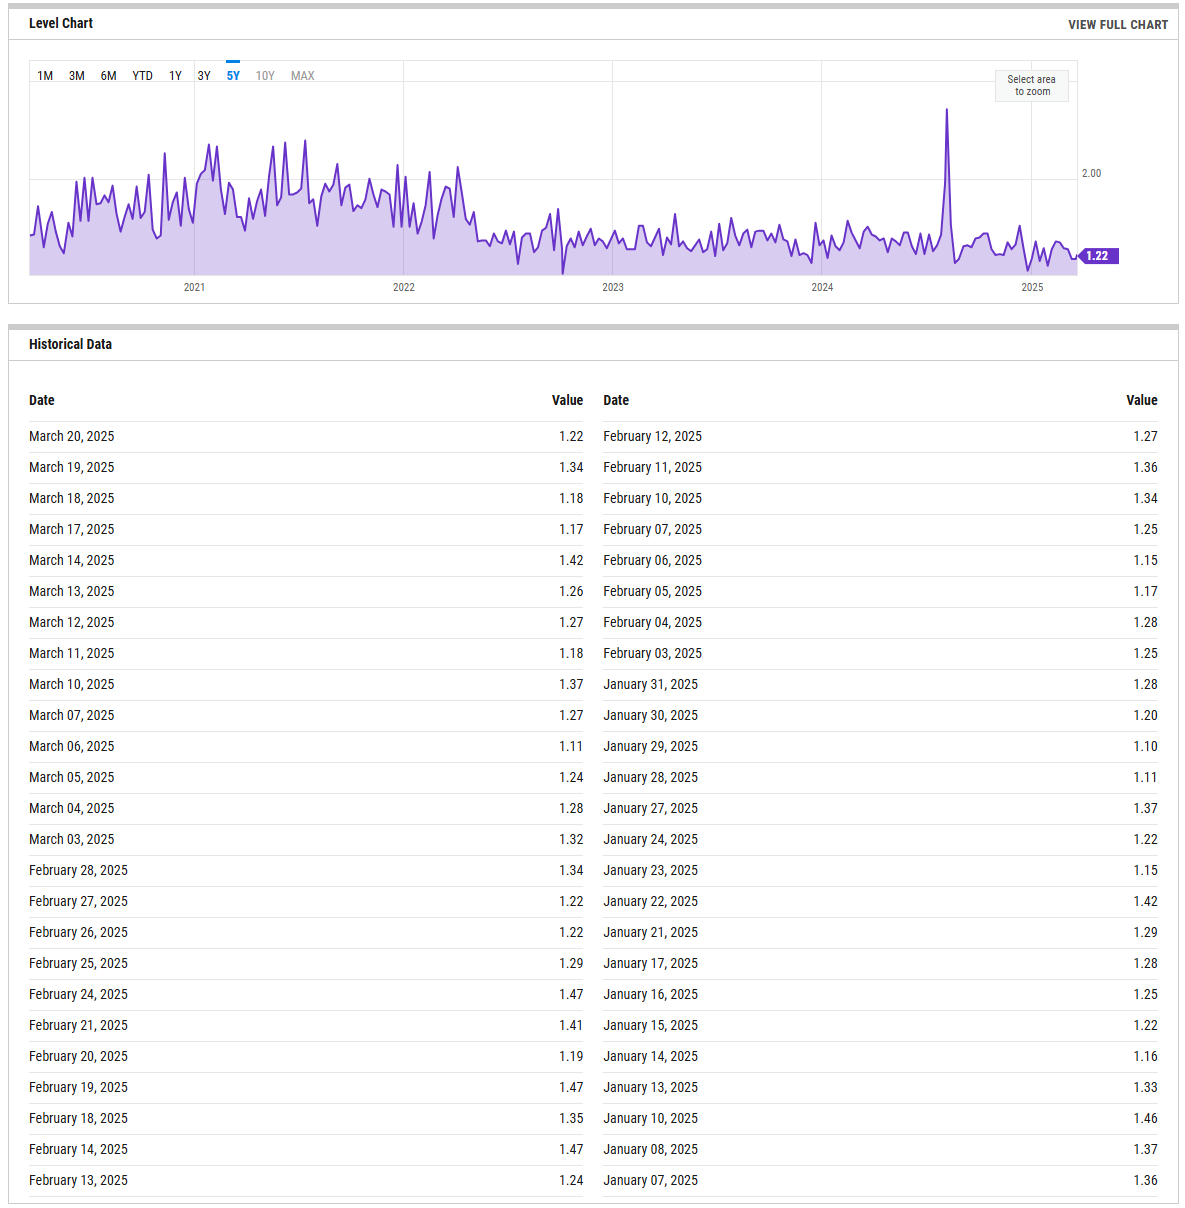
SPX Put/Call Ratio
The SPX Put/Call Ratio is an indicator that is used to gauge market sentiment. This is calculated as the ratio between trading S&P 500 put options and S&P call options. A high put/call ratio can indicate fear in the markets, while a low ratio indicates confidence. For example, in 2015, the Put-Call ratio was as high as 3.77 because of market fears stemming from various global economic issues like a GDP growth slowdown in China and a Greek debt default.
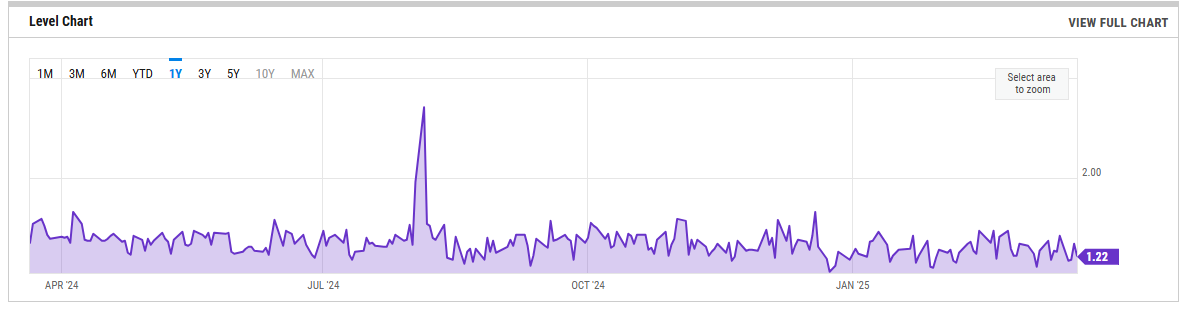
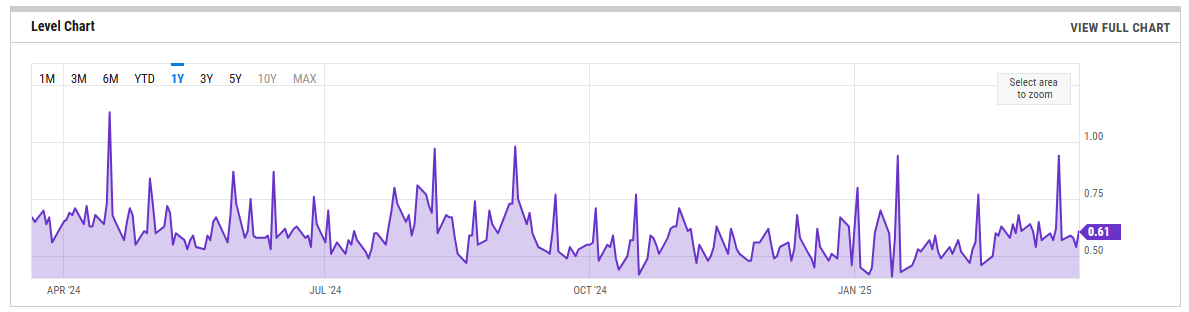
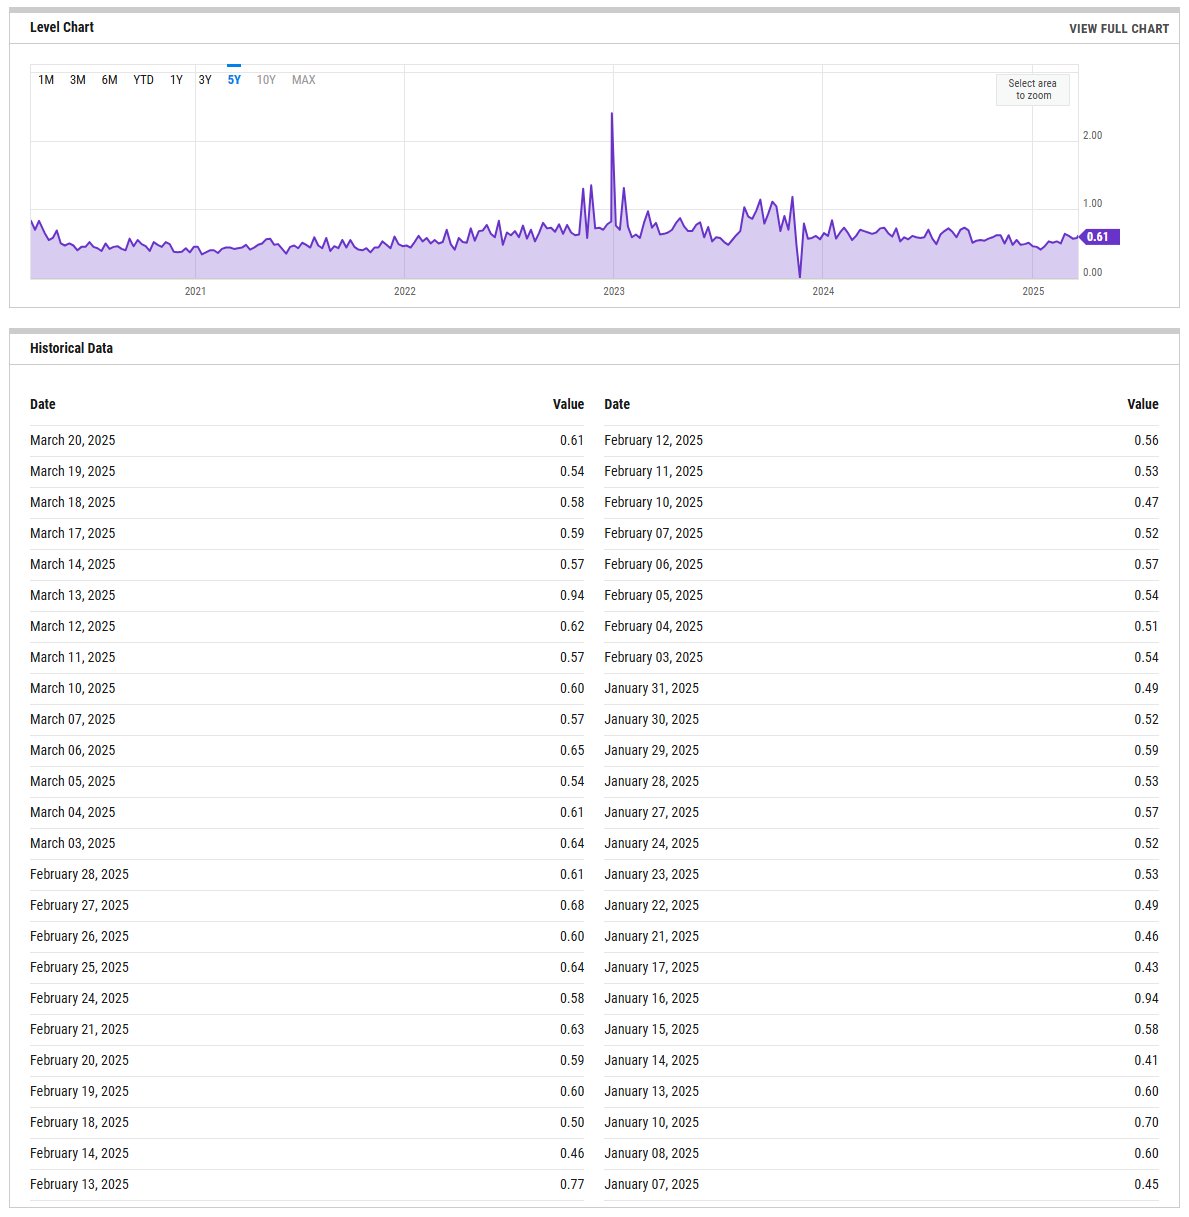
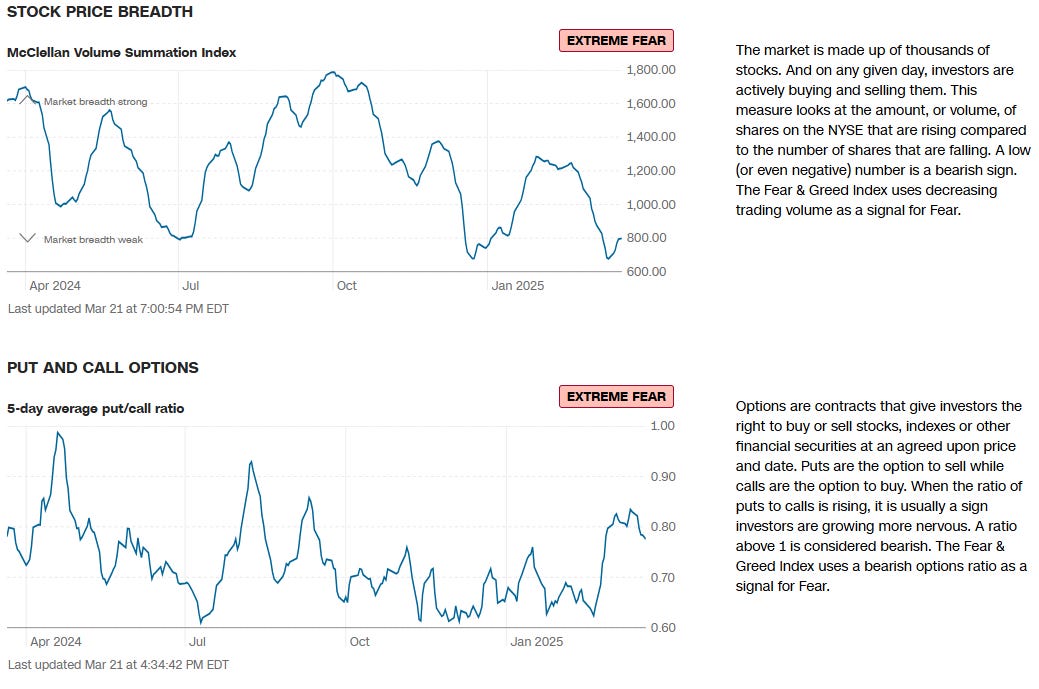
CBOE Equity Put/Call Ratio
The CBOE (Chicago Board Options Exchange) equity put/call ratio is a sentiment indicator used by traders and analysts to gauge market sentiment and potential shifts in investor behavior. It is calculated by dividing the volume of put options by the volume of call options on equities. Here’s what it reveals and how it is generally interpreted:
High Put/Call Ratio: When the put/call ratio is high (above 1.0), it suggests that there is more demand for put options than call options. This typically reflects a more bearish sentiment, as investors may be hedging against potential declines or expecting the market to fall.
Low Put/Call Ratio: Conversely, a low put/call ratio (below 0.7) indicates a higher volume of call options compared to puts, reflecting bullish sentiment. Investors may be expecting upward momentum and are positioning themselves to profit from price gains
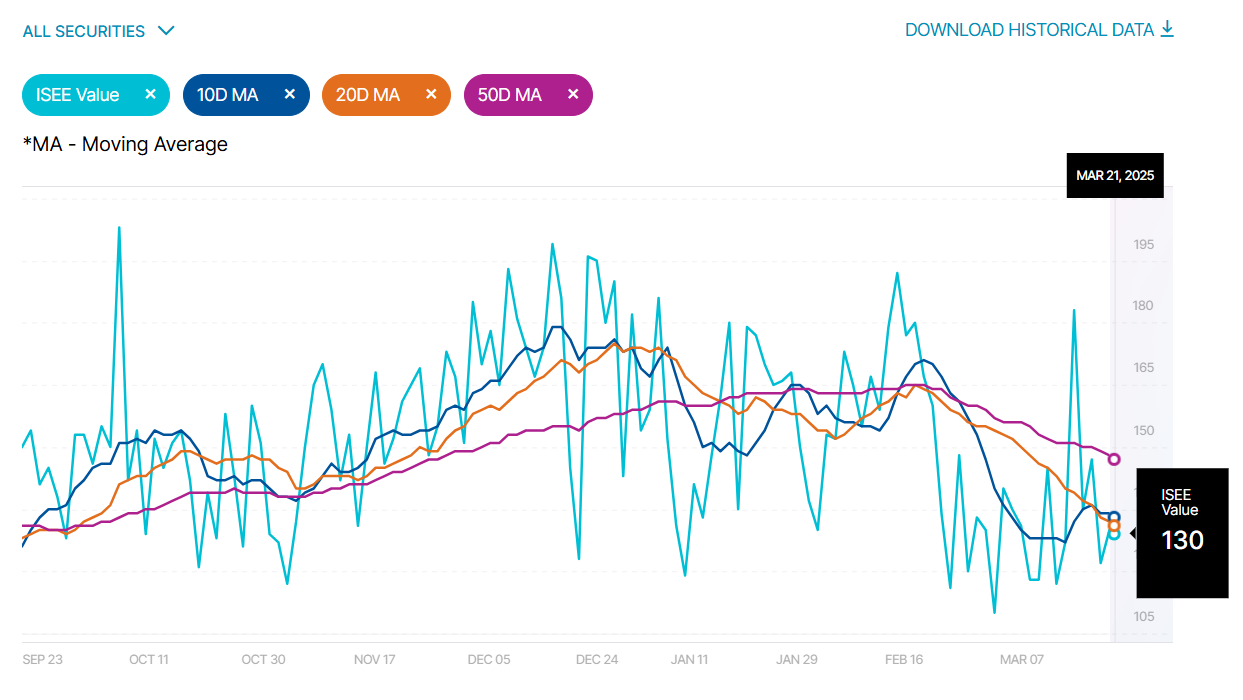
ISEE Sentiment Index
The ISEE (International Securities Exchange Sentiment) Index is a measure of investor sentiment derived from options trading. Unlike traditional put/call ratios, the ISEE Index focuses only on opening long customer transactions and is adjusted to remove market-maker and firm trades, providing a purer sentiment reading.
The ISEE Index typically ranges from 0 to 200, with readings above 100 indicating more call options being bought relative to put options, suggesting bullish sentiment. Conversely, readings below 100 suggest bearish sentiment, with more puts being purchased relative to calls.
New Highs - New Lows
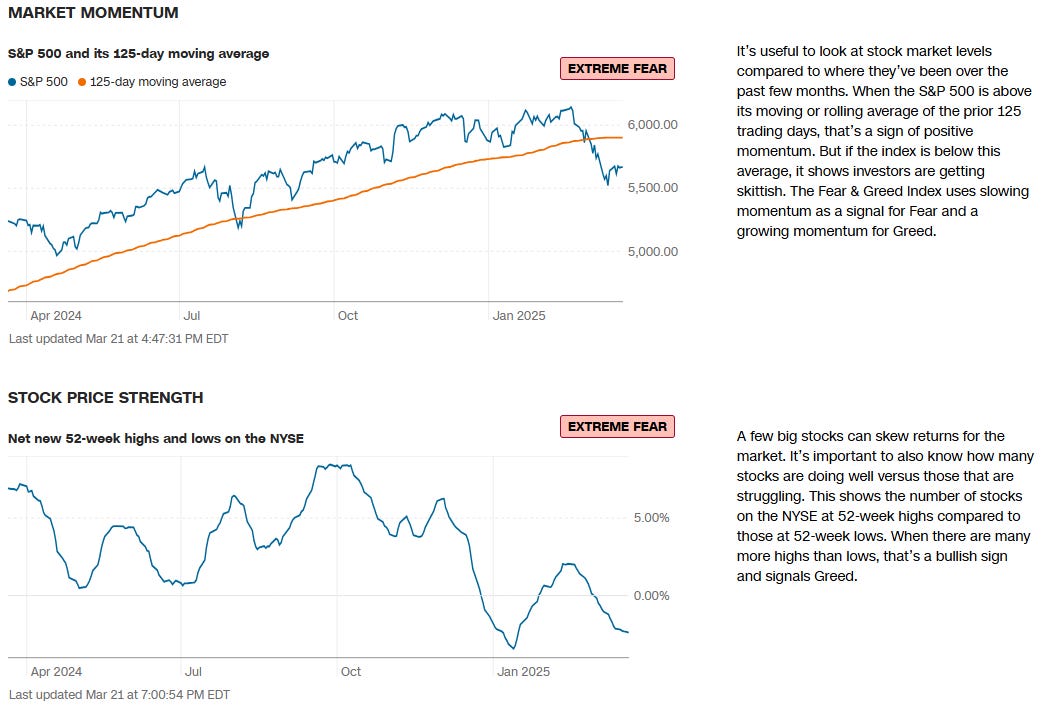
The New Highs - New Lows indicator (NH-NL) displays the daily difference between the number of stocks reaching new 52-week highs and the number of stocks reaching new 52-week lows. The NH-NL indicator generally reaches its extreme lows slightly before a major market bottom. As the market then turns up from the major bottom, the indicator jumps up rapidly. During this period, many new stocks are making new highs because it's easy to make a new high when prices have been depressed for a long time. The NH-NL indicator oscillates around zero. If the indicator is positive, the bulls are in control. If it is negative, the bears are in control. As the cycle matures, a divergence often occurs as fewer and fewer stocks are making new highs (the indicator falls), yet the market indices continue to reach new highs. This is a classic bearish divergence that indicates that the current upward trend is weak and may reverse.
ARMS Index
The Arms Index, also known as the TRIN (Short-Term TRading INdex), was developed by Richard Arms in the 1960s. It is calculated by dividing the ratio of advancing stocks to declining stocks by the ratio of advancing volume to declining volume. Interpreting the Arms Index involves looking at its value in relation to certain thresholds. A value below "1" is considered bullish, indicating that advancing stocks and volume dominate the market. Conversely, a value above "1" is considered bearish, suggesting that declining stocks and volume are more prevalent. Extremely low values (below 0.5) or high values (above 2) are often seen as potential reversal signals.
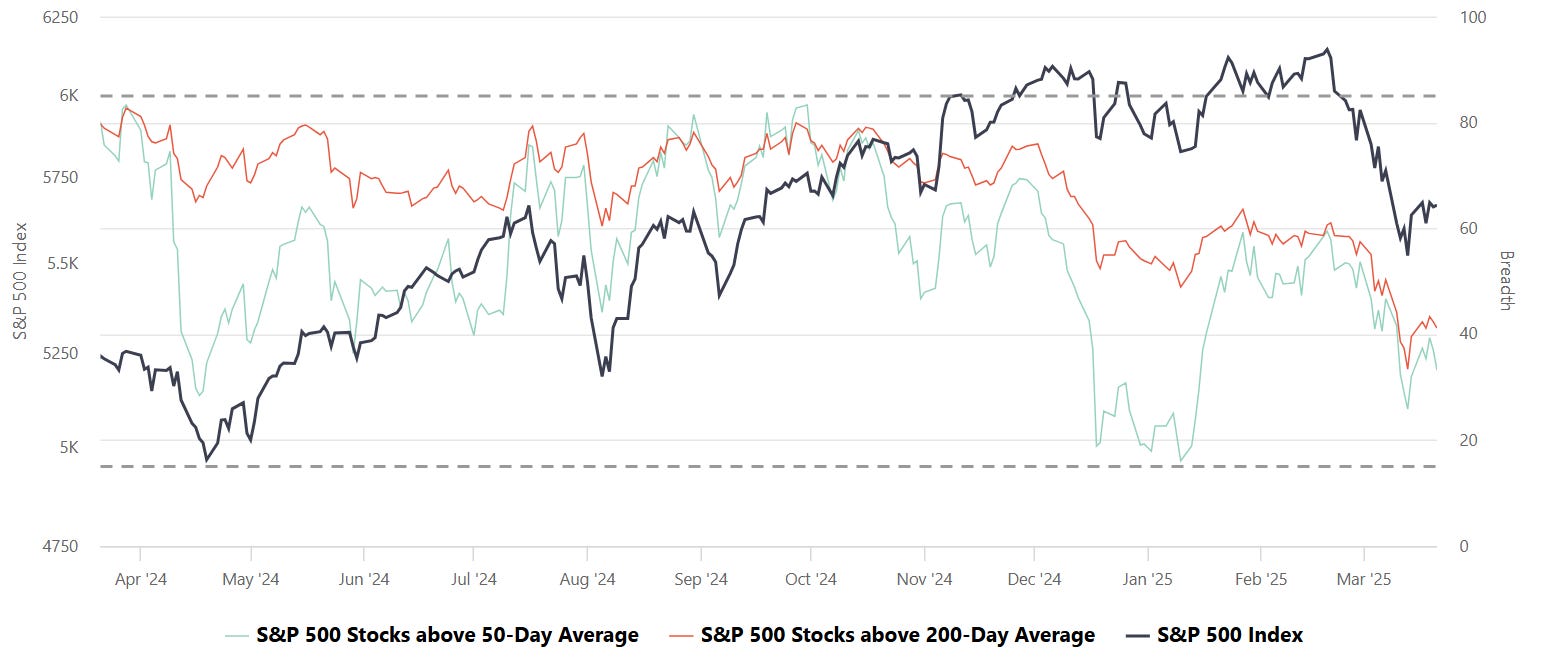
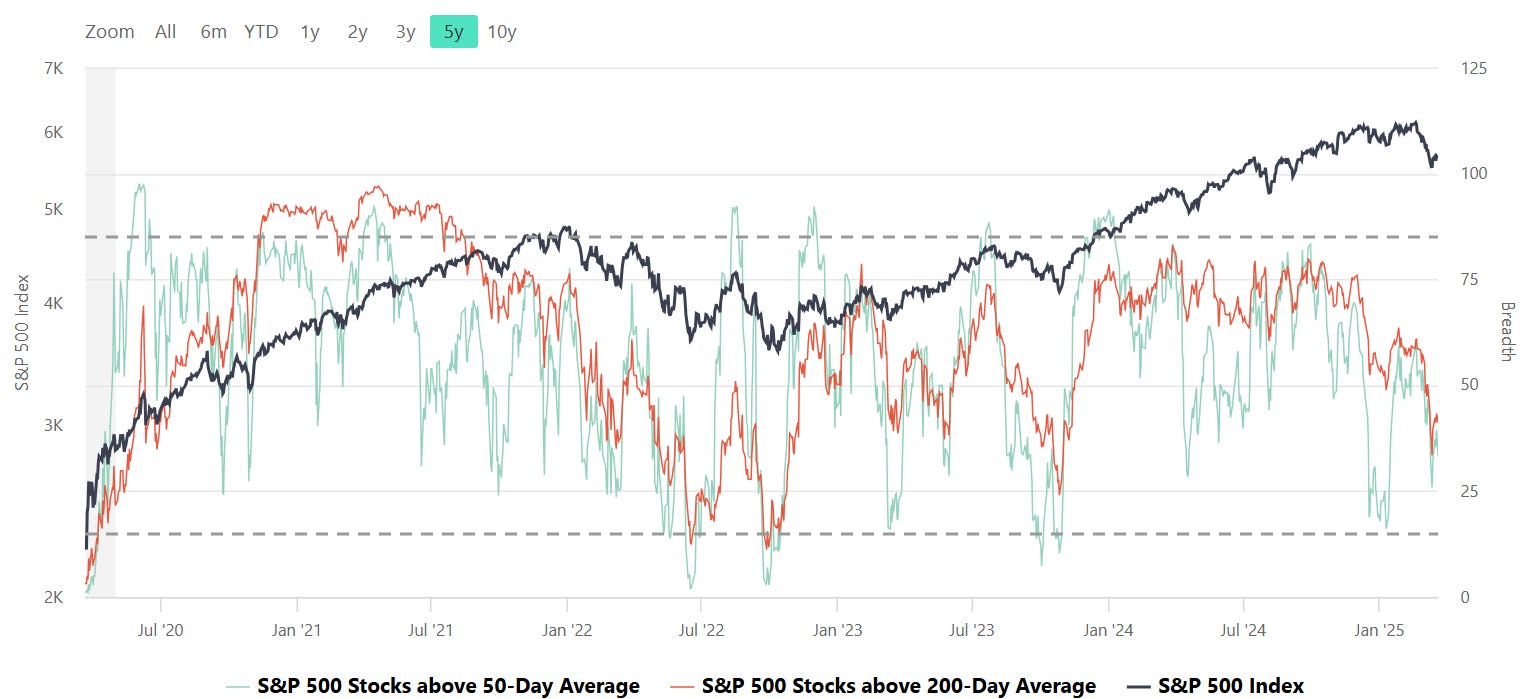
S&P Breadth
Breadth, in the context of stock market analysis, refers to the measure of how many stocks in a given index (such as the S&P 500) are participating in a trend, such as advancing or declining relative to a certain moving average (e.g., 50-day or 200-day).
Market Strength Assessment:
Breadth provides insight into whether a market rally or decline is broad-based or driven by only a few large-cap stocks. A rally supported by a high percentage of stocks above their 50-day or 200-day averages is generally considered healthier and more sustainable.
Early Warning Signals:
Divergences between breadth indicators and the index price can signal potential reversals. For example:
If the index is rising, but the number of stocks above their moving averages is declining, it may indicate weakening underlying strength and potential for a pullback.
Conversely, if breadth improves while the index remains flat or declines, it may suggest accumulating strength for a future rally.
Trend Confirmation:
Breadth indicators can confirm trends. For instance, a strong majority of stocks above their moving averages signals robust market momentum, providing confidence in the prevailing trend.
Identifying Overbought or Oversold Conditions:
Extremely high or low breadth readings can signal overbought or oversold conditions, which might lead to mean reversion. For example:
If nearly all stocks are above their 50-day or 200-day averages, it may suggest overbought conditions.
Conversely, extremely low levels indicate oversold conditions and potential for a bounce.
Breadth and Timing Investments:
Entry Points:
When breadth improves (e.g., more stocks move above their 50-day or 200-day moving averages) after a market pullback, it can indicate a good time to start building positions as the broader market is regaining strength.
Exit Points:
Breadth deterioration during a rally may suggest it’s time to reduce exposure, especially if only a small number of stocks are driving index gains. This is often a warning sign of an impending correction.
Volatility and Risk Management:
Weak breadth in volatile markets may prompt caution or defensive positioning. Conversely, improving breadth can justify taking on more risk during uptrends.
CME Fedwatch
What is the likelihood that the Fed will change the Federal target rate at upcoming FOMC meetings, according to interest rate traders? Use CME FedWatch to track the probabilities of changes to the Fed rate, as implied by 30-Day Fed Funds futures prices.
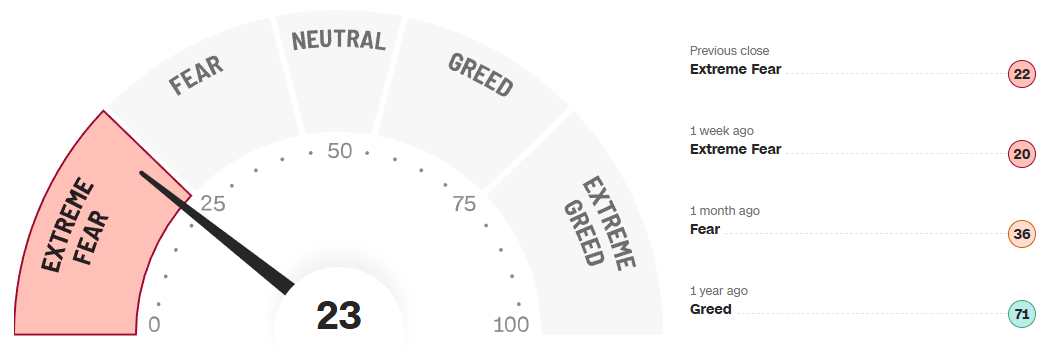
CNN Fear & Greed Constituent Data Points & Composite Index

Institutional S/R Levels for Major Indices
When you’re a large institutional player, your primary goal is to find liquidity - places to do a ton of business with the least amount of slippage possible. VolumeLeaders.com automatically identifies and visually plots the exact spots where institutions are doing business and where they are likely to return for more. It’s one of the primary reasons “support” and “resistance” concepts work and truly one of the reasons “price has memory”.
Levels from the VolumeLeaders.com platform can help you formulate trades theses about:
Where to add or take profit
Where to de-risk or hedge
What strikes to target for options
Where to expect support or resistance
And this is just a small sample; there are countless ways to leverage this information into trades that express your views on the market. The platform covers thousands of tickers on multiple timeframes to accommodate all types of traders.
SPY 0.00%↑
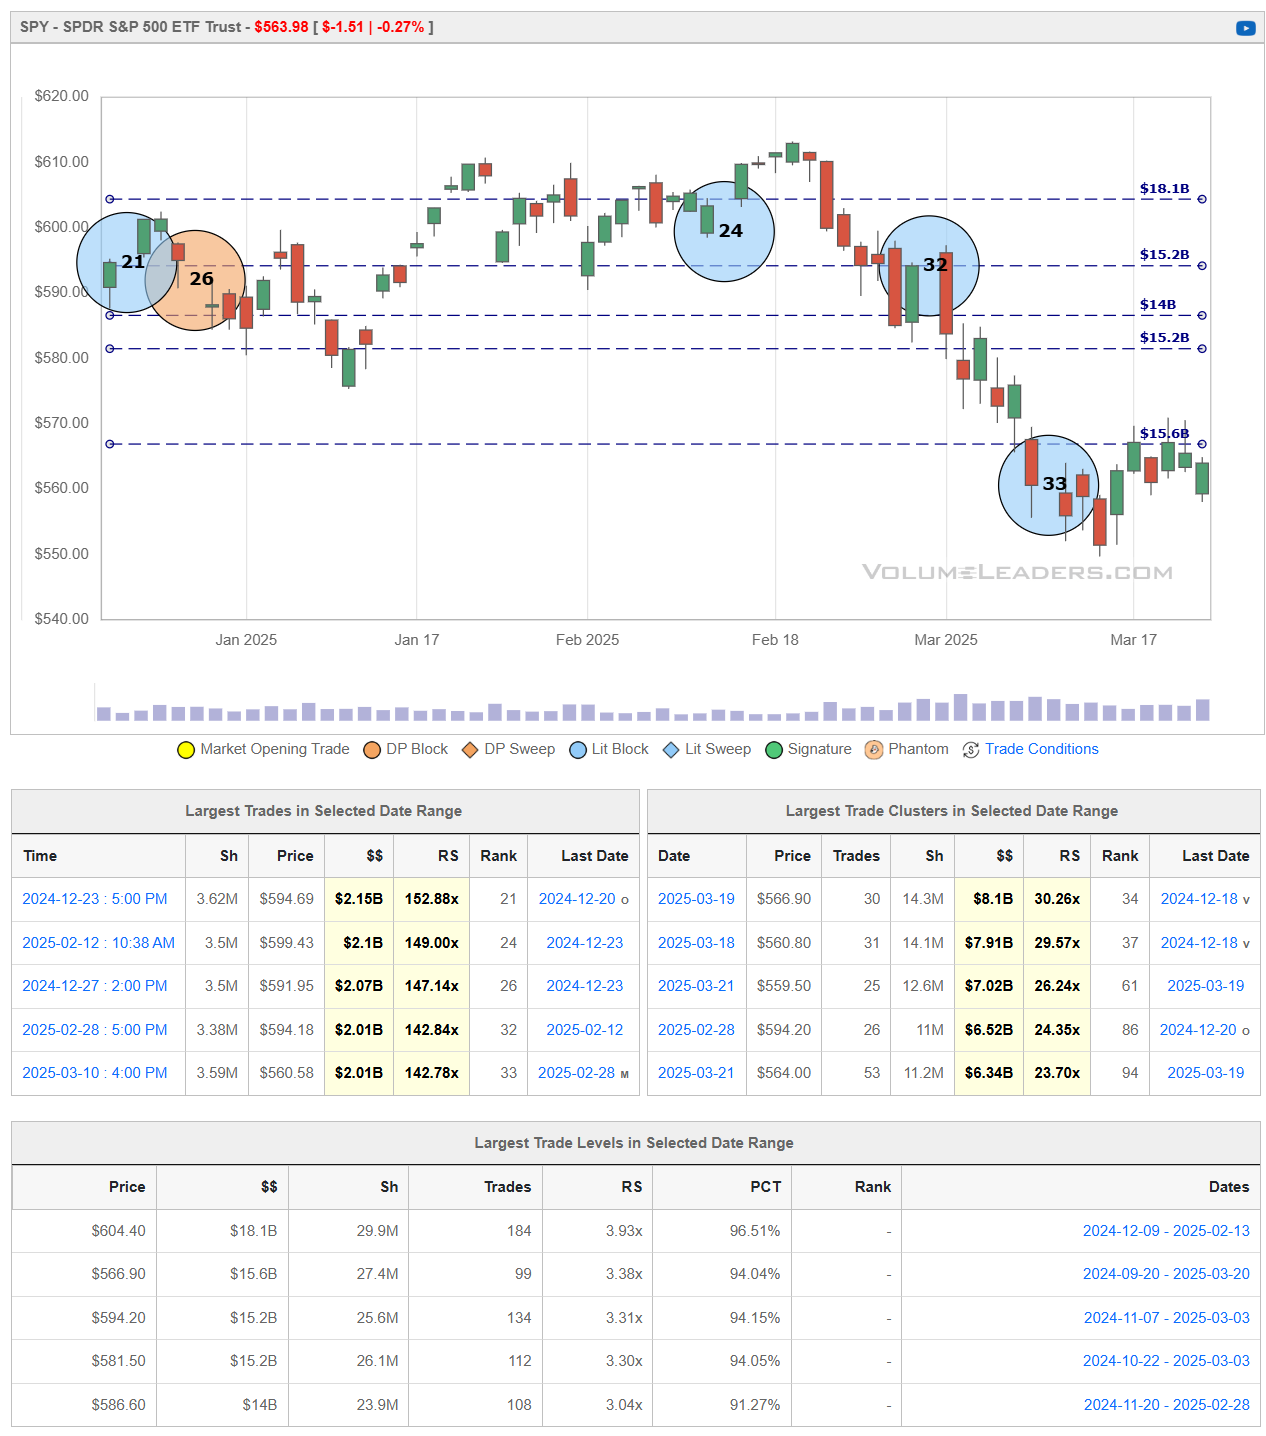
After peaking near $610 in mid‐February, SPY began a steady pullback that found support around the mid‐$550s. The ETF has since staged a mild rebound to the low‐$560s but remains well below heavier resistance levels around $580–$590—areas where institutional trading was particularly active.
In the near term, a successful push above $566-$570 would be the first sign that bulls are regaining control, potentially setting up a test of the $580–$590 band from underneath. However, the clear h-pattern shaping-up suggests a decline back below recent lows into the mid‐$550s below today’s low. SPY would then face an important test - double-bottom and bounce higher first attempting to balance against $566 OR look below $549.68 and liquidate in search of buyers.
QQQ 0.00%↑
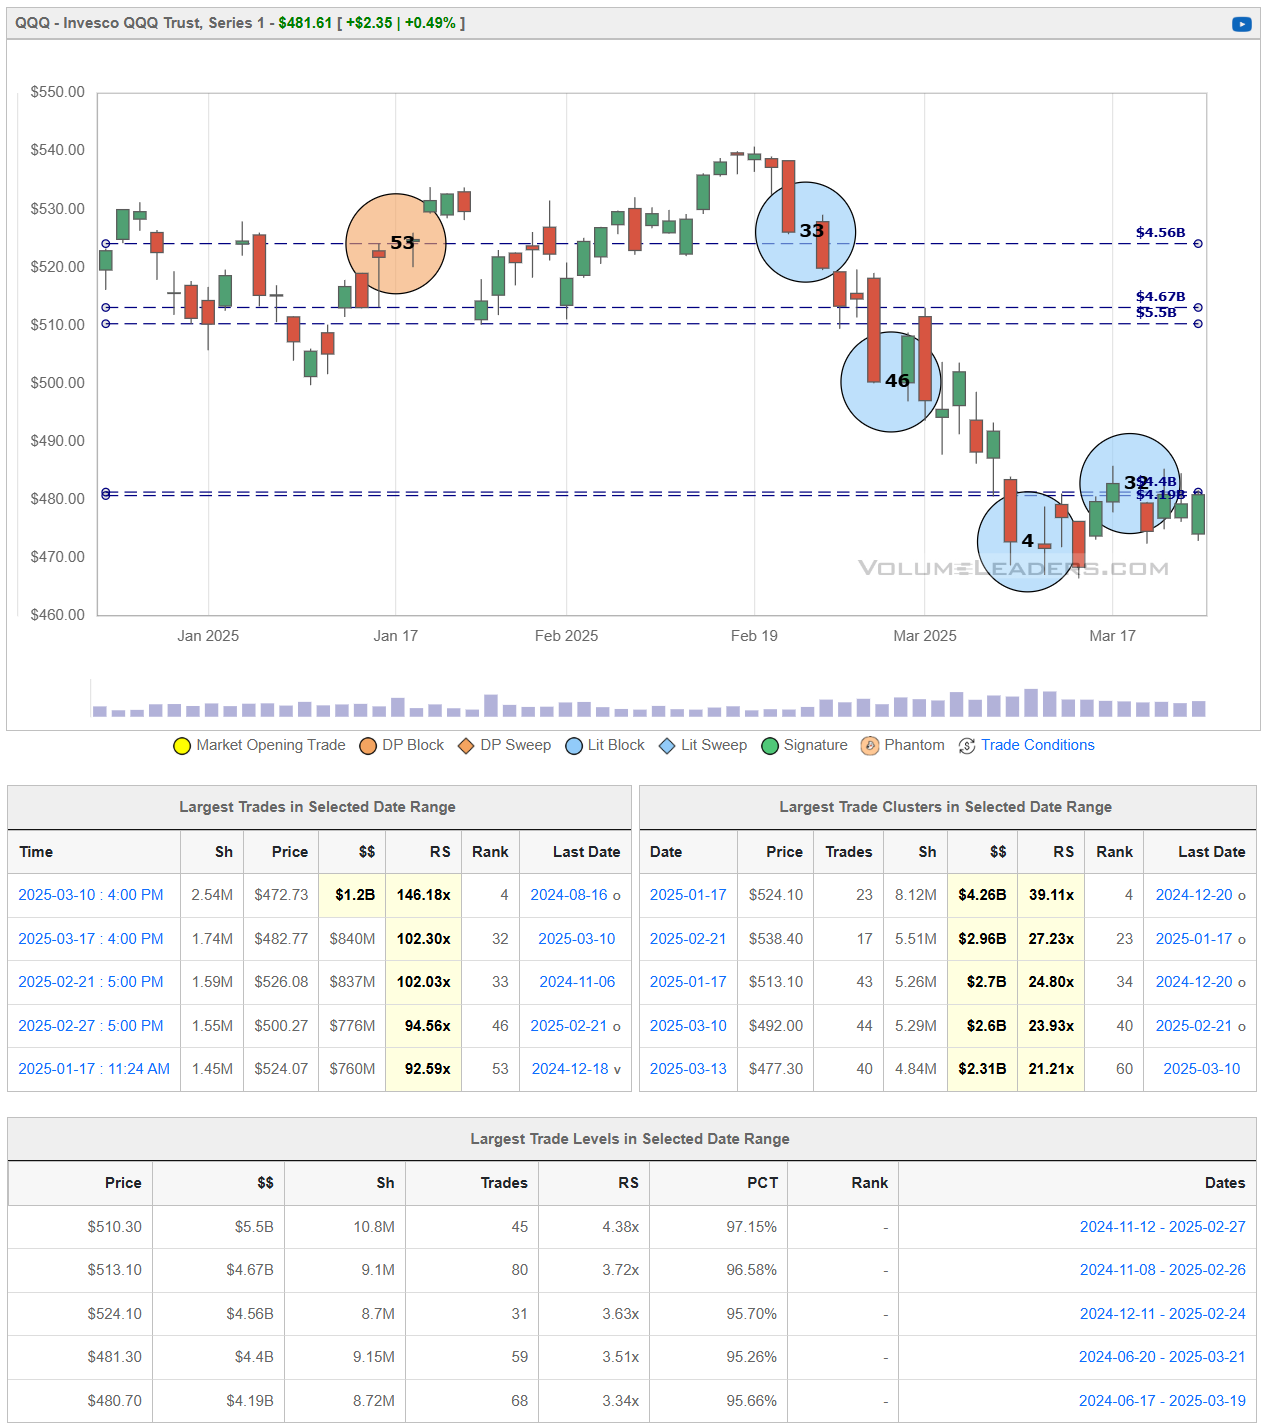
QQQ slid from its mid‐February peak near $540 down to the upper‐$470s before recently finding a bid. Institutional trades in the $480–$485 zone have supported a modest rebound, but the ETF remains below key resistance around $500–$510, where significant volume signals potential overhead supply.
If buyers can clear that $500–$510 band, it would suggest that the current bounce is more than a short‐term relief rally and could fuel further upside toward the $520 level. Conversely, a failure to reclaim those higher price zones—or a slip back under $480—would indicate that sellers still dominate, heightening the risk of a deeper pullback into the mid‐$470s or lower.
IWM 0.00%↑
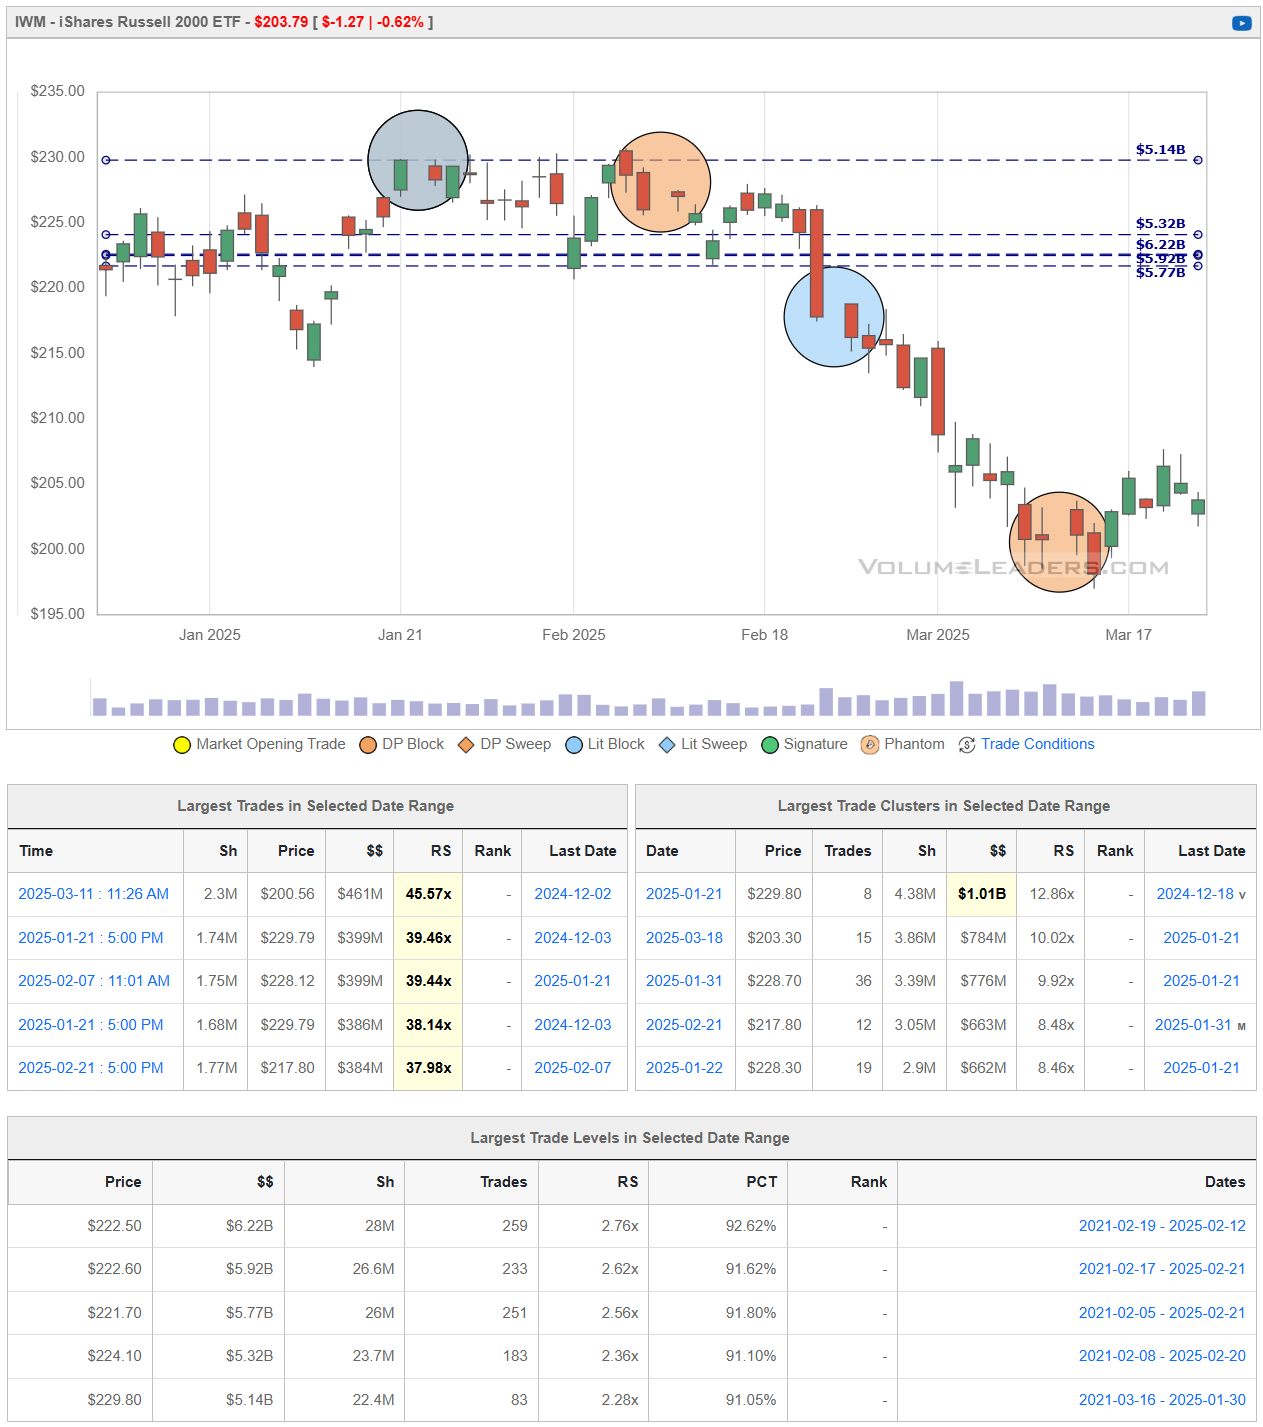
IWM has fallen considerably from the $230 area in mid‐February down toward $200, where recent institutional trades suggest some buying support has begun to stabilize price. Despite this modest bounce, the ETF remains below major resistance around $215–$220, a zone that previously served as support and now likely hosts overhead supply.
If IWM can break decisively above the $215–$220 region, it would signal that buyers have absorbed the latest wave of selling, opening the door for a more sustained recovery. Conversely, a failure to reclaim those higher levels—or a renewed drop below $200—would indicate that the downtrend remains intact, exposing IWM to the possibility of deeper lows.
DIA 0.00%↑
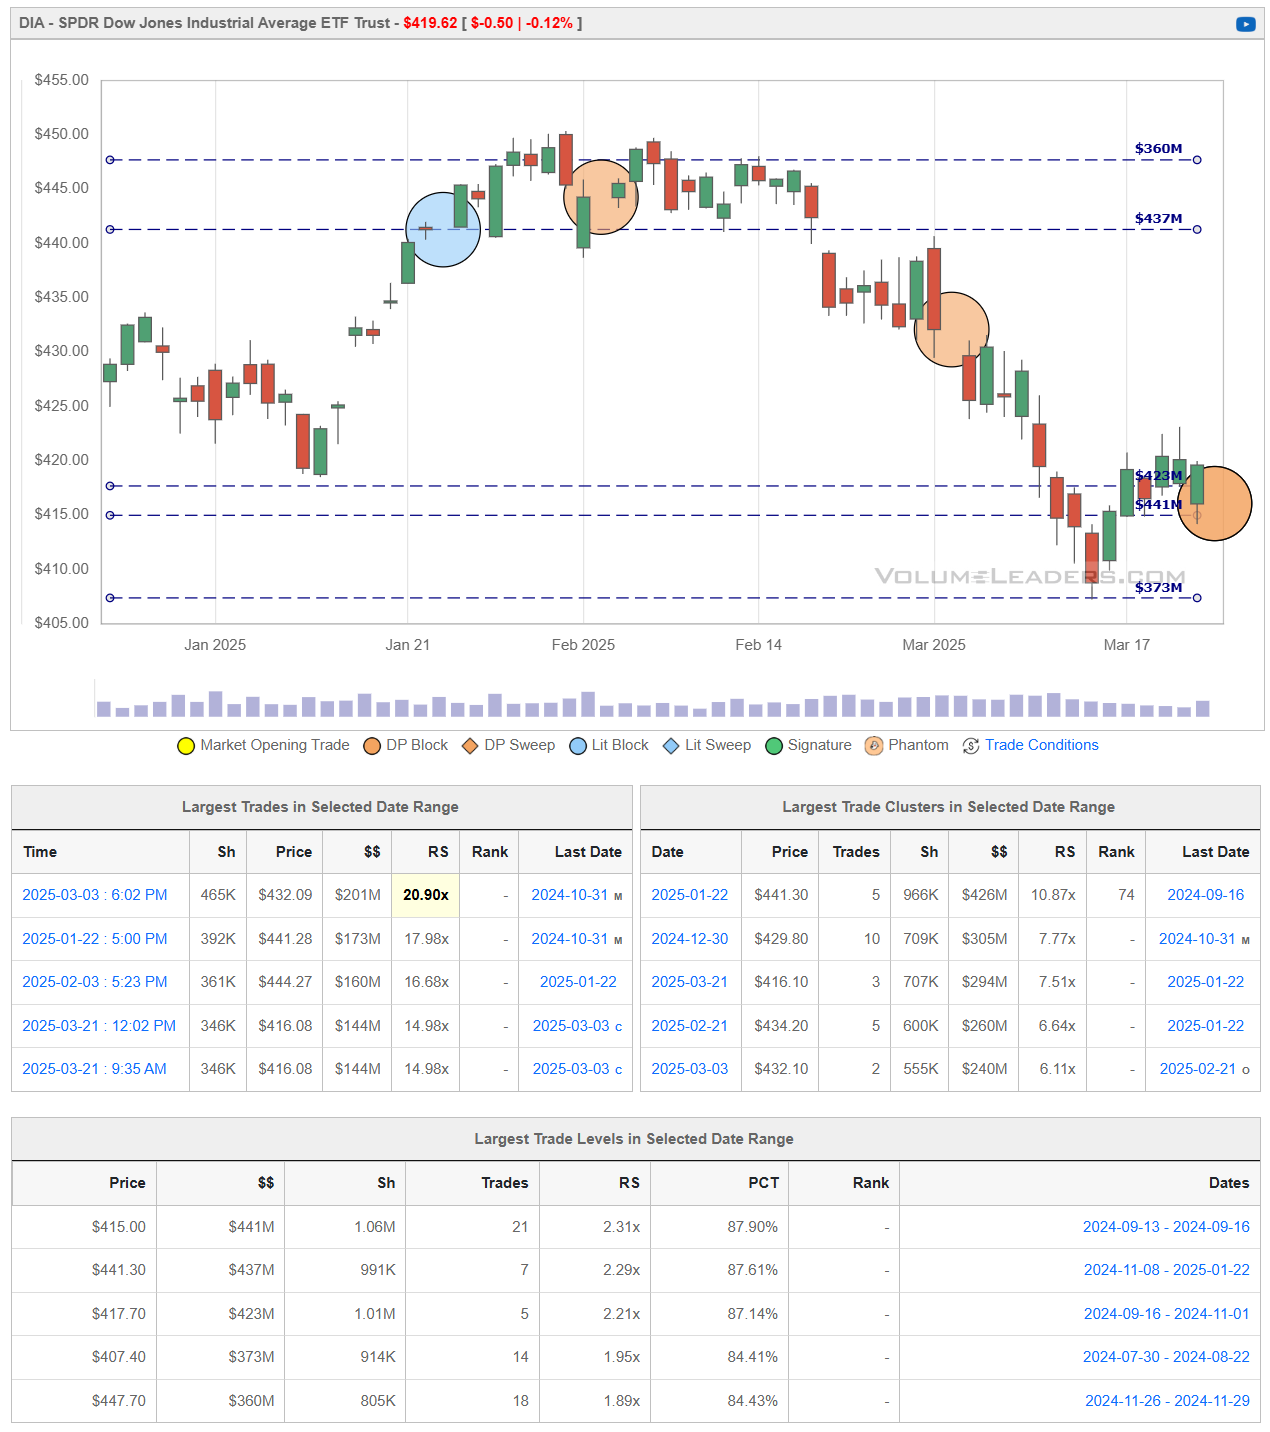
DIA has pulled back significantly from its February highs near $450 and recently found support around the $410–$415 zone. Although the ETF is attempting a bounce toward $420, overhead supply in the $425–$430 region still looms as a potential barrier. If buyers can push DIA above $425 on strong volume, a more sustained recovery into the mid‐$430s becomes likely. Conversely, a break back under $415 would suggest sellers remain in control, raising the risk of revisiting or undercutting the March lows although, of the 4 index ETFS, this one appears the most developed at the lows and in the best position to weather further pressure on indices.
Institutional Order Flow
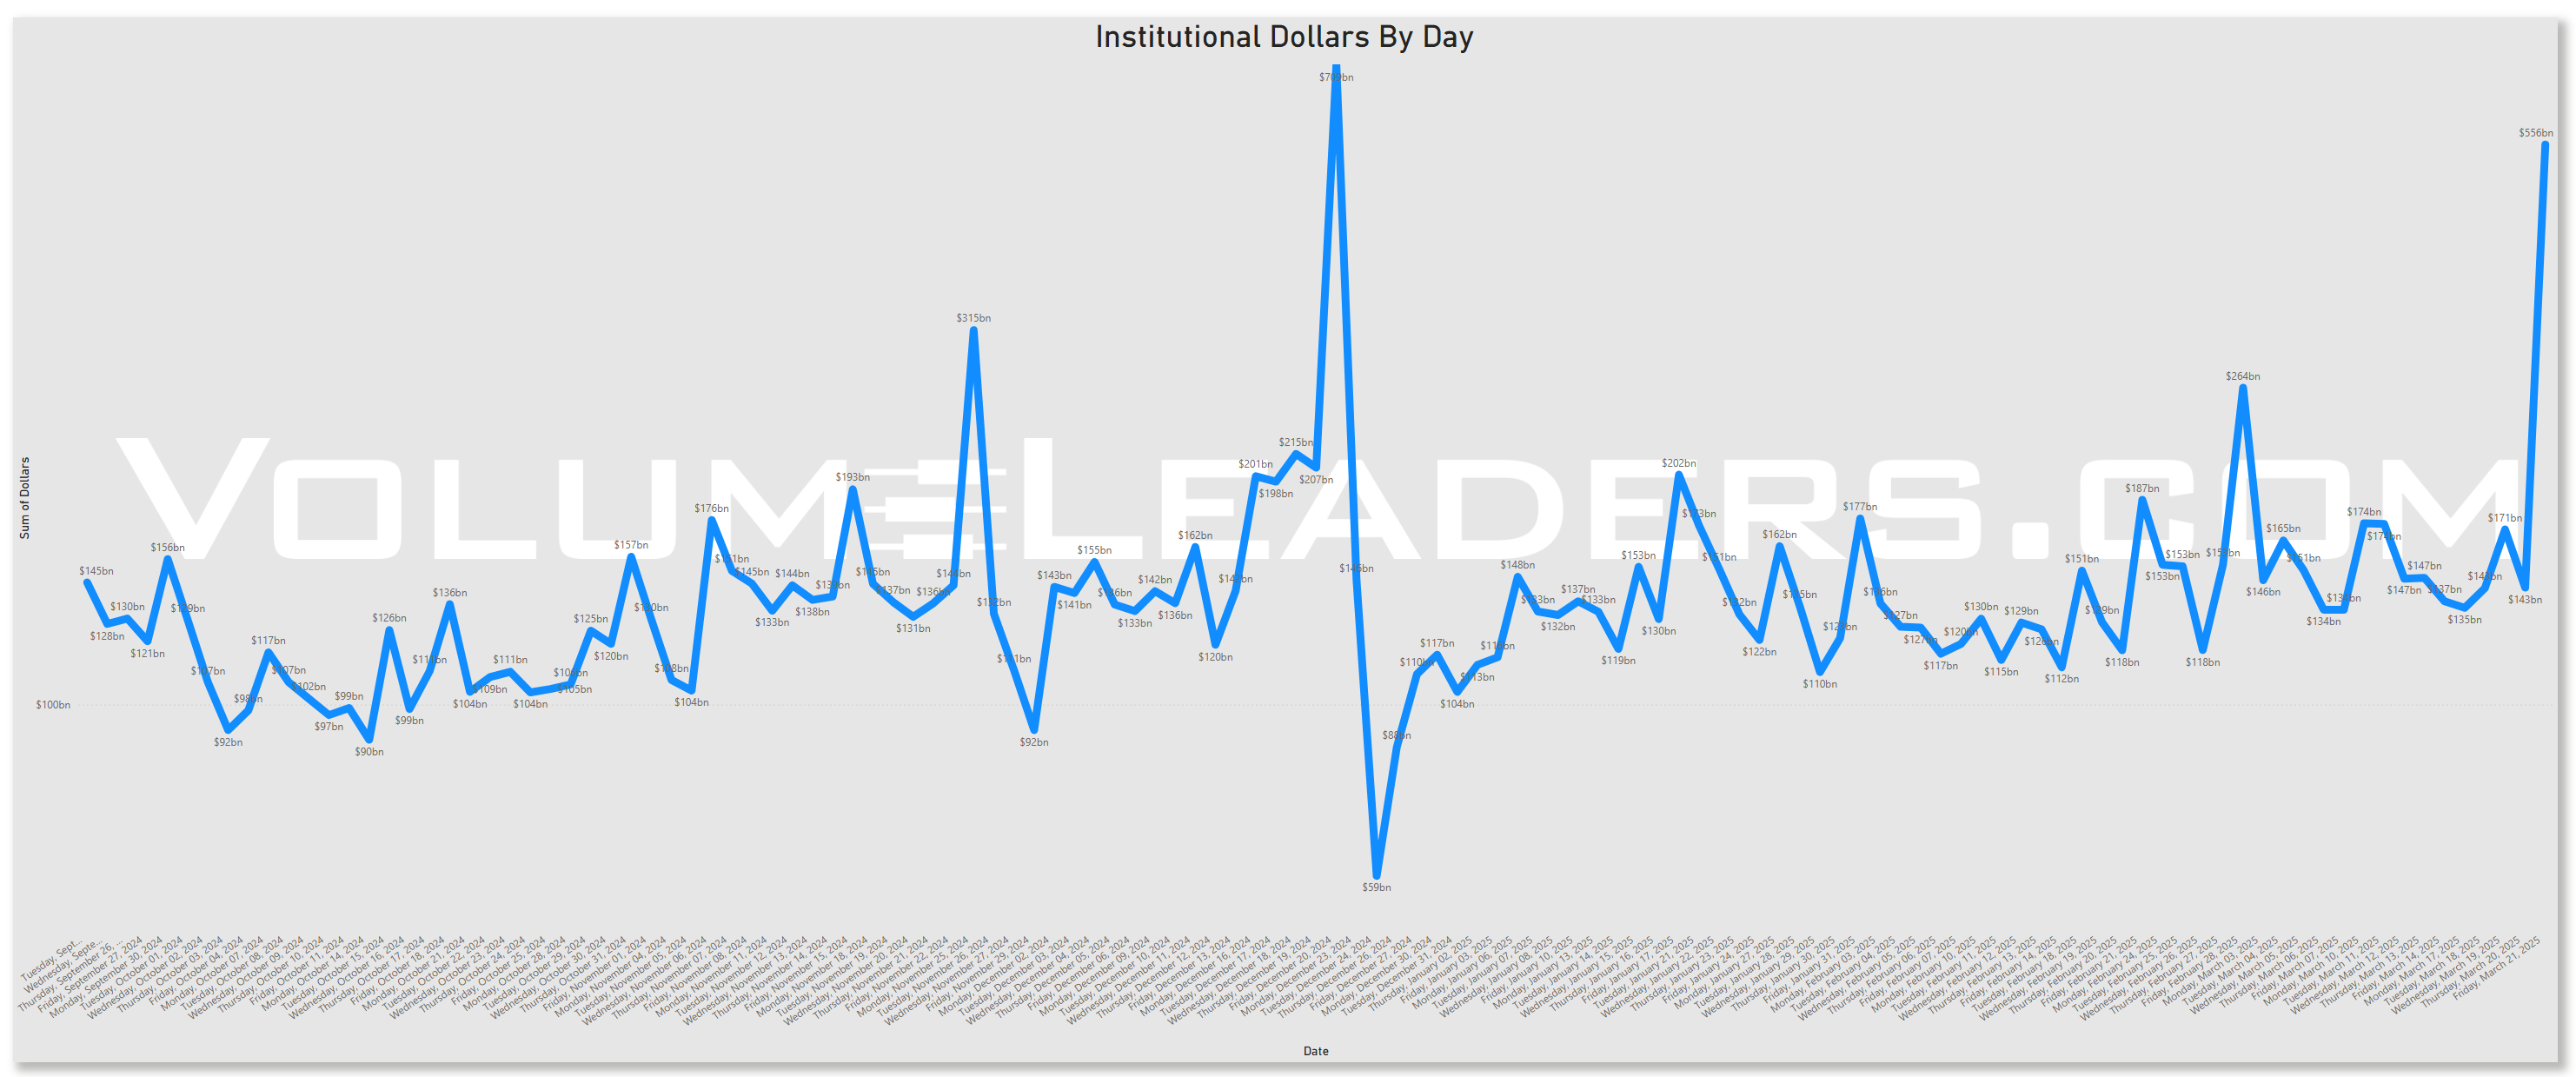
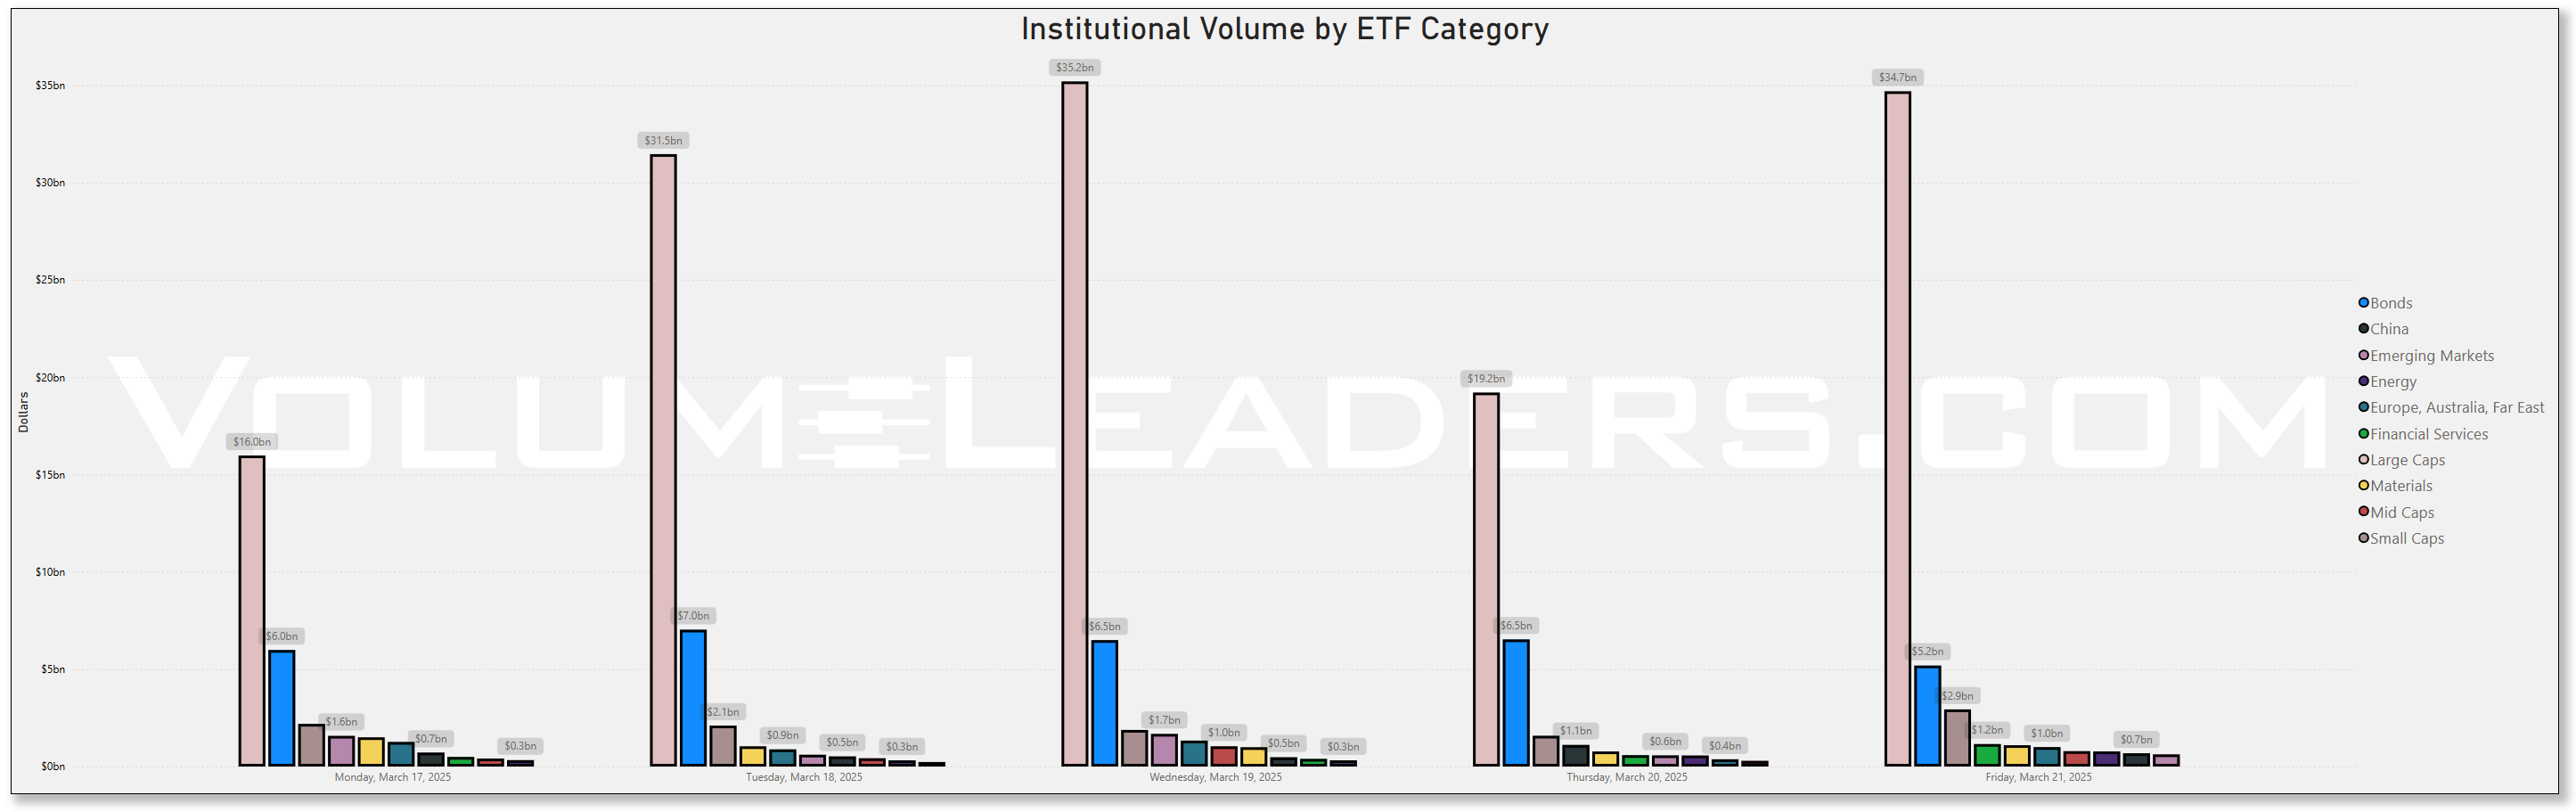
Rolling 90-Day Dollars By Day
This chart shows institutional activity by dollars by day on a rolling 1-year basis. From a theoretical standpoint, examining a chart of daily institutional dollar activity over the course of a year can offer several insights and possible inferences, though all should be approached with caution since the data alone may not prove causality or confirm underlying reasons. Some potential takeaways include:
Event-Driven Behavior:
Sharp, singular spikes on certain days might correlate with major market-moving events. These could include central bank policy announcements, significant geopolitical news, sudden macroeconomic data releases (like employment reports or GDP data), earnings seasons for large-cap companies, or unexpected shocks (e.g., mergers, acquisitions, regulatory changes).Liquidity Dynamics:
Institutions often concentrate large trades on days with higher expected liquidity. For instance, heightened activity might coincide with index reconstitutions, option expiration dates, or the days leading up to or following a major index rebalance, when large amounts of capital shift hands simultaneously.Risk Management and Hedging Activity:
Institutions may significantly adjust their exposures on days that are critical from a risk management perspective. Large spikes can occur if hedge funds, pension funds, or asset managers are rolling over futures contracts, initiating or closing out large hedges, or reacting to volatility triggers.Market Sentiment Indicators:
While the data is purely transactional, the sheer volume of institutional involvement on certain days might indirectly hint at changing sentiment or strategic shifts.
In essence, a chart like this can lead you to hypothesize that institutional trading volumes are not constant or random but rather influenced by a mix of predictable calendar effects, major market events, liquidity considerations, risk management decisions, and strategic allocation shifts.
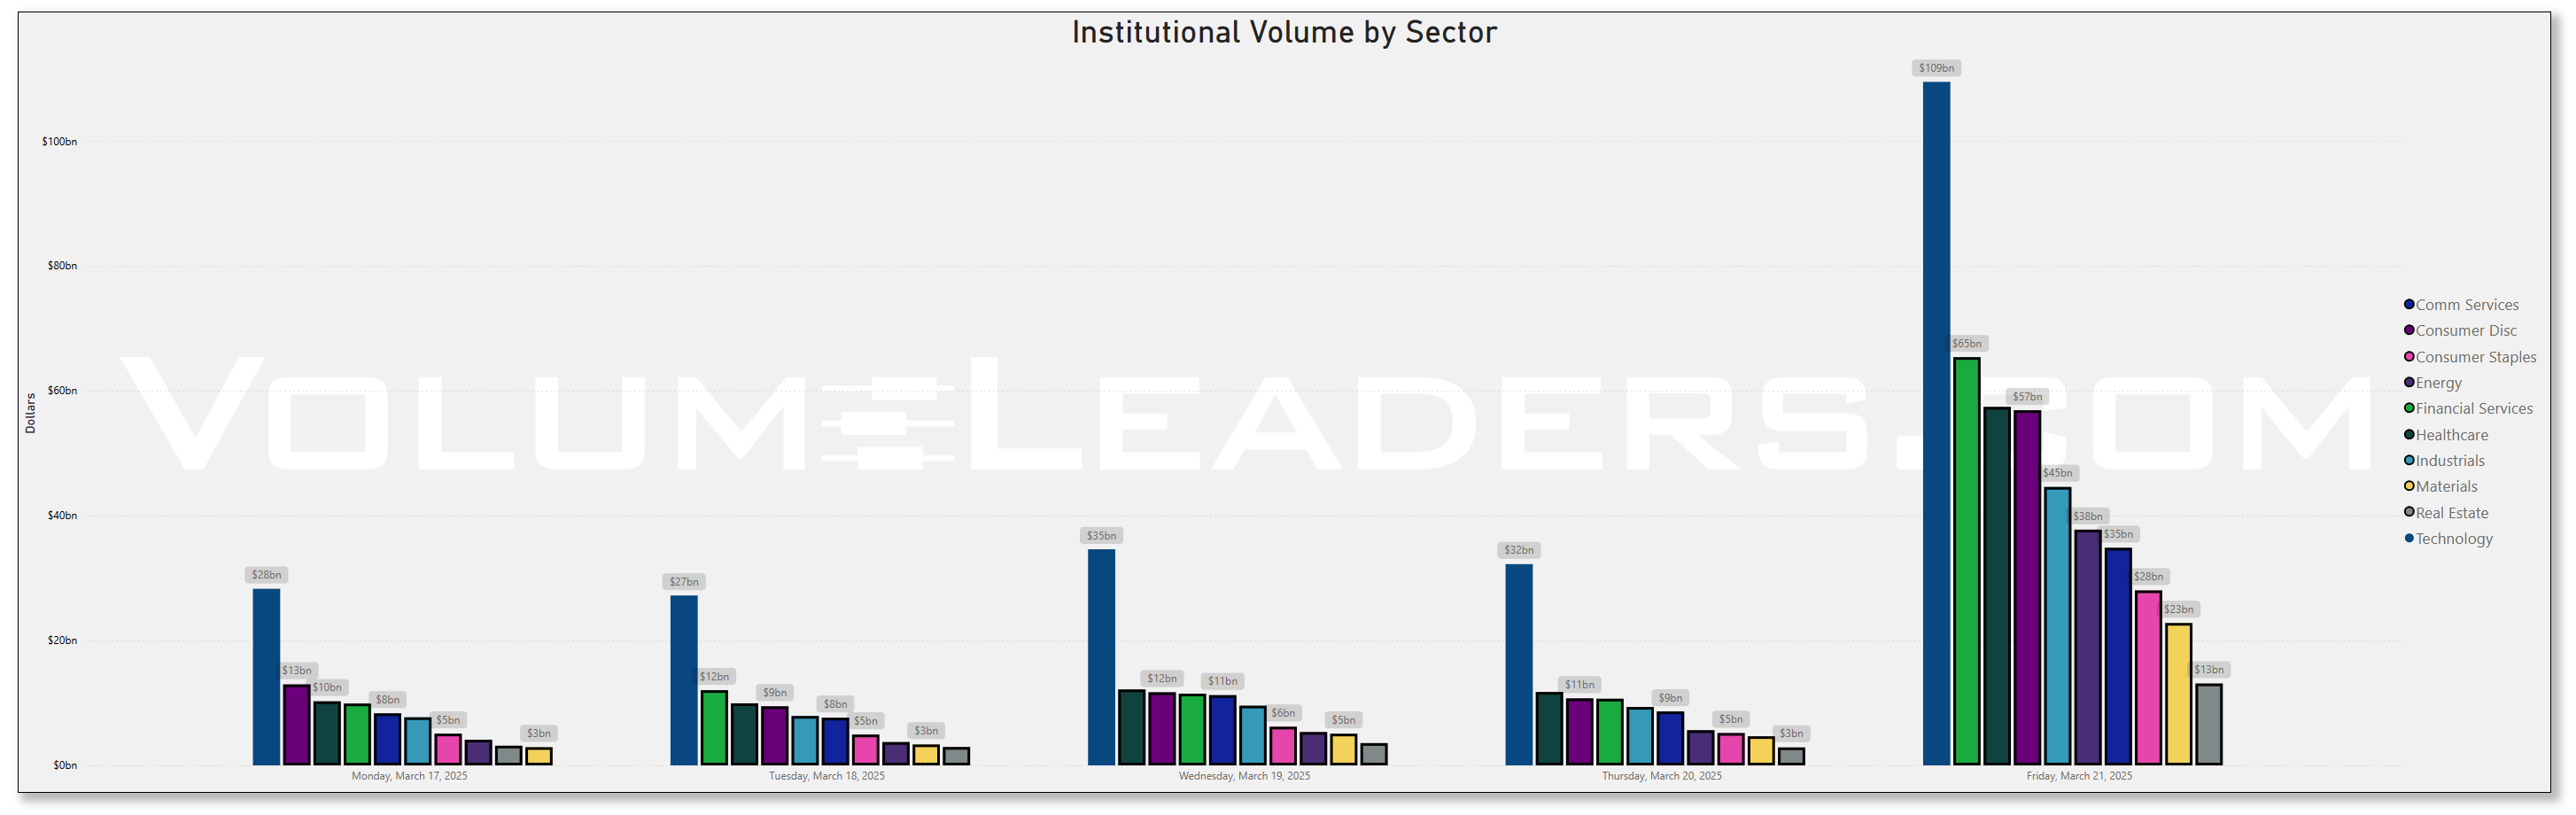
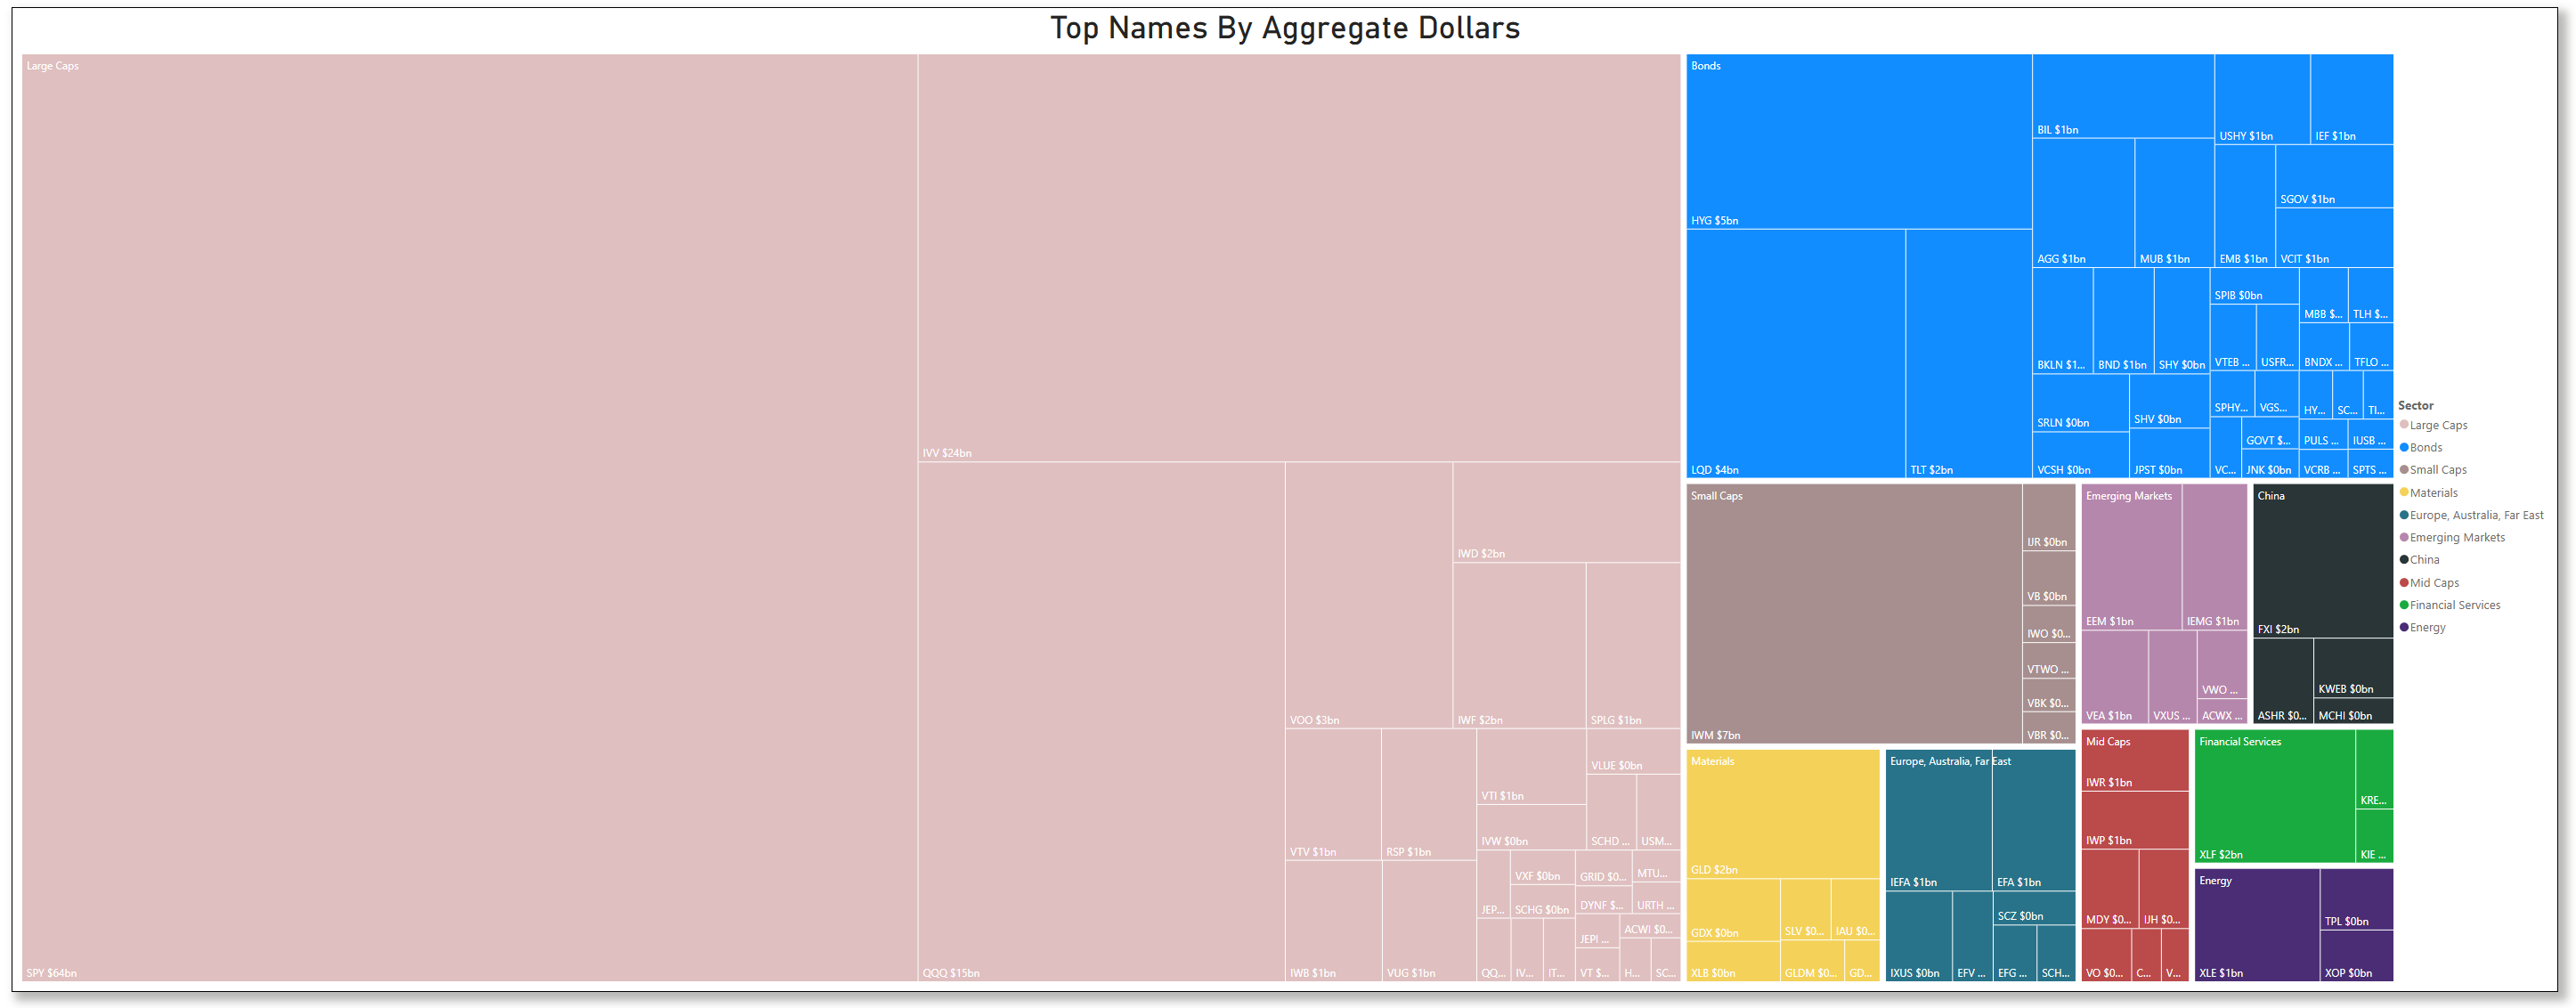
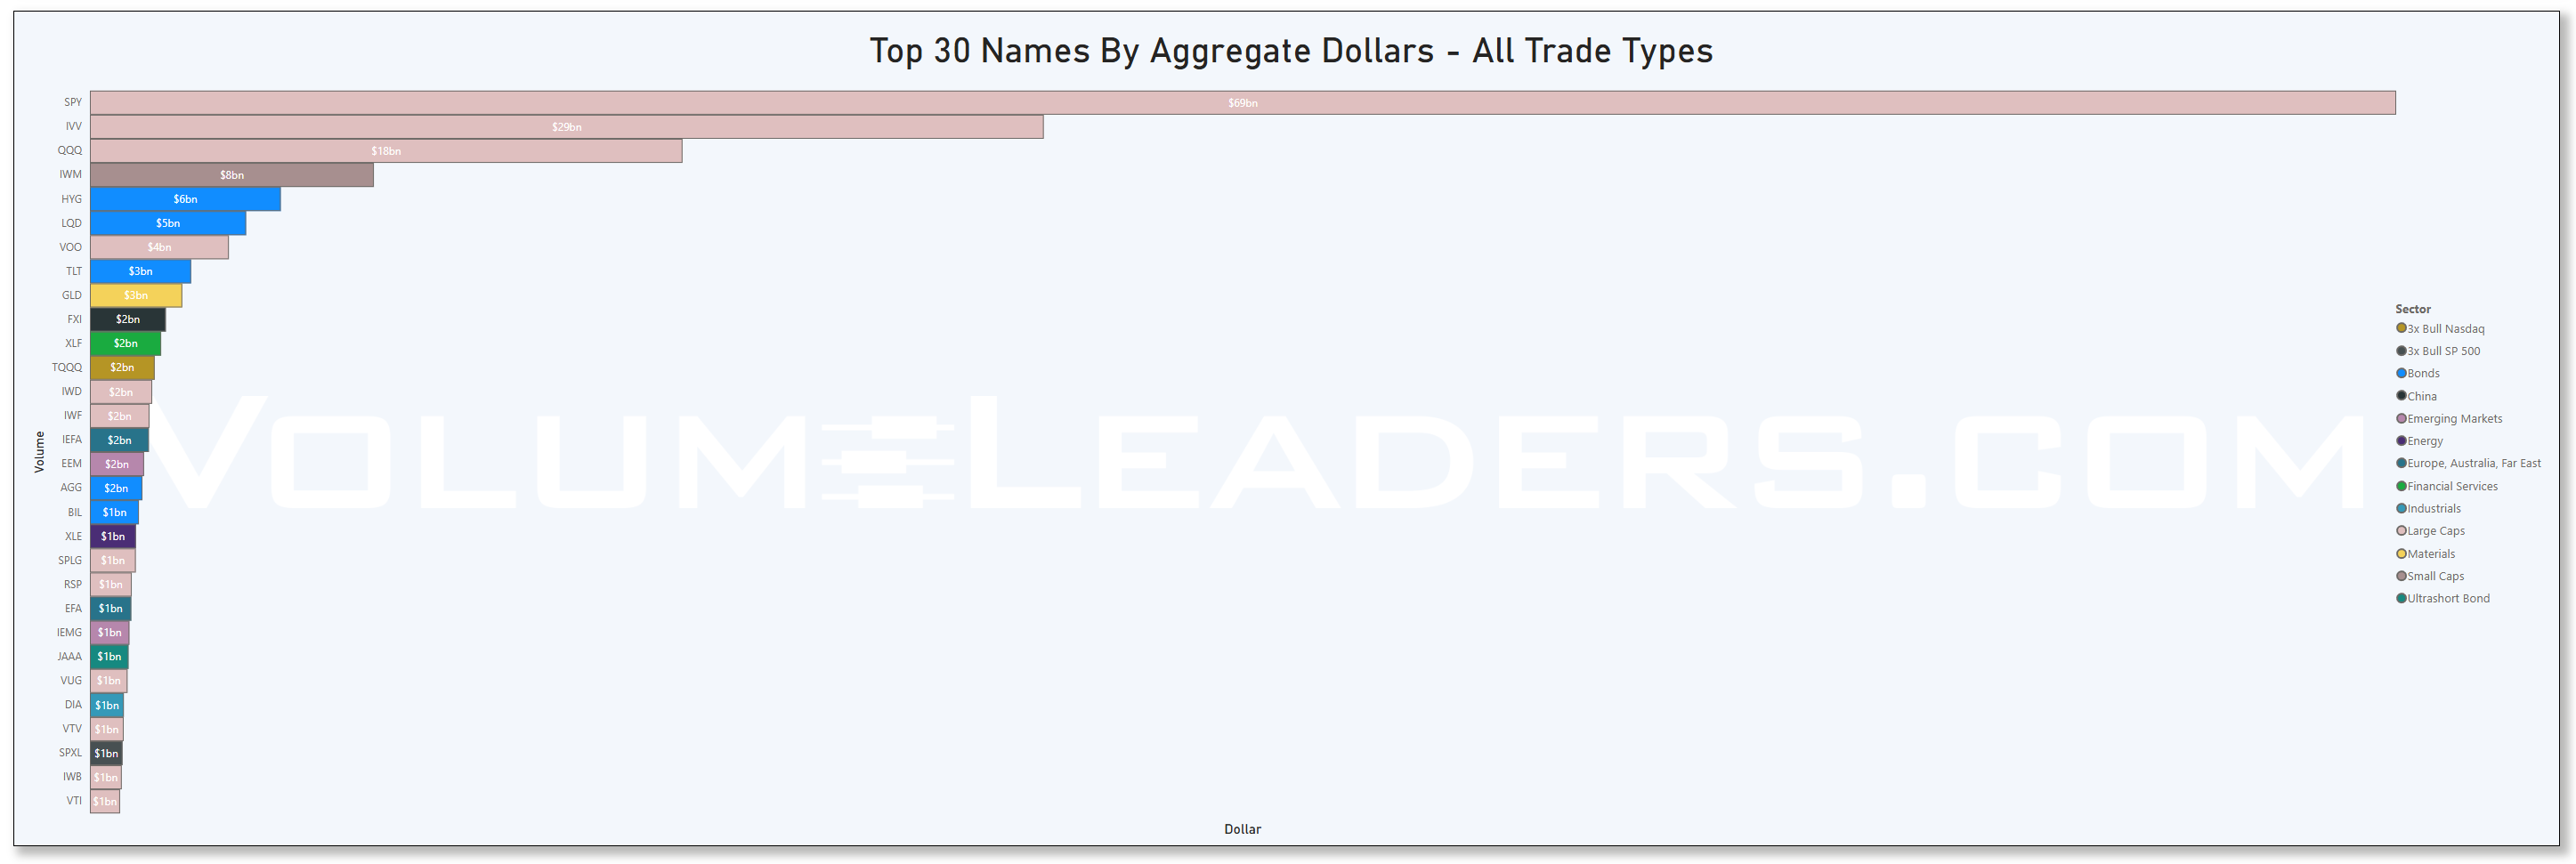
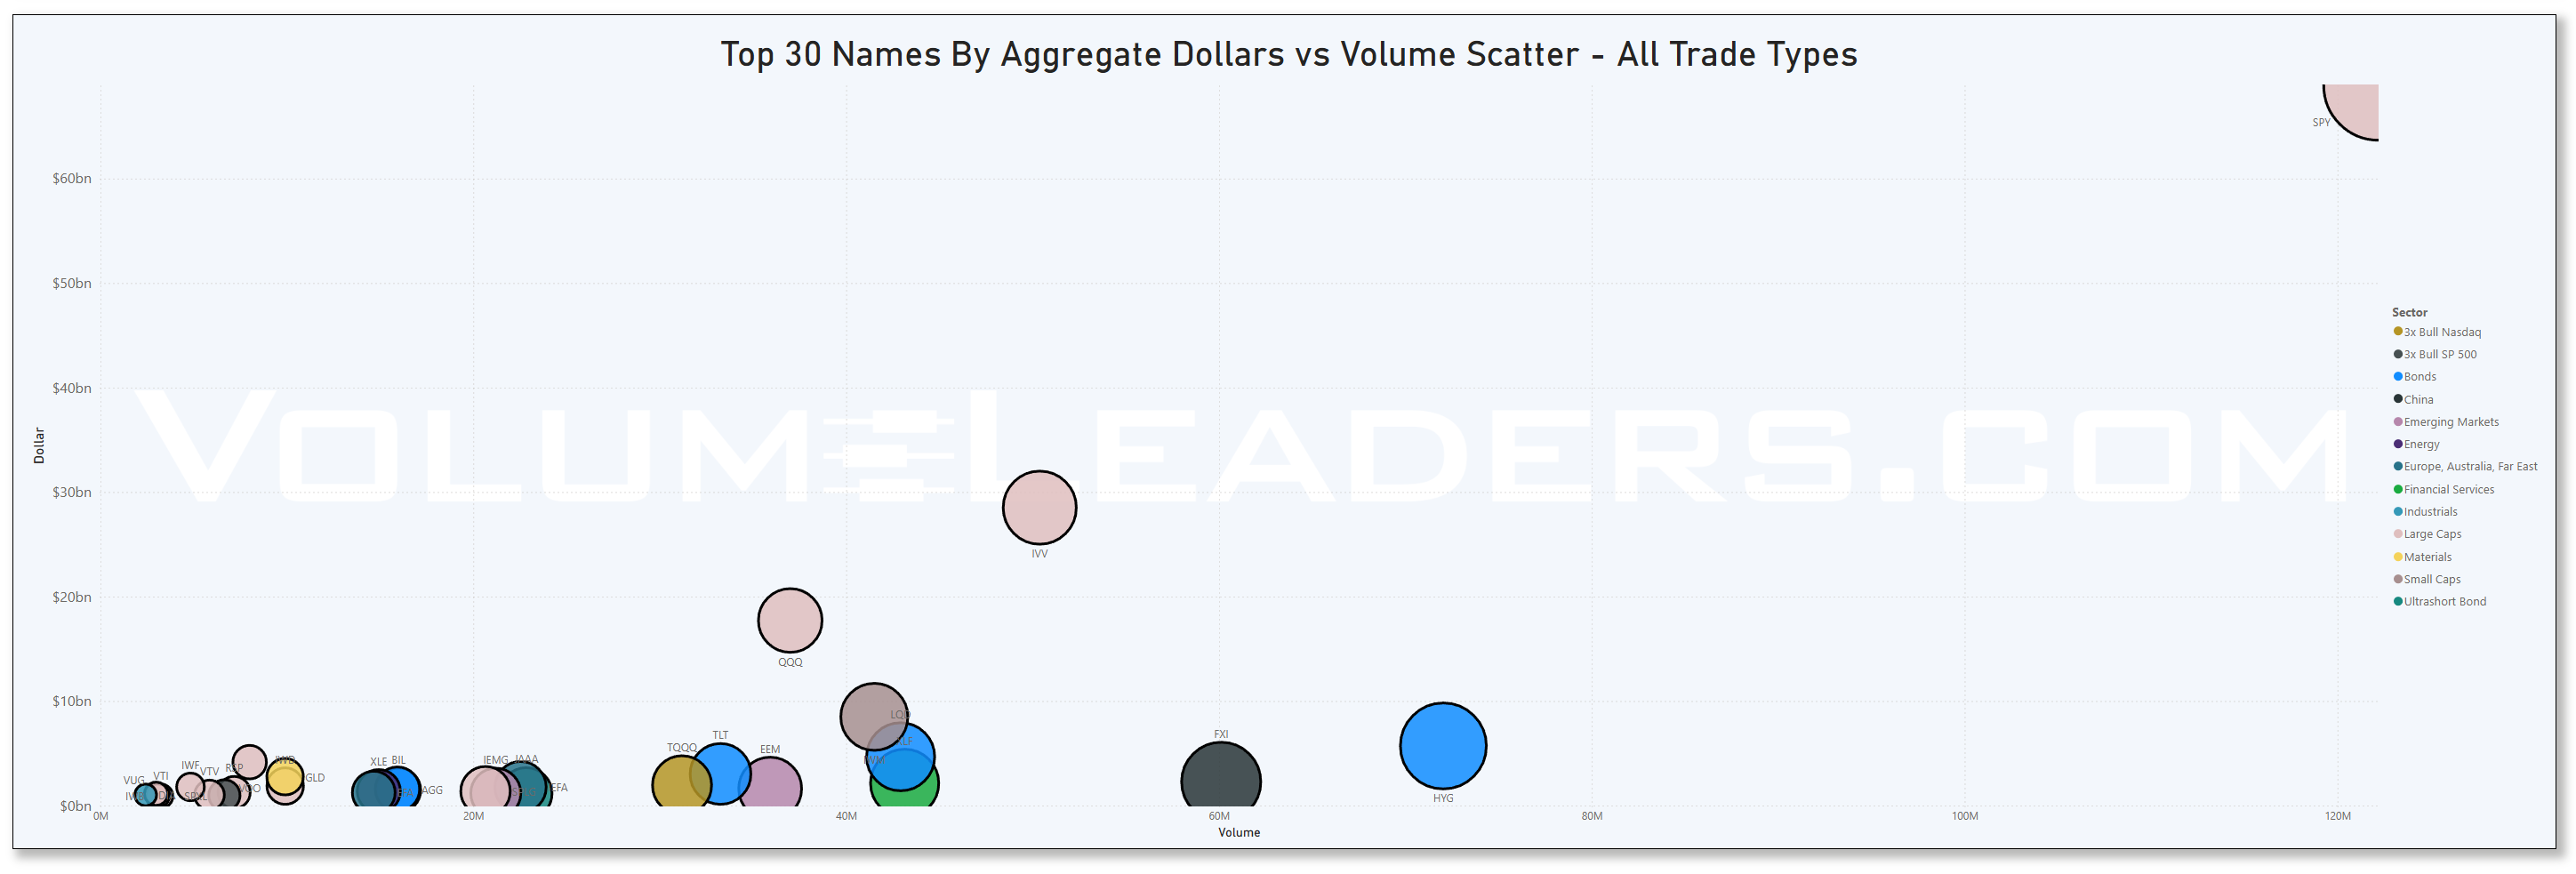
Top Institutional Order Flow By Sector By Week For The Past 90-Days
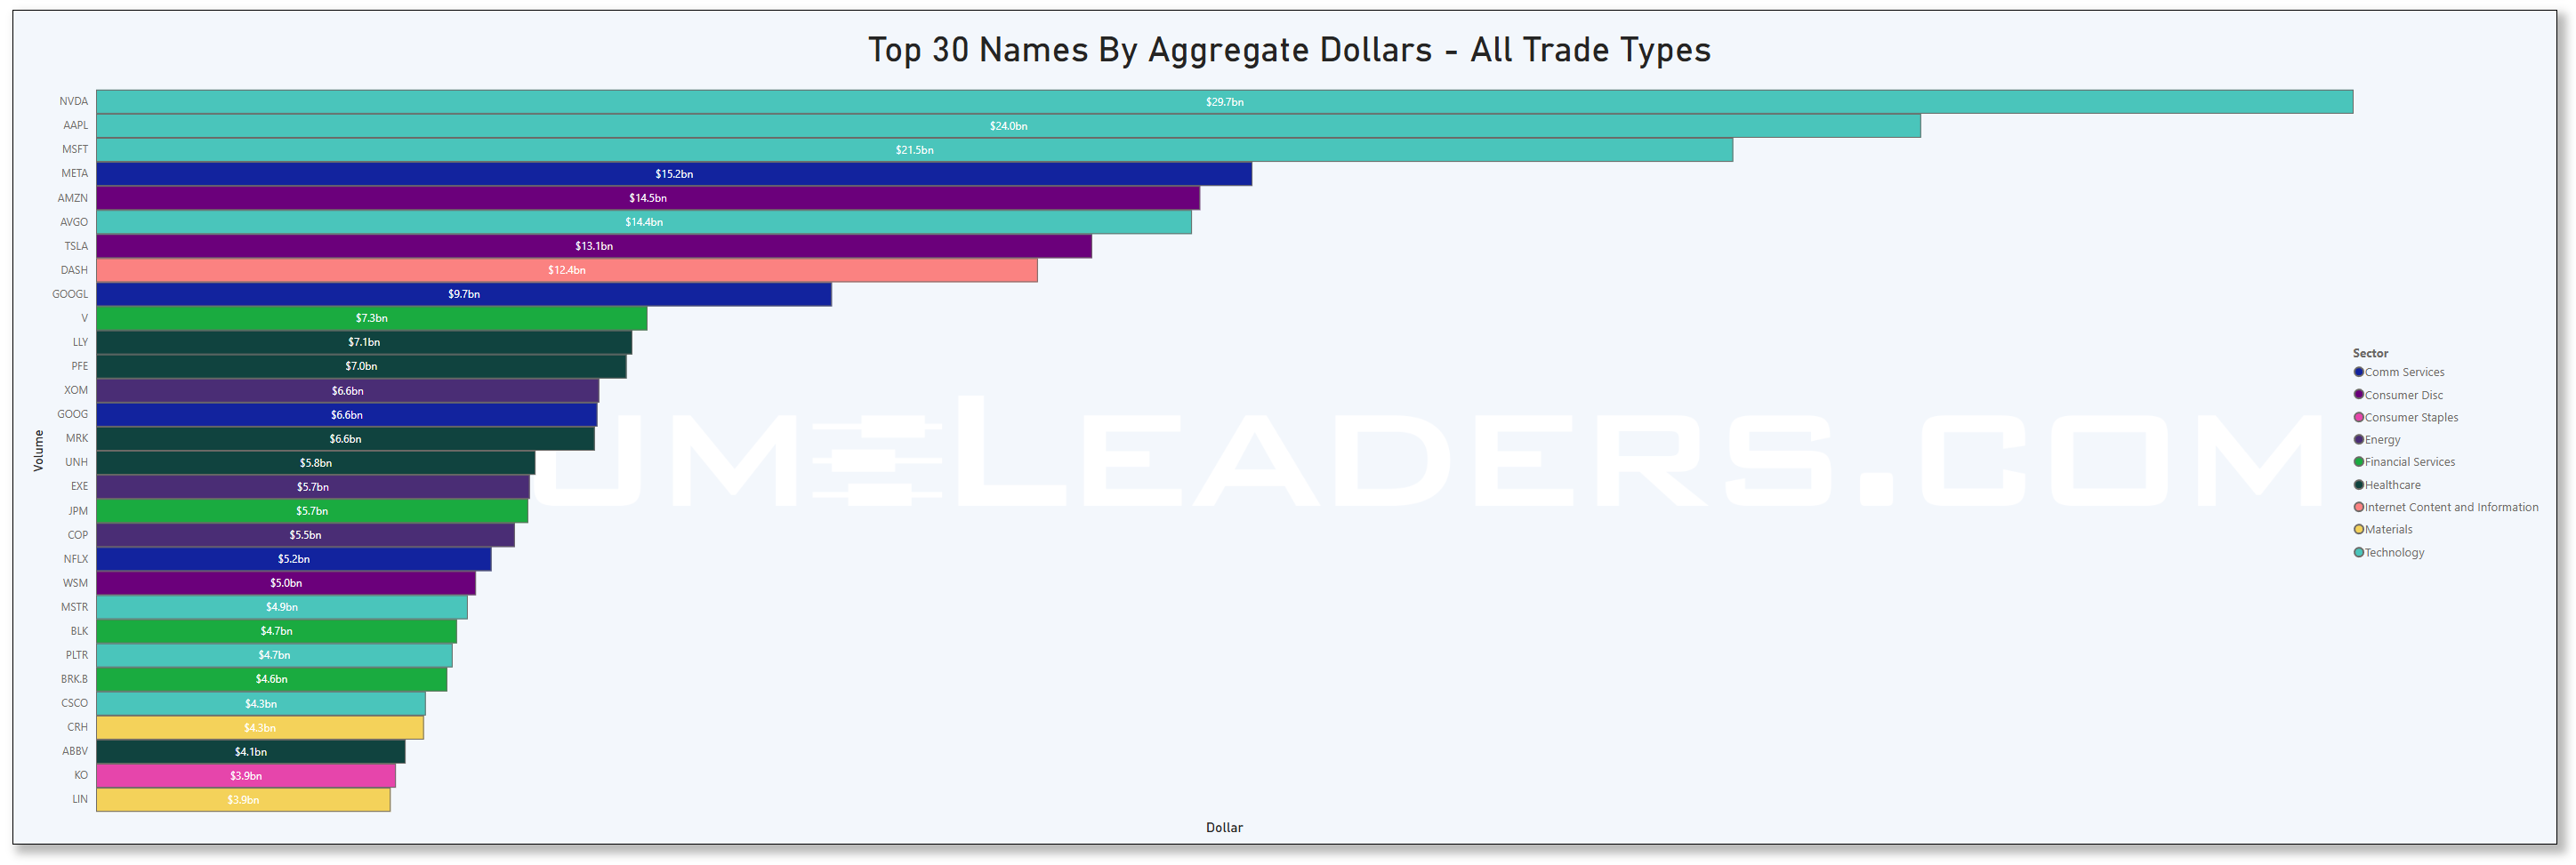
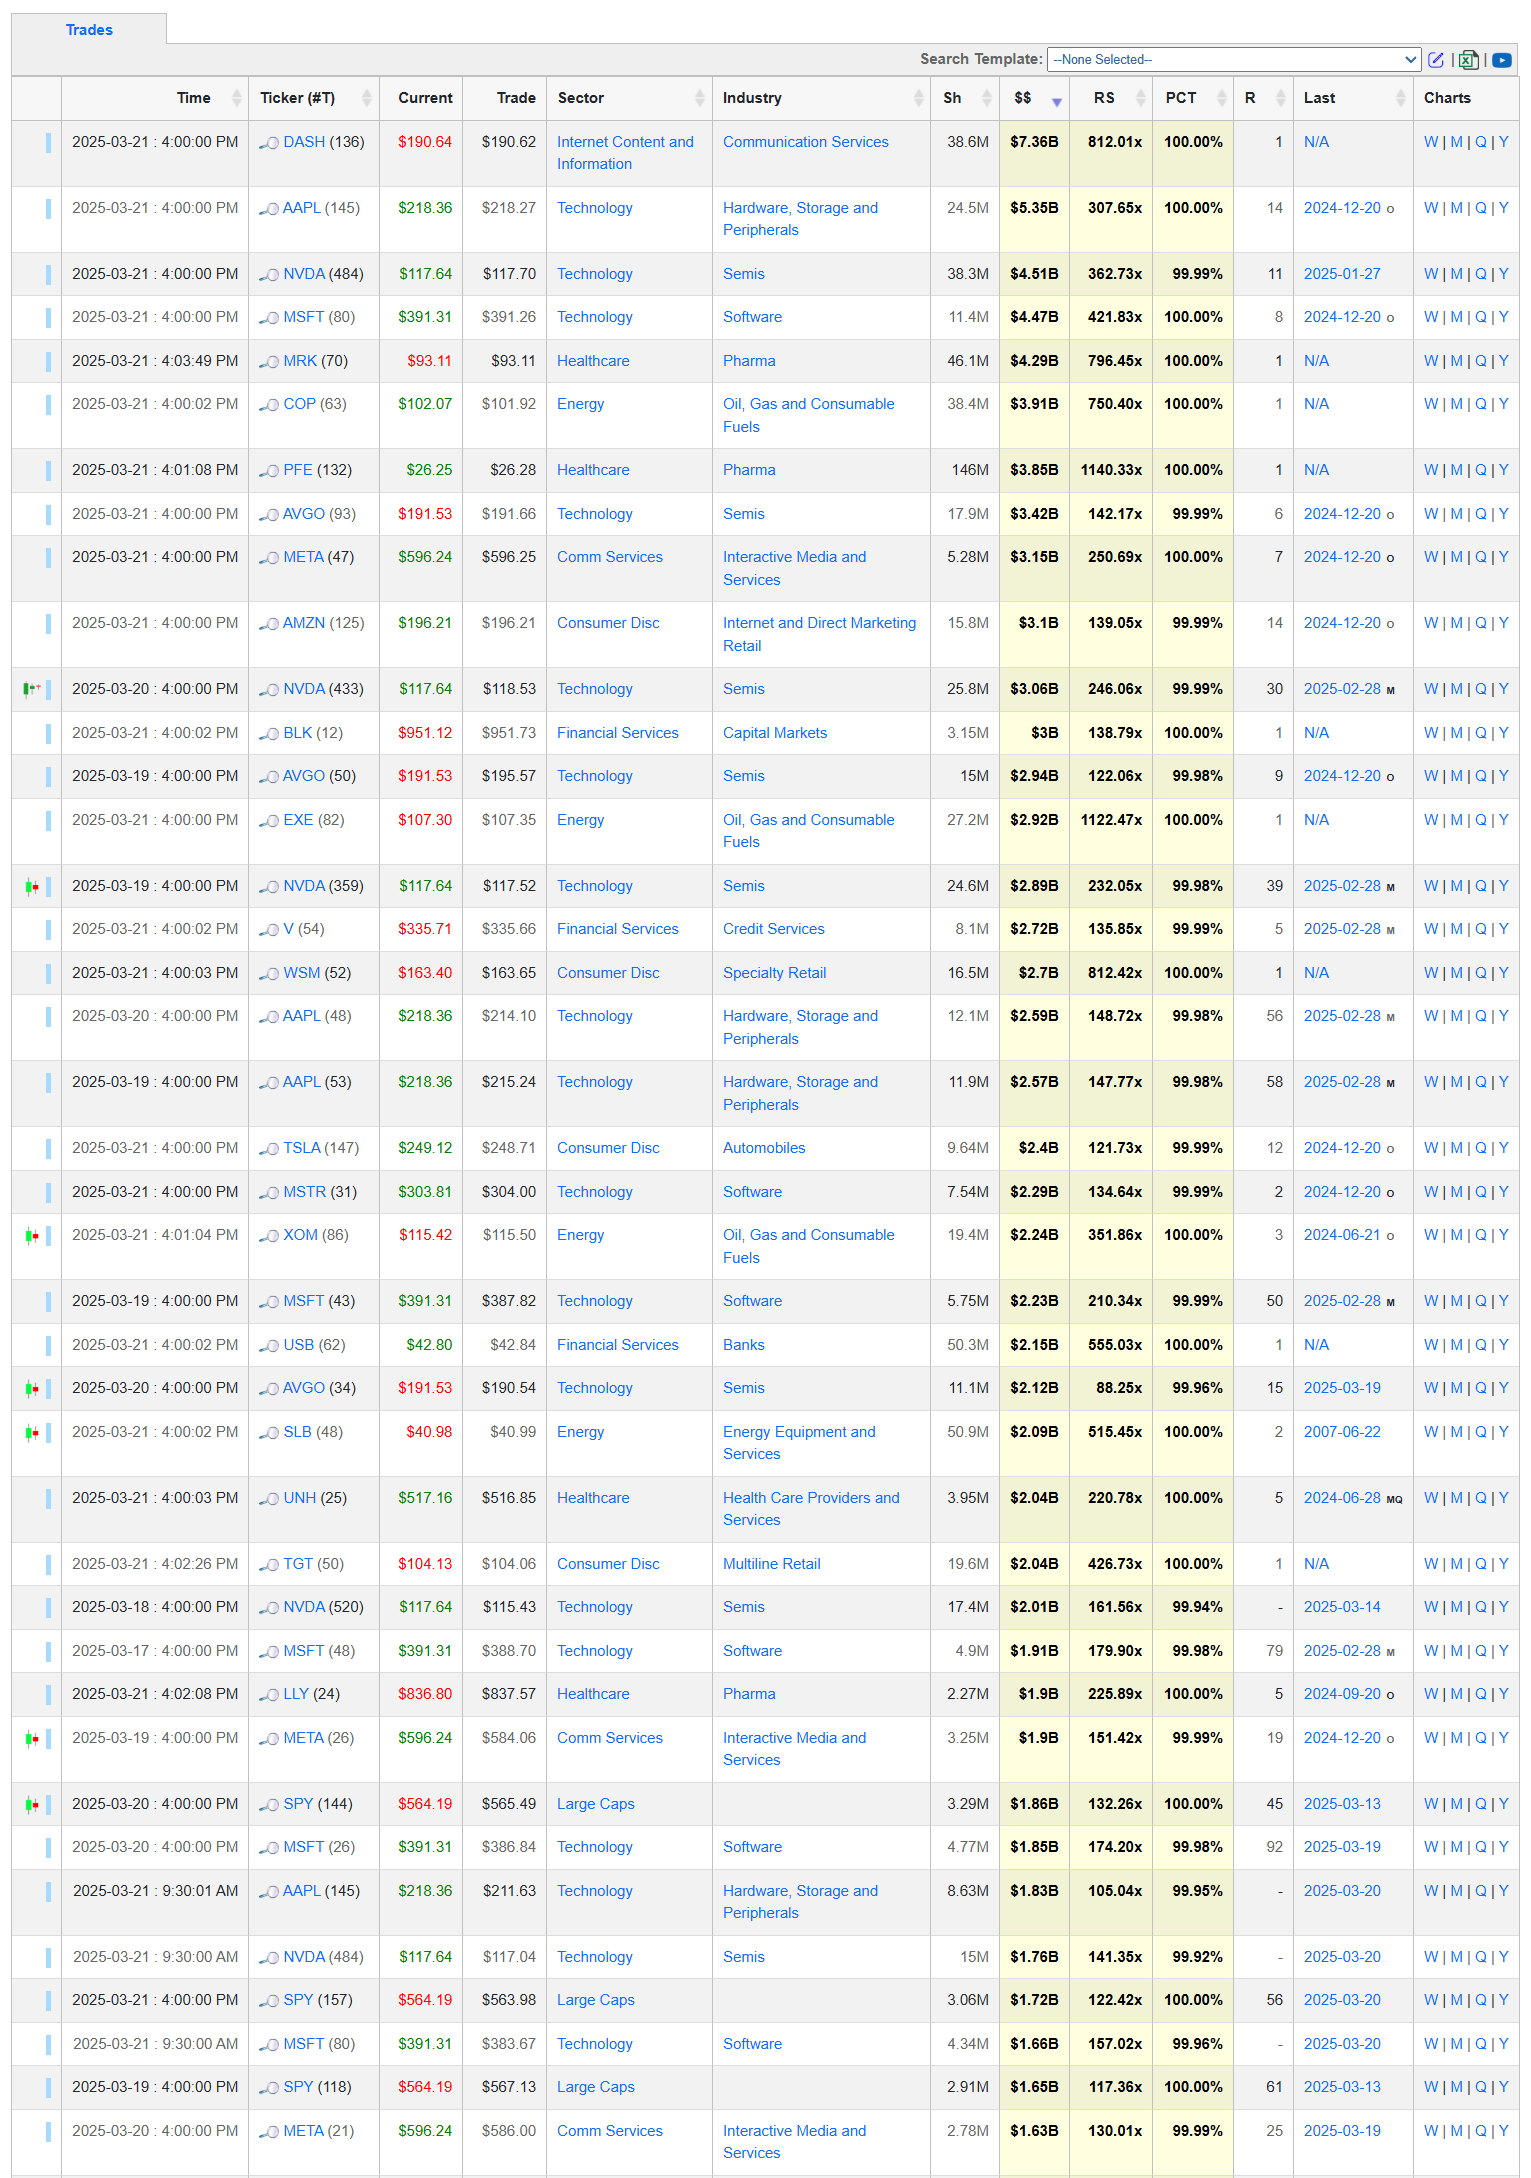
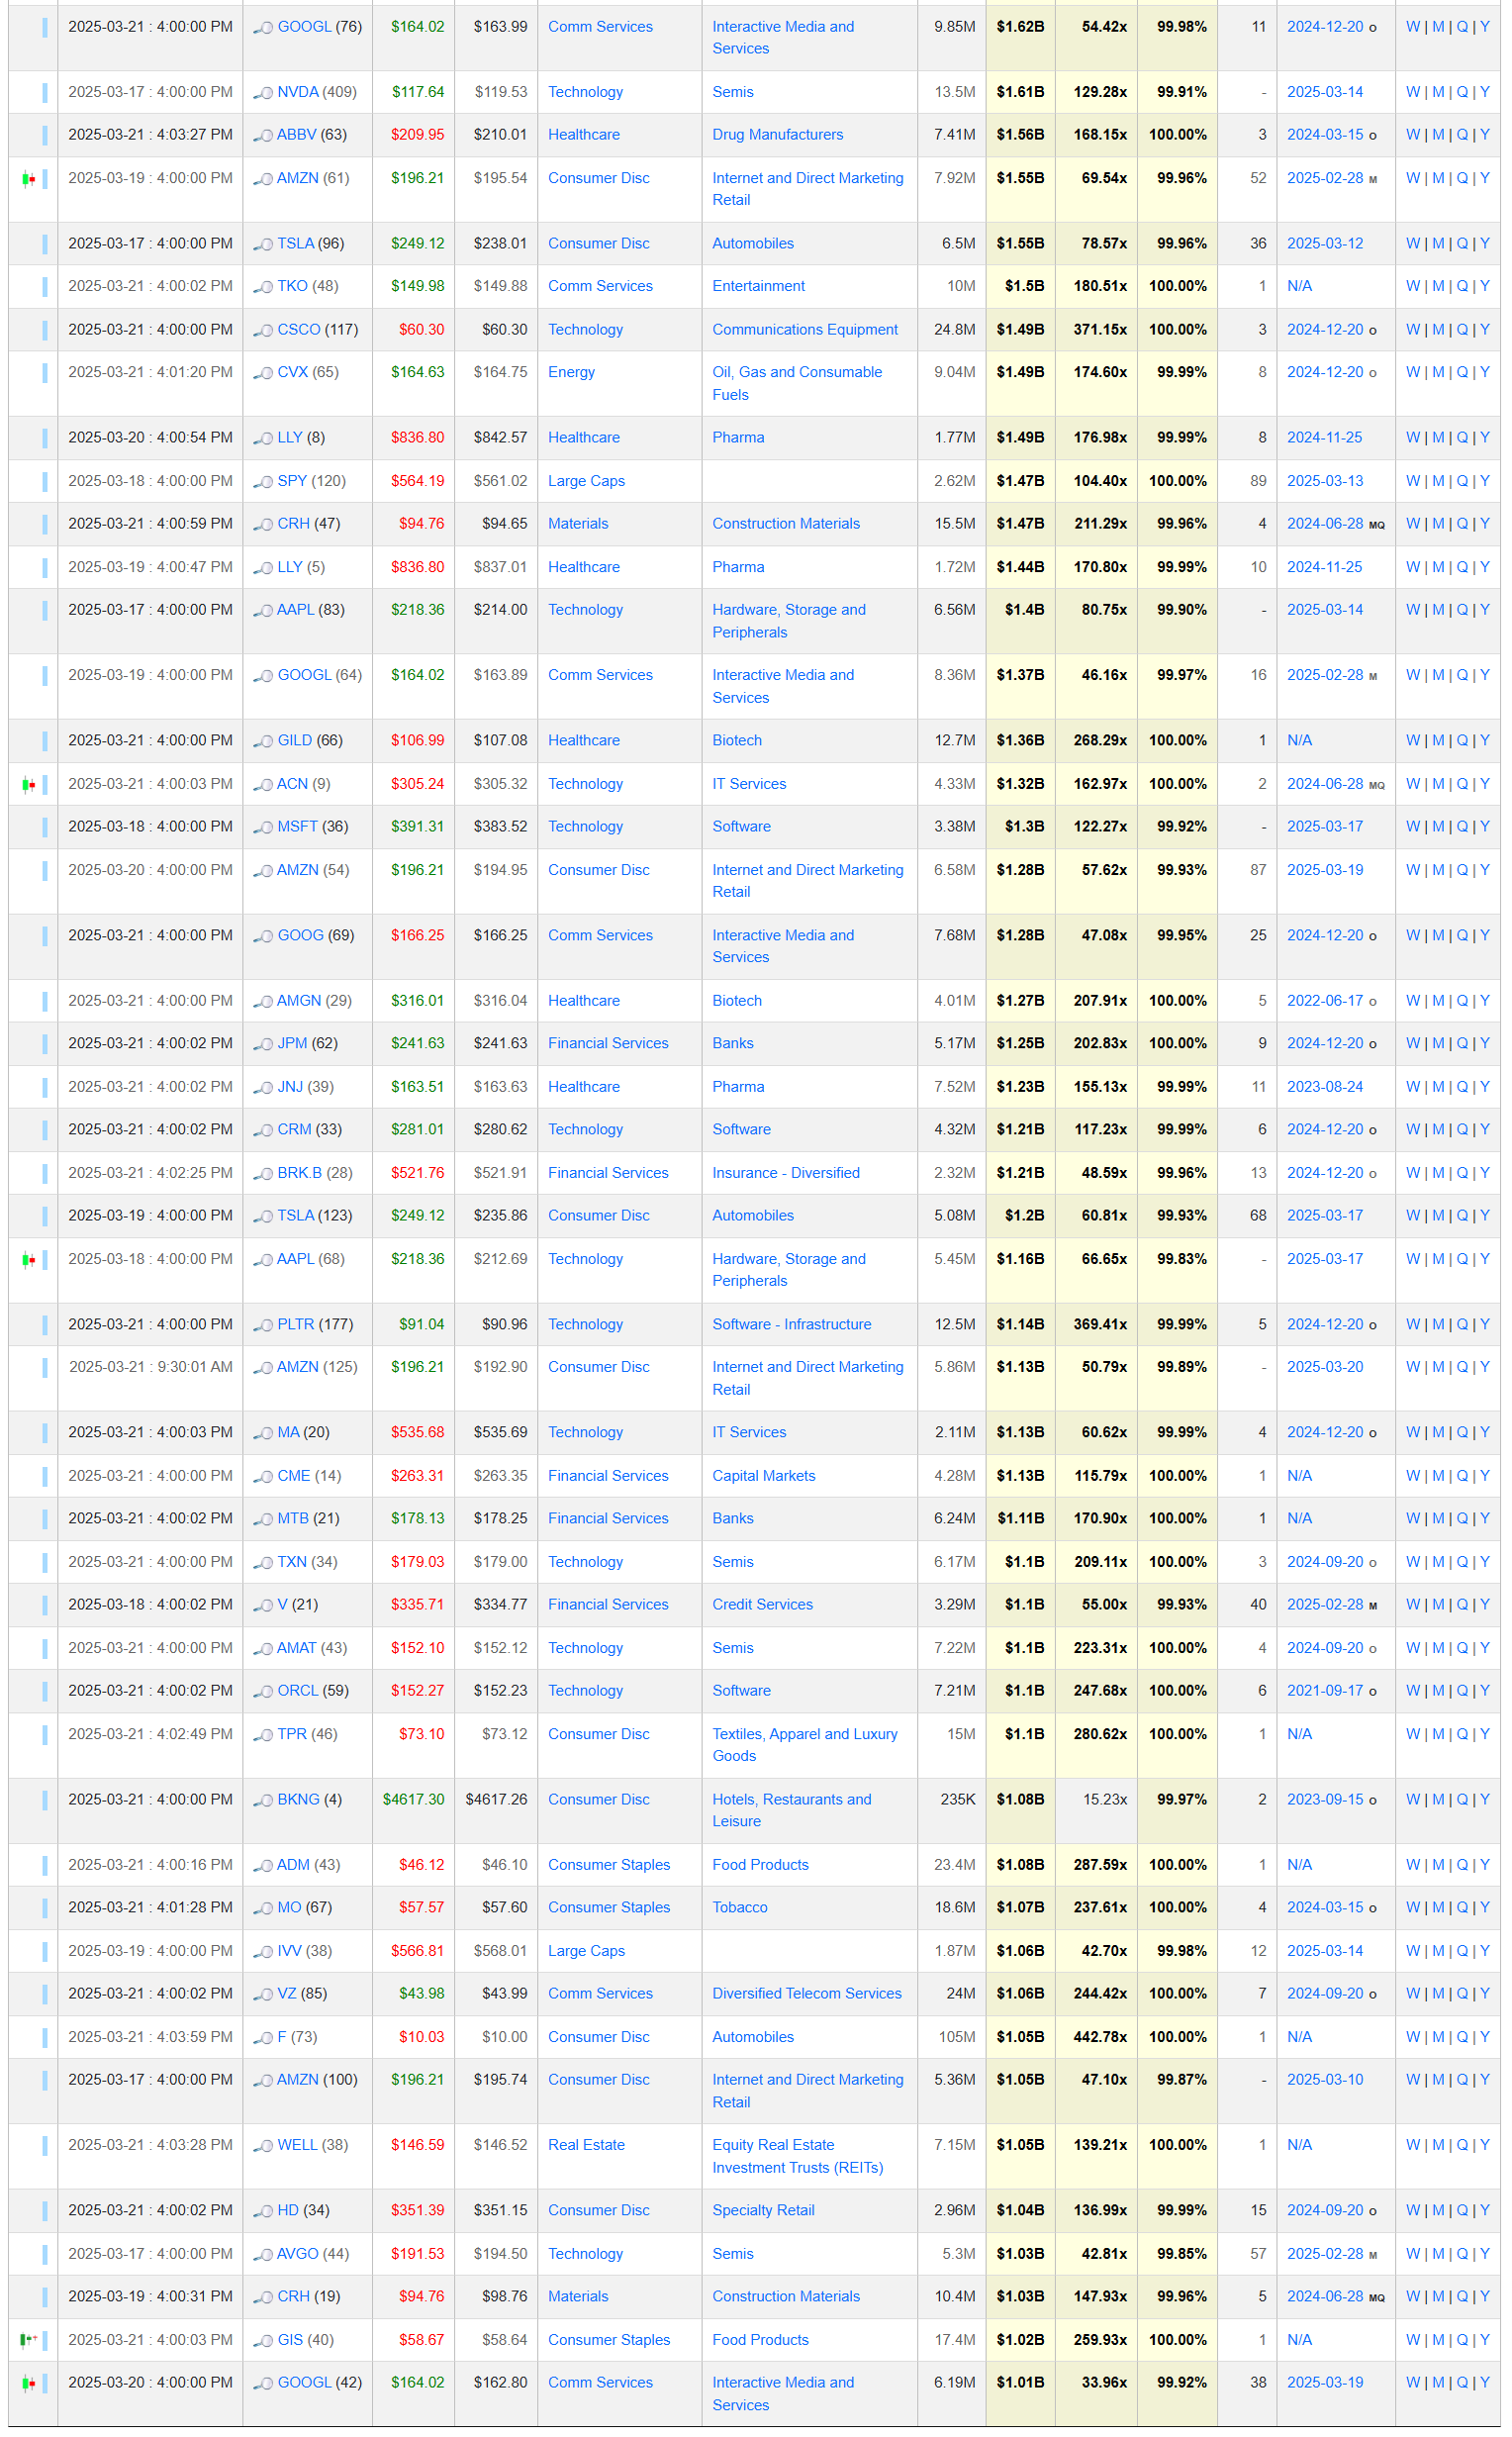
Top Institutional Order Flow In Equities
These are incredibly important charts to watch as they contains lots of nuanced suggestions at a thematic level. Watch these charts closely week-to-week to stay informed about where institutional money is flowing, adjust your strategies based on momentum, align your portfolio with macroeconomic and market trends, and manage risks more effectively by avoiding sectors losing institutional favor.
Sector Rotation Insights: The chart highlights which sectors are attracting institutional activity and which are losing favor. Institutions often lead market trends, so tracking shifts in their focus can indicate sector rotations.
Sentiment Analysis: The level of institutional activity reflects confidence in specific sectors. Rising activity in traditionally defensive sectors (e.g., healthcare, utilities) may indicate caution, while a surge in growth sectors (e.g., technology, consumer discretionary) could suggest optimism.
Emerging Trends: Sudden spikes in a previously overlooked sector, like industrials or consumer staples, might hint at emerging opportunities or structural shifts.
Macro Themes: Changes in sector activity often align with broader macroeconomic themes like inflation, interest rates, or geopolitical events. For instance:
Increased activity in energy might indicate concerns about oil supply or rising prices.
Growth in technology could align with innovations or favorable policies.
Risk Management: Declining institutional activity in a sector might signal weakening fundamentals or heightened risks.
Spotting Overcrowding: Excessive activity in a single sector over multiple weeks may suggest overcrowding, which could lead to heightened volatility if institutions begin to exit.
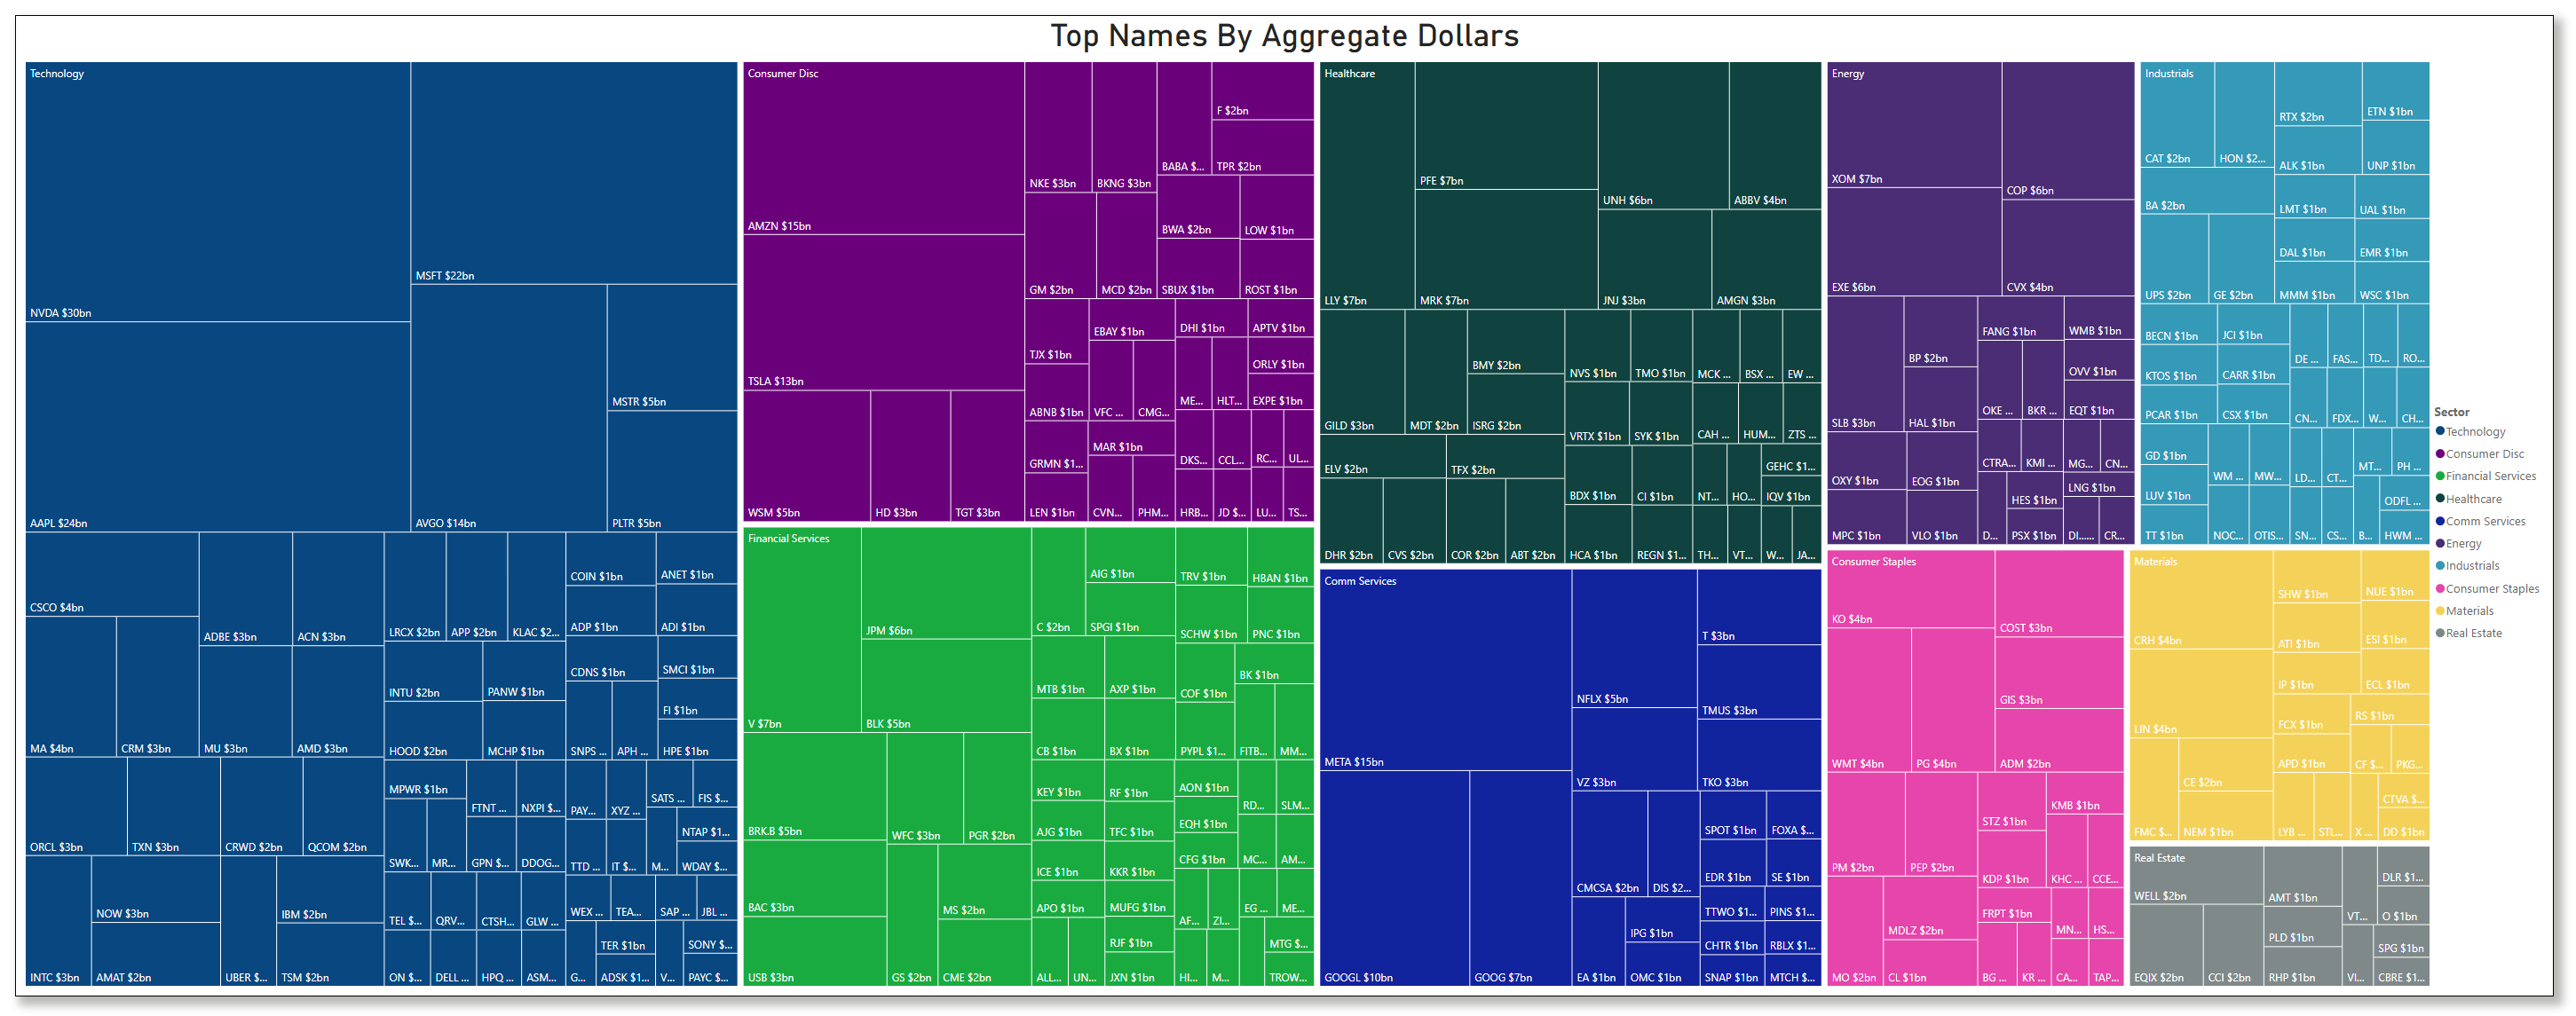
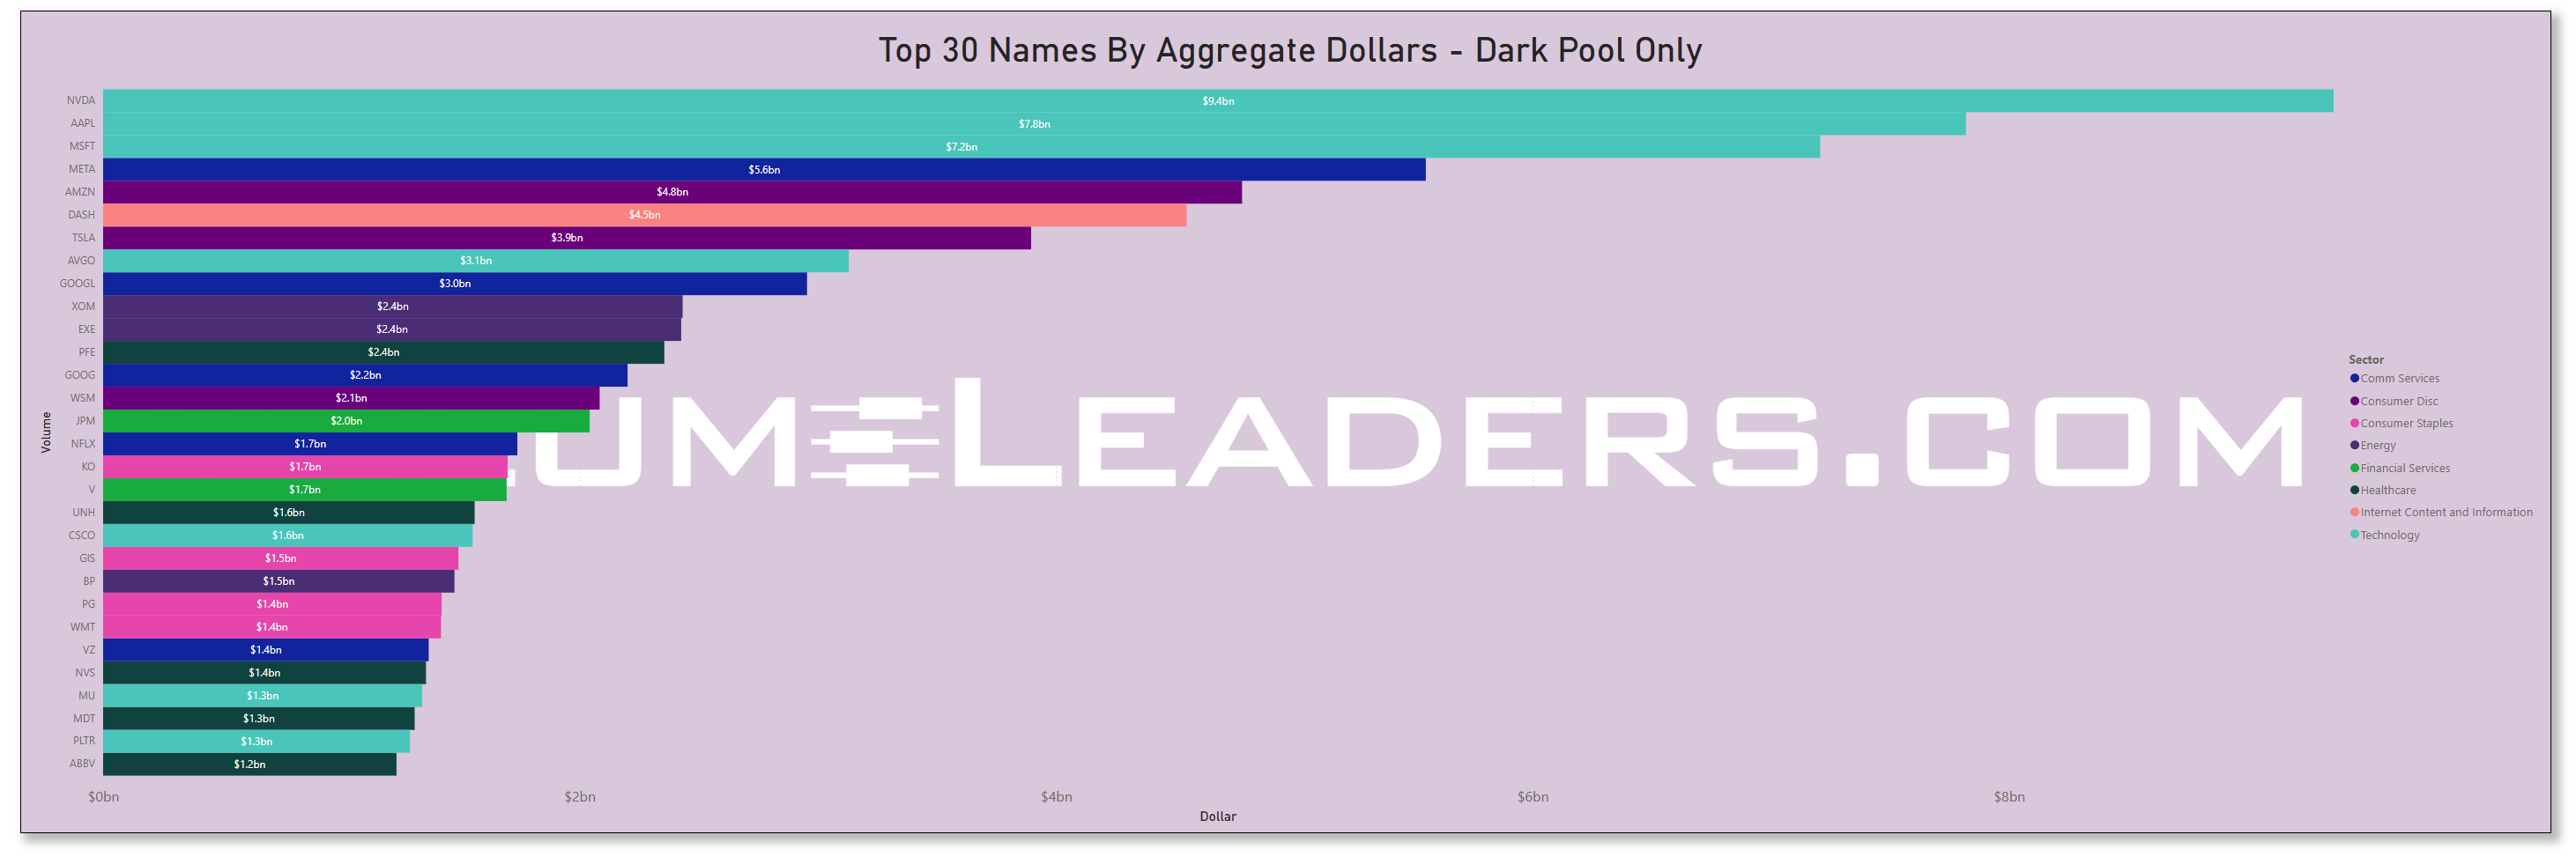
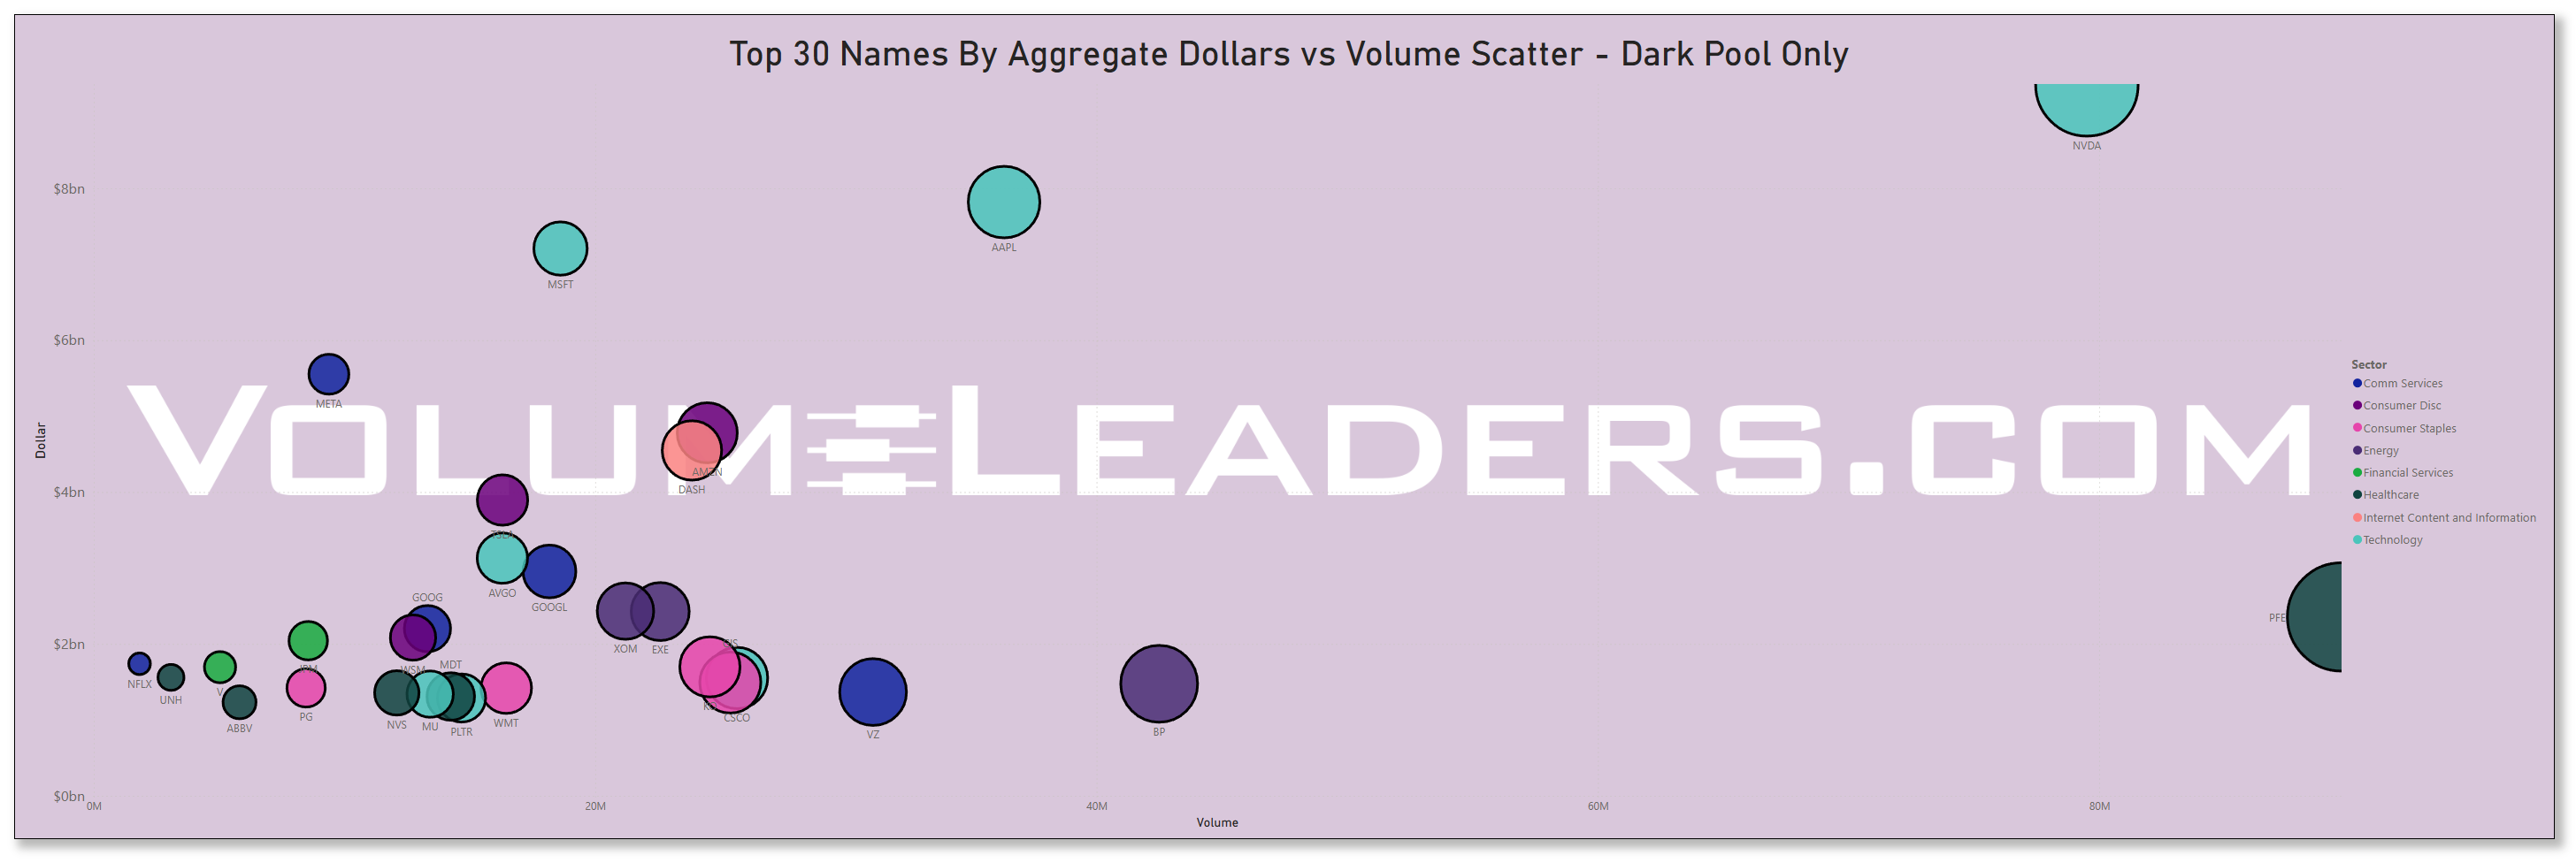
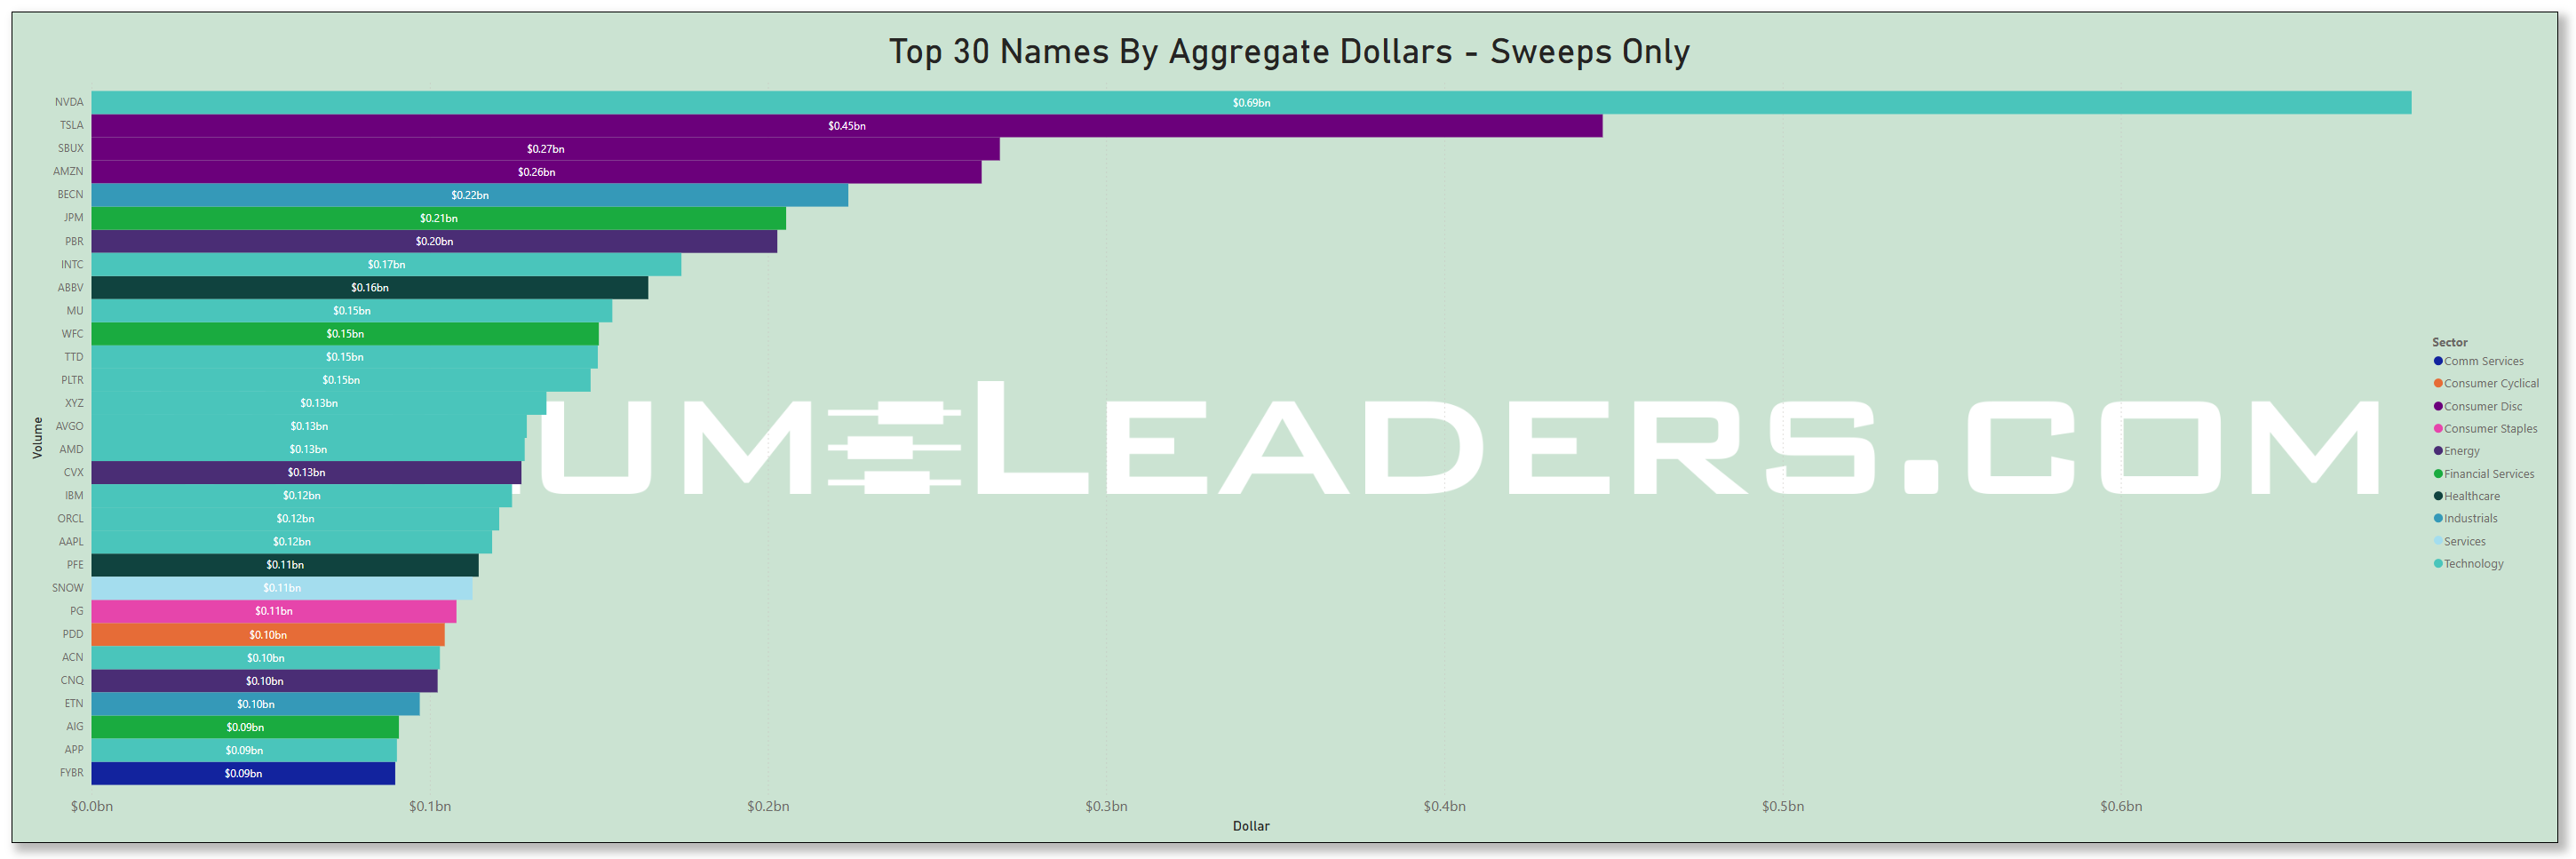
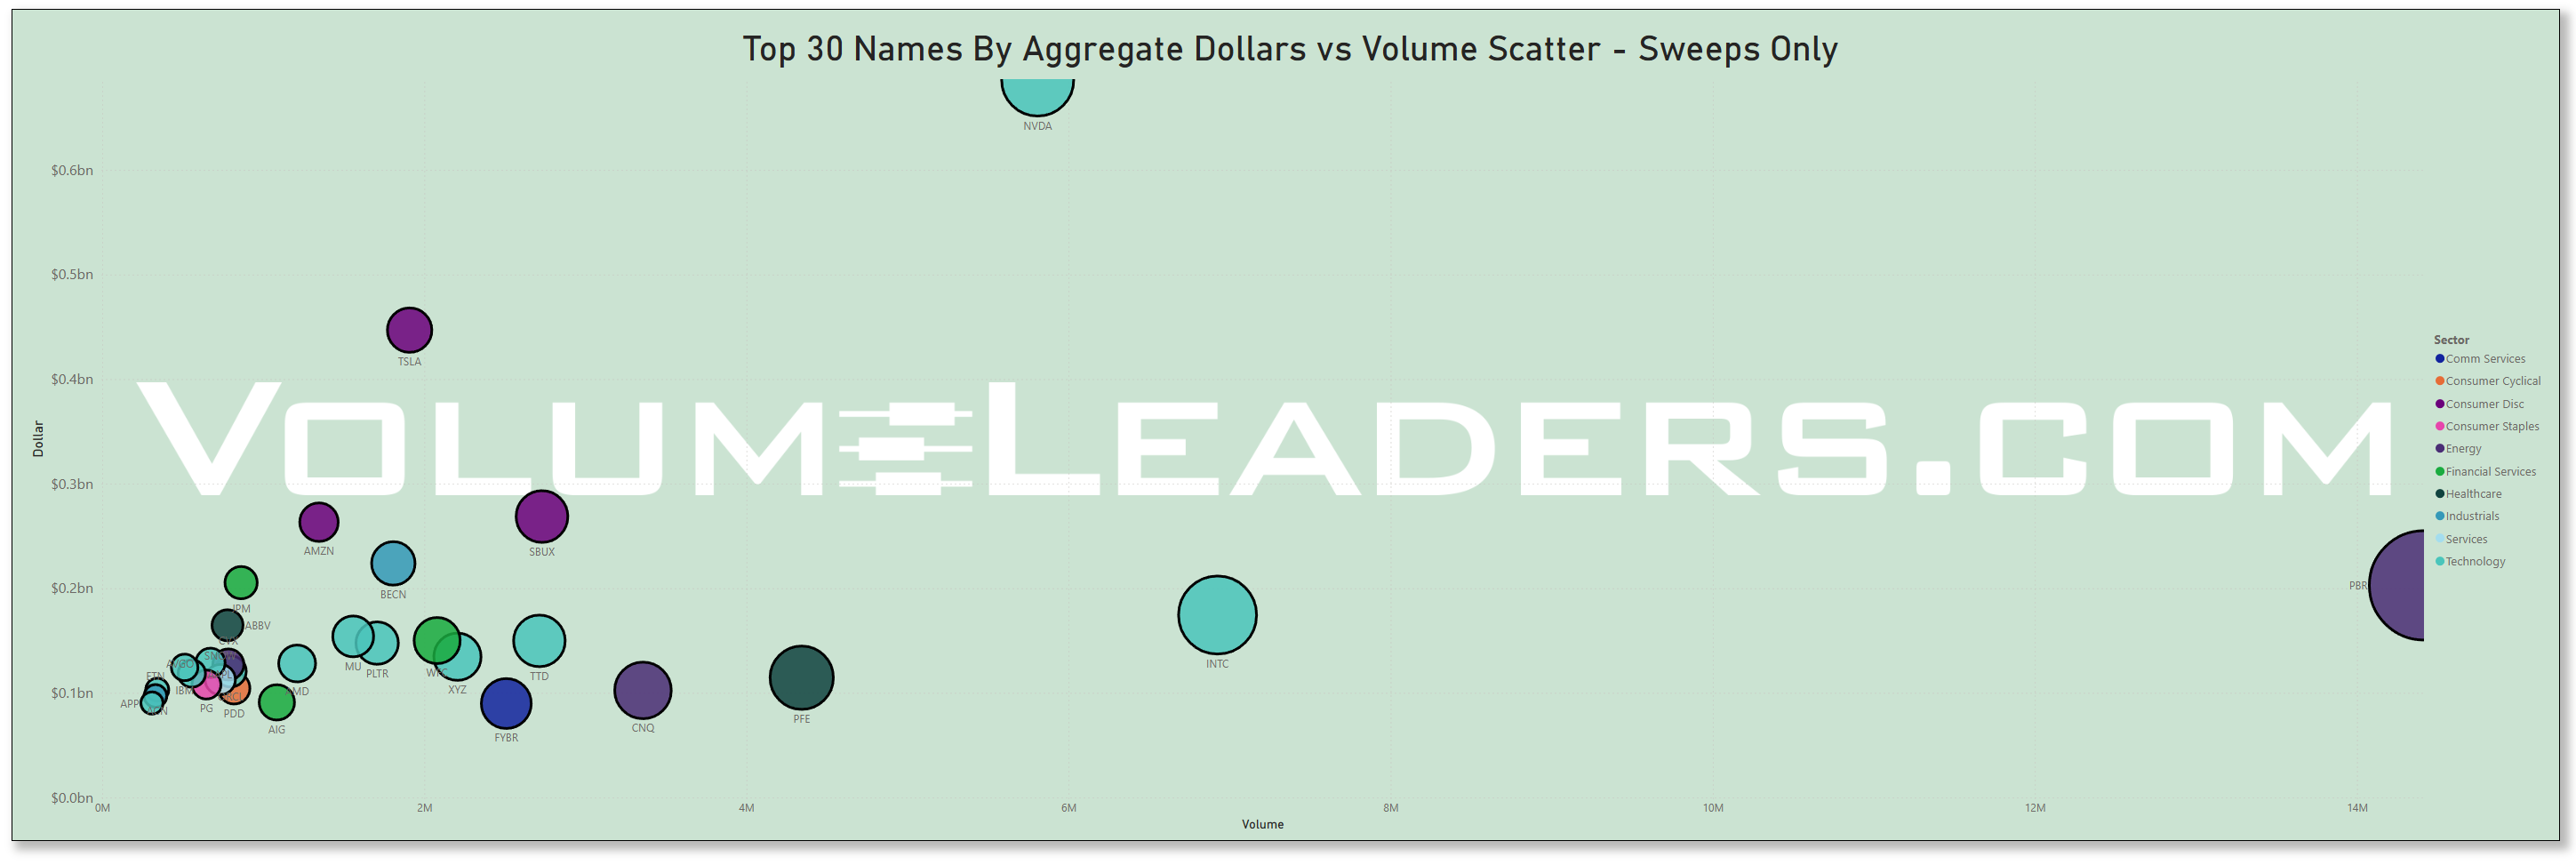
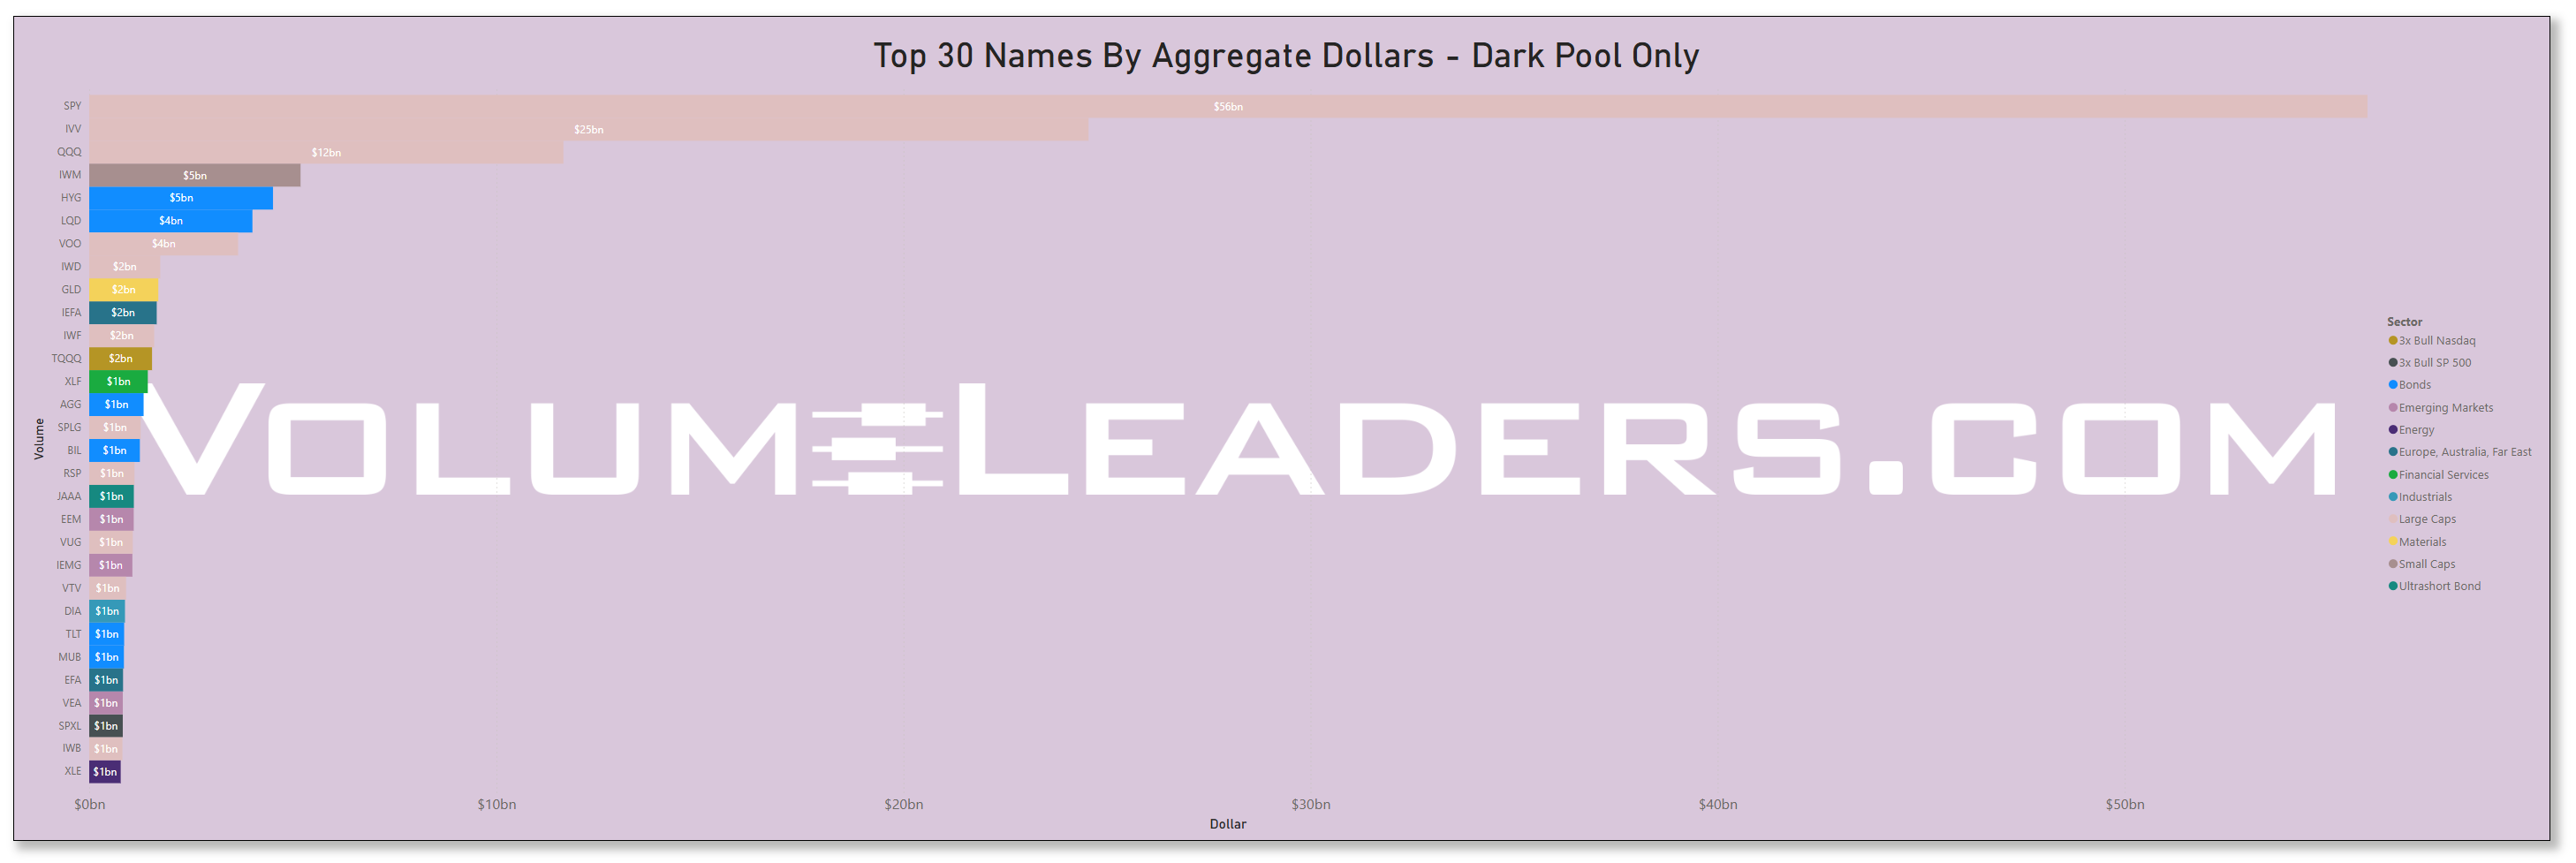
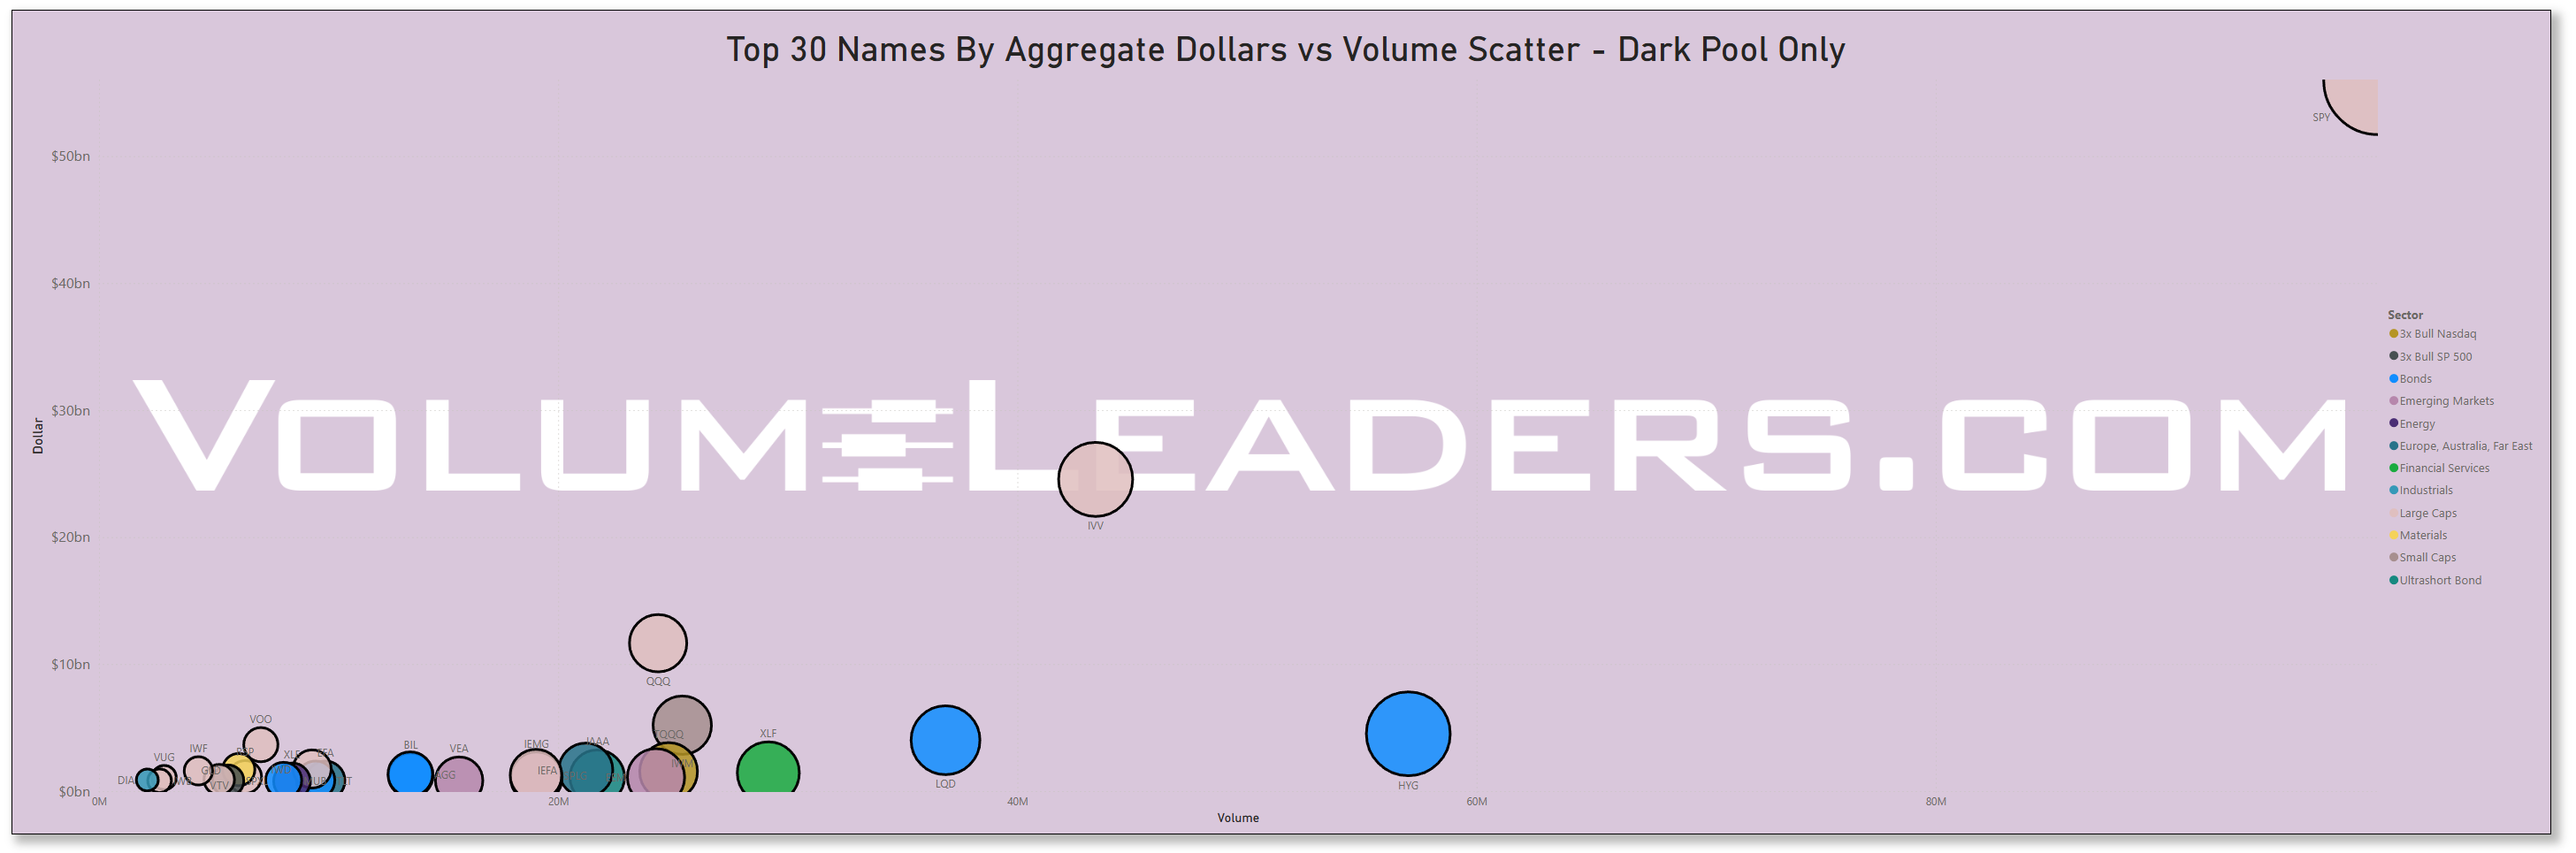
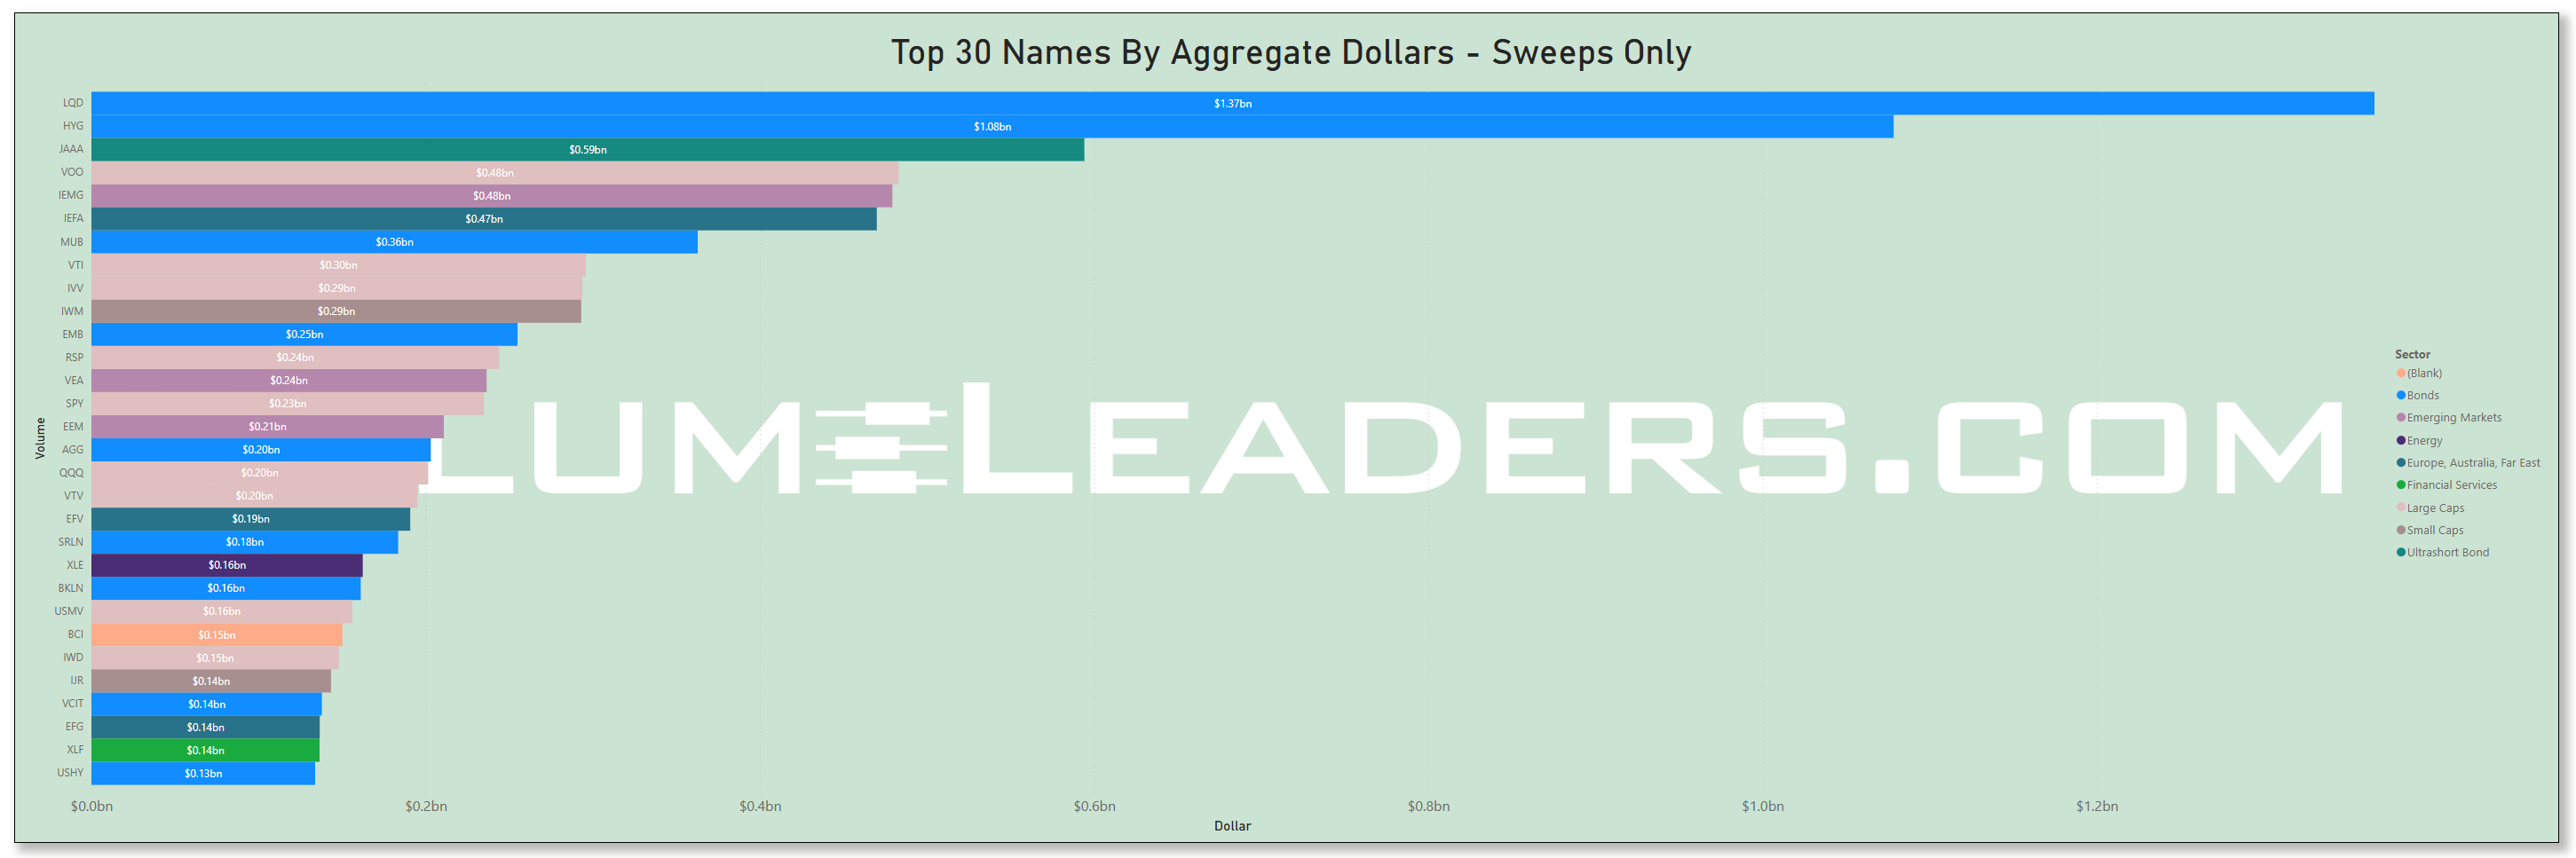
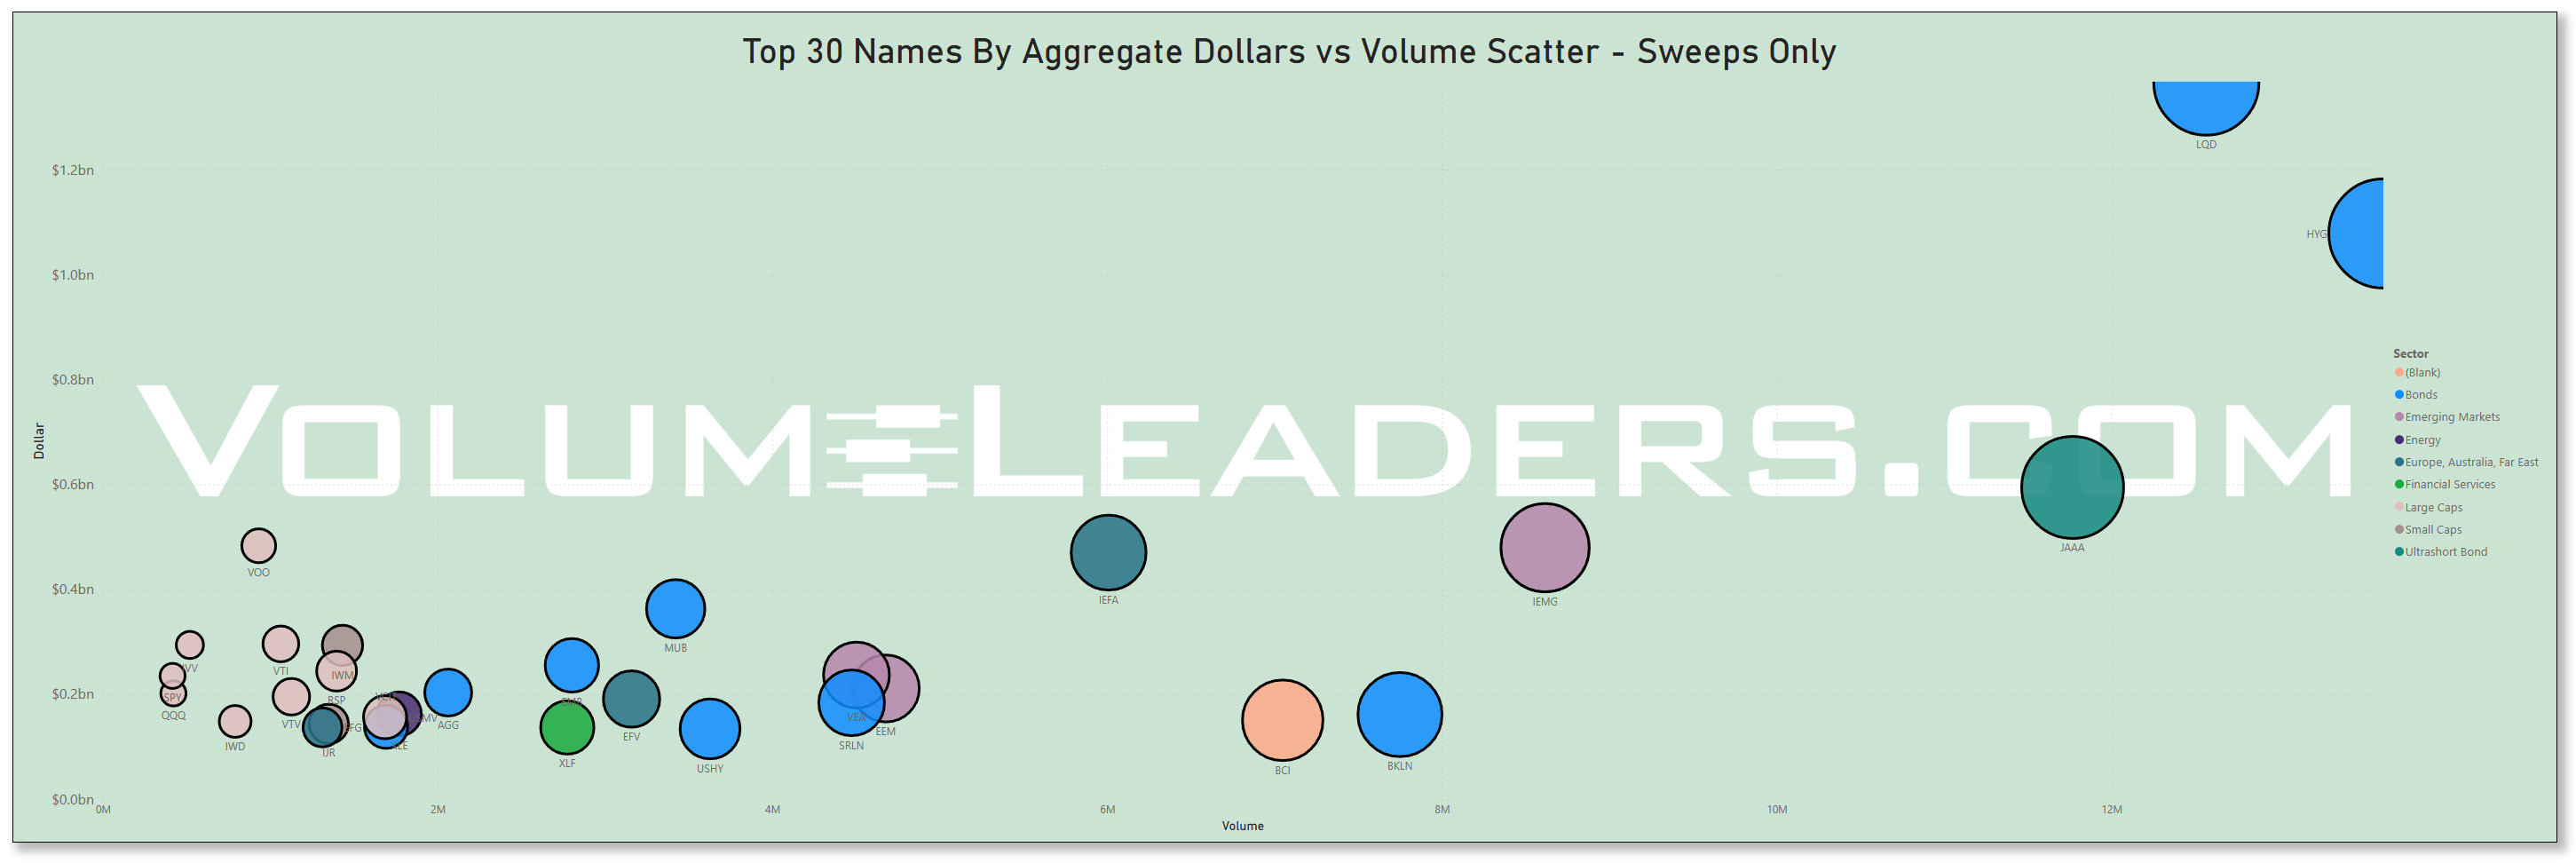
Many excellent trade ideas and sources of inspiration can be found in these prints below. While only the top 30 from each group are displayed, the complete results are accessible in VolumeLeaders.com for you to explore at your convenience any time. Remember to configure trade alerts within the platform to ensure institutional order flows that capture your interest or are significant to you aren’t missed. The blue charts encompass all types of trades, including blocks on lit exchanges; the purple charts exclusively depict dark pool trades; and the green charts represent sweeps only.
Top Institutional Order Flow In ETFs
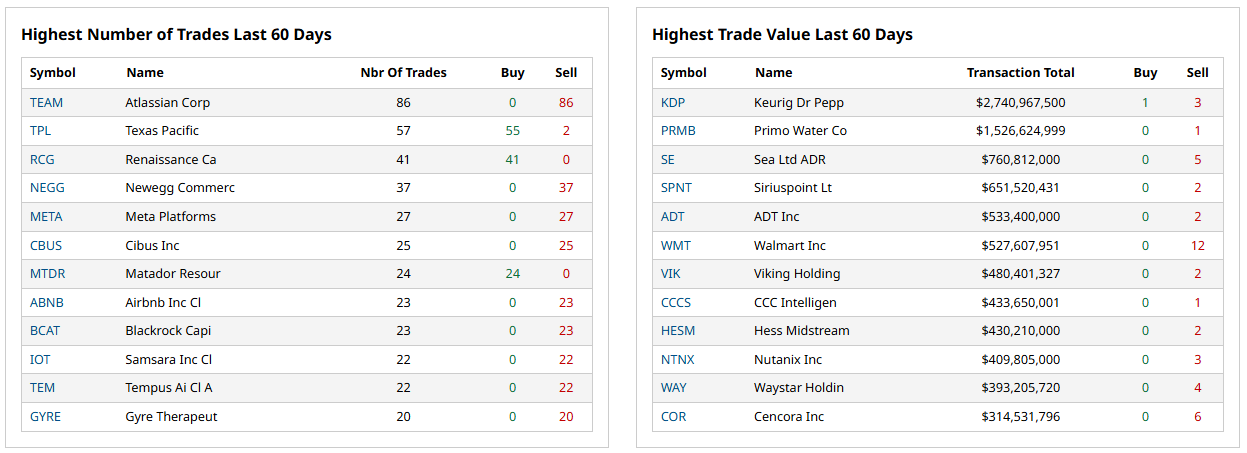
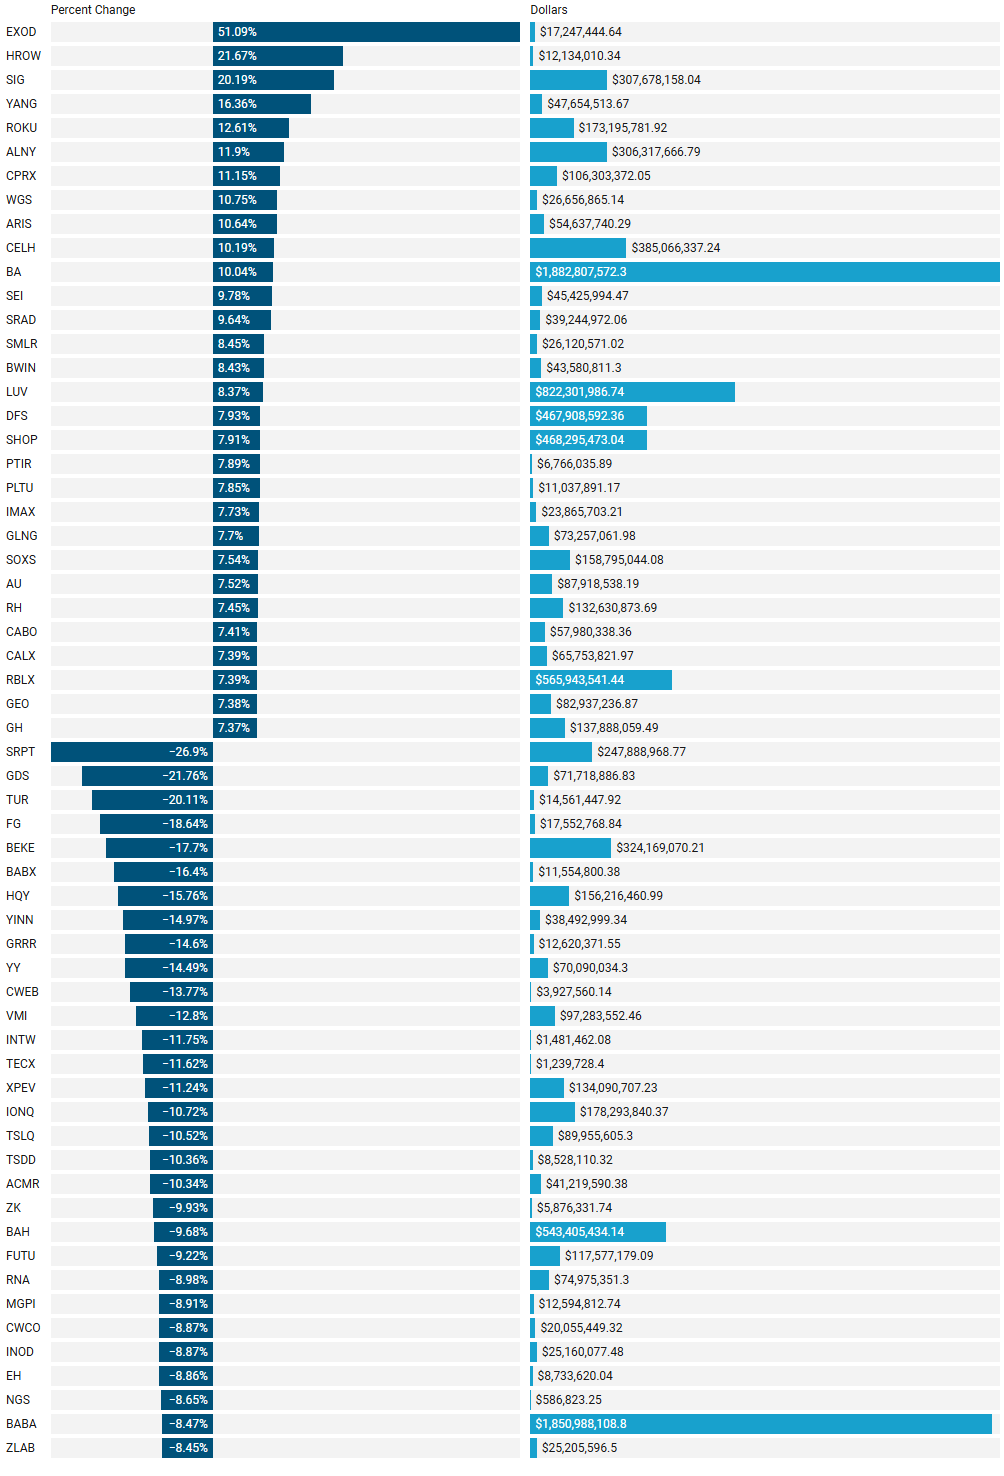
Last Week’s Institutionally-Backed Gainers & Losers
If you’re going to bet on a name, consider one that is officially endorsed by an institution! These are the top percent gainers (green) and percent losers (red) from this week’s open-to-close that had a trade price greater than $20 and institutional involvement. Continue watching tickers from this and prior stacks as these names frequently turn into multi-leg trades with a lot of movement!
Last Week’s Billion-Dollar Prints
Tickers that printed a trade worth at least $1B last week get a special shout-out. These are massive commitments by institutions that should not be ignored.
Statistical Analysis of Ranked Trades For OPEX Week
📊 Overall Summary
The analyzed dataset is limited to trades ranked 25 or higher. It contains 1,981 institutional trades that in aggregate represent $334.22 billion in capital movement across 1,487 unique ticker symbols. The average trade size is $168.71 million.
Total Trades Analyzed: 1,981
Unique Tickers: 1,487
Total Dollar Value Traded: $334.22 billion
Average Dollar Value per Trade: ~$168.7 million
Median Dollar Value per Trade: ~$46.97 million
Largest Single Trade: $7.36 billion
Smallest Single Trade: $506,014
Rank Distribution and Analysis
Top-ranked trades (Rank 1) account for only 6.46% of all trades but represent 20.52% of total dollar value ($68.59 billion), with an average size of $535.82 million.
Ranks 1-5 collectively account for 31.19% of all trades but represent 51.66% of total dollar value, indicating that higher-ranked trades command significantly larger positions.
The correlation coefficient between rank and trade value is -0.1910, confirming a moderate negative correlation (higher-ranked trades tend to have larger dollar values).
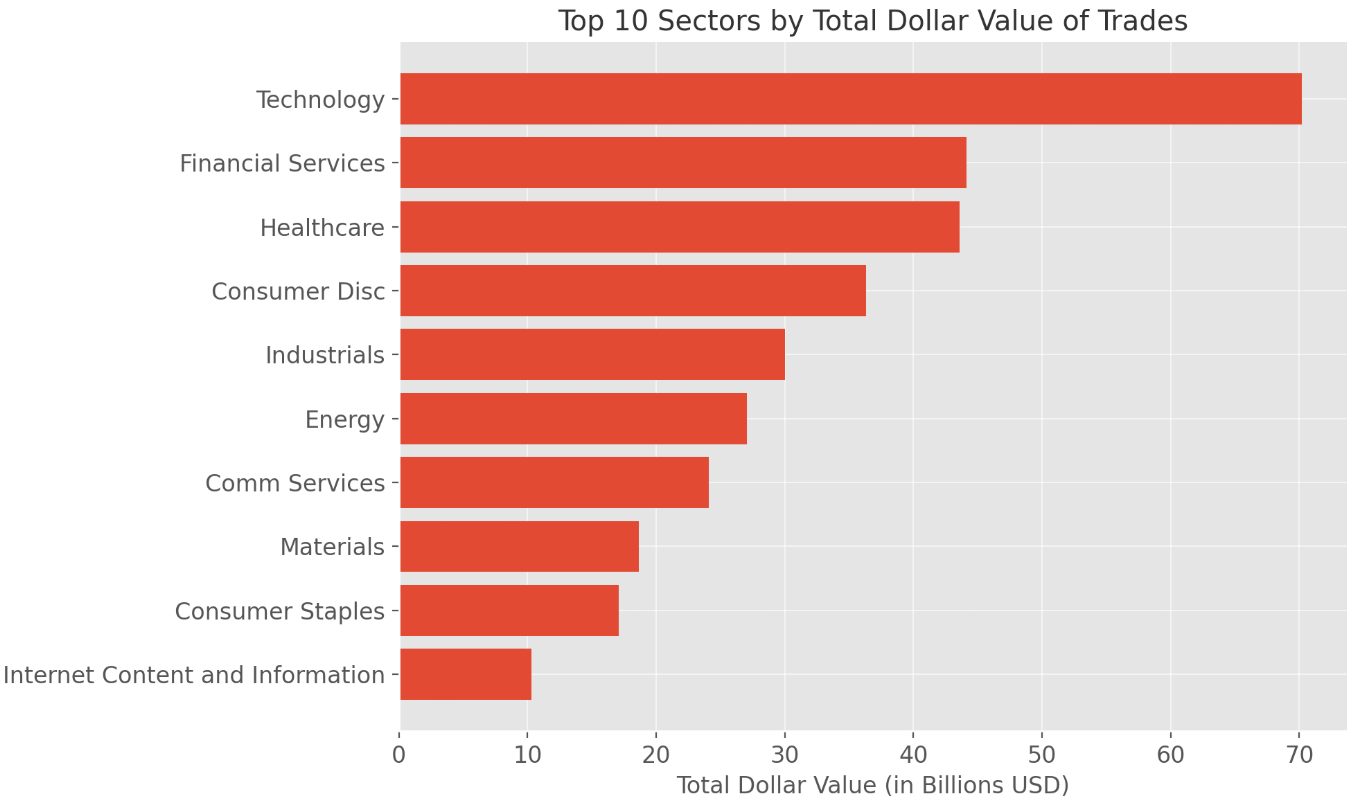
Sector Distribution and Concentration
The institutional trading activity is well-distributed across sectors with a Herfindahl-Hirschman Index (HHI) of 1,174.36, well below the 2,500 threshold for high concentration.
Technology leads with $70.2 billion (21.00% of total value) across 332 trades, but only 16 of these are top-ranked (Rank 1).
Financial Services follows with $44.1 billion (13.21%) across 322 trades with 29 top-ranked positions.
Industry Analysis
Semiconductor industry leads with $22.1 billion (6.62% of total value) across 47 trades, but only 1 top-ranked position.
Oil, Gas and Consumable Fuels follows with $20.2 billion (6.03%) across 66 trades with 4 top-ranked positions.
Pharmaceutical industry shows $18.1 billion (5.40%) across just 21 trades, averaging $859.6 million per trade.
Food Products industry demonstrates strong institutional conviction with 22.58% of its trades having Rank 1 status.
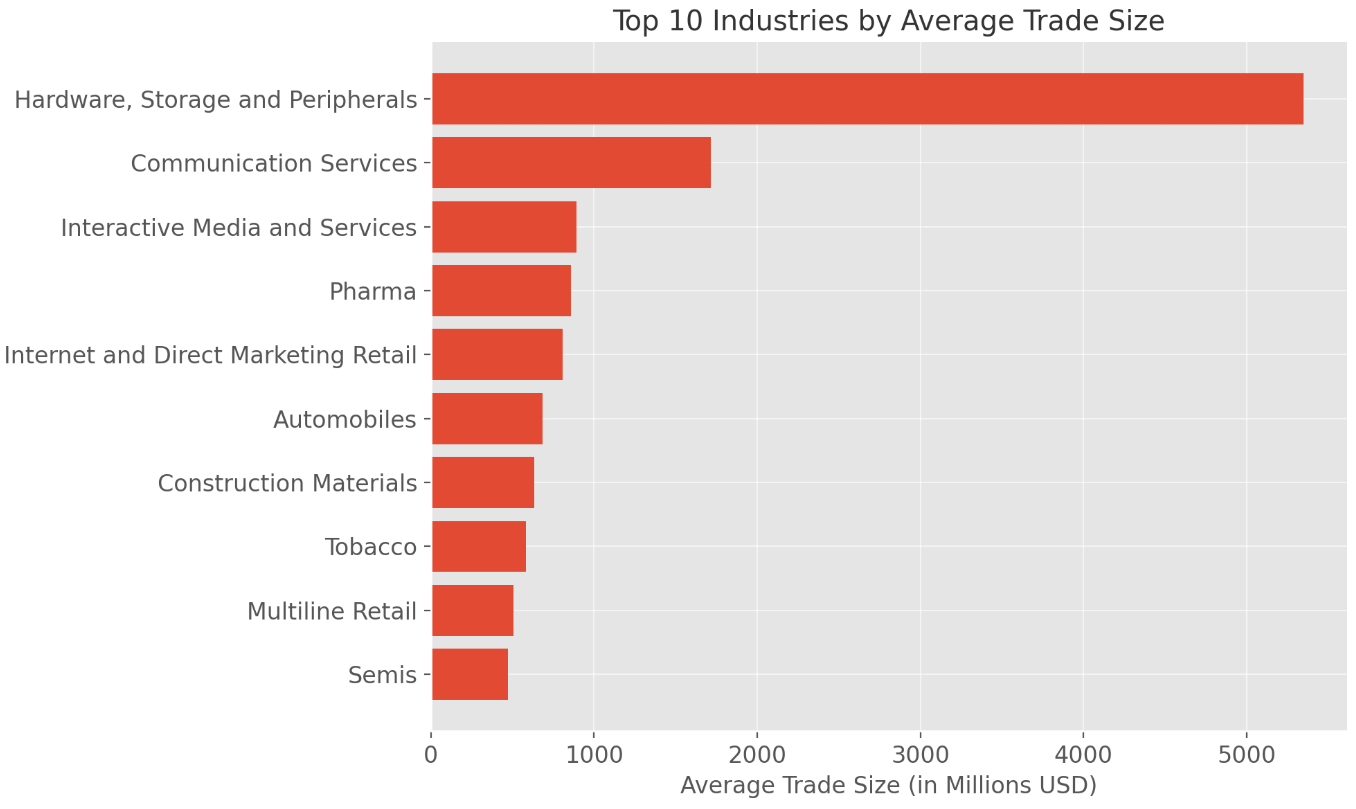
Top 10 Industries by Average Trade Size
Internet Content and Information had the largest average trade size, exceeding $3 billion per trade—driven by a few massive block trades.
Communication Services, Energy, Consumer Staples, and Healthcare also stood out, each with average trades between $270M and $360M.
These high average sizes indicate fewer but more concentrated trades—often a signal of high conviction or illiquidity.

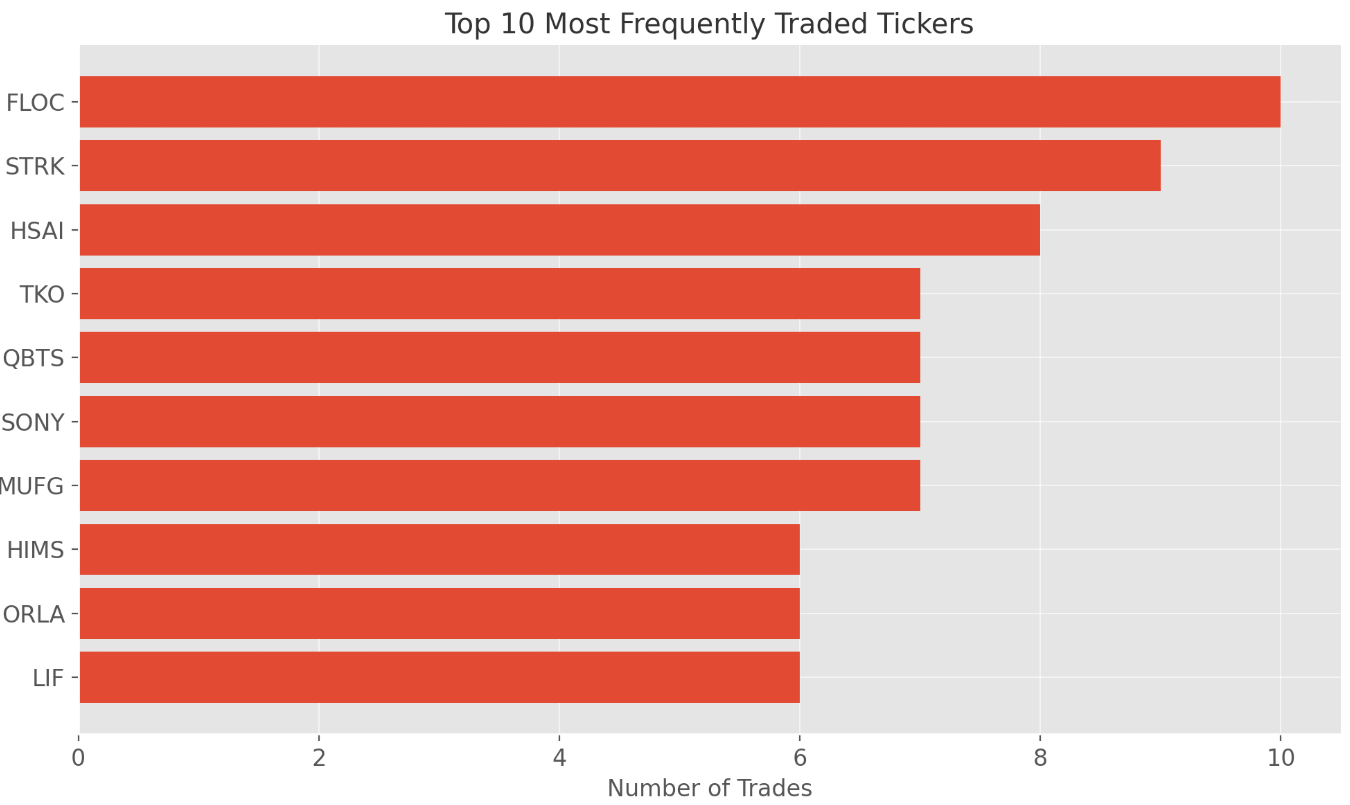
Ticker Frequency Analysis
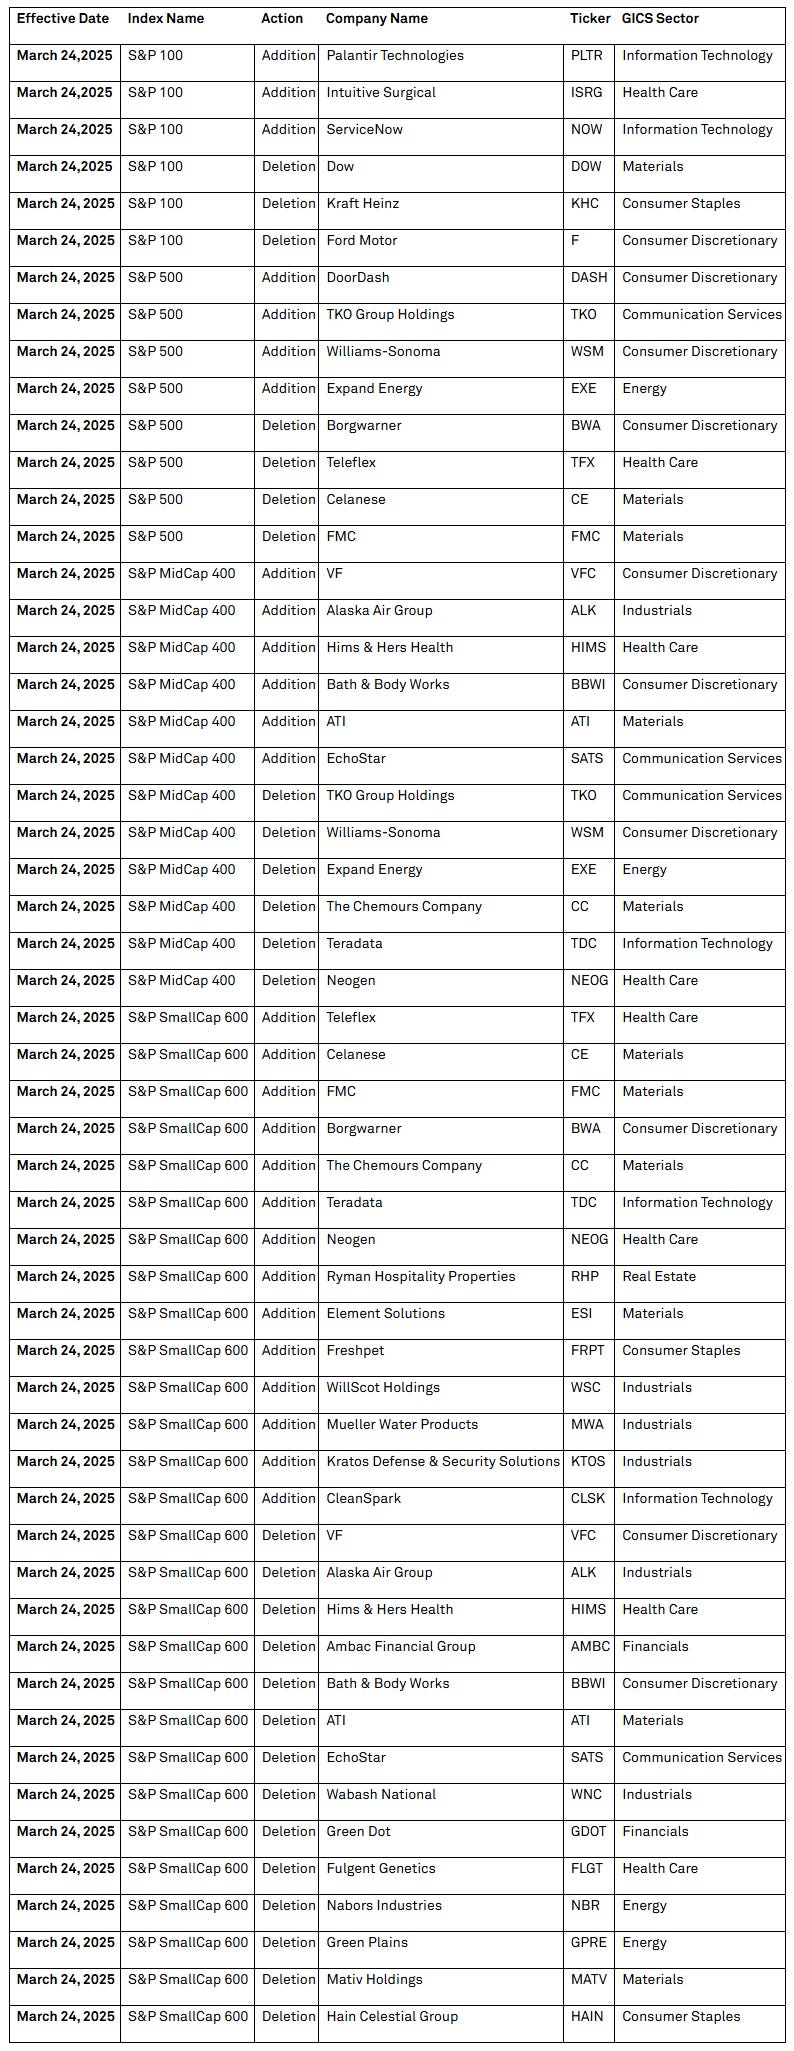
Several tickers show unusual patterns of repeated institutional interest. It’s worth noting that several new companies are joining the S&P 500: FLOC, WSM, TKO and DASH.
FLOC (Industrials/Oilfield Services): Highest frequency with 10 trades, including one top-ranked position, though modest total value ($99.1 million).
STRK (Technology): 9 trades but no top-ranked positions, with modest total value ($42.6 million).
MUFG (Mitsubishi UFJ Financial Group): 7 trades worth 705 million in aggregate.
DASH (Internet Content): 6 trades with extraordinary total value ($10.3 billion), including a top-ranked position worth $7.36 billion - the largest trade on OPEX.
EXOD (Technology/Software Infrastructure): 5 trades with 3 of them top-ranked, suggesting high conviction despite smaller total value ($45.8 million).
EXE (Energy/Oil & Gas): 5 trades totaling $4.22 billion including one top-ranked position of $2.92 billion.
Here is the full list of S&P index changes scheduled to be in effect by the open on March, 24th:
Trade Size Distribution
Small trades ($0-50M): 51.74% of trade count but only 5.86% of total value
Medium trades ($50M-500M): 40.88% of trade count and 39.65% of total value
Large trades ($500M+): 7.37% of trade count but 54.49% of total value
Only 2 trades (0.10%) exceeded $5 billion, accounting for 3.80% of total value (AAPL & DASH)
Temporal Analysis
OPEX day (March 21, 2025) accounted for 84.86% of all trades and 91.12% of total value, showing a dramatic increase vs the rest of the week.
This single day saw 124 top-ranked trades with a total value of $304.54 billion.
Average trade size increased from $21.45 million on March 17 to $181.17 million on March 21, representing an 844% increase.
Key Statistical Insights
The data shows clear institutional preference for Technology, Financial Services, and Healthcare sectors, though conviction (as measured by rank) varies significantly.
Highest conviction trades (Rank 1) are disproportionately concentrated in Financial Services, Energy, and Consumer Staples.
Large-cap trades dominate value, with just 7.37% of trades accounting for 54.49% of total capital deployment.
Repeated positioning in specific tickers (FLOC, MUFG, STRK, HSAI, TKO, DASH) across multiple trades and days indicates strong and sustained institutional interest.
Investments In Focus: Bull vs Bear Arguments
Institutions leave footprints that VolumeLeaders.com can illustrate for you while providing context to assess things like institutional conviction and urgency. Theses and data given below are not financial advice, just personal observations that may be wrong; consult a certified financial advisor before making any investment decisions.
CDNS 0.00%↑
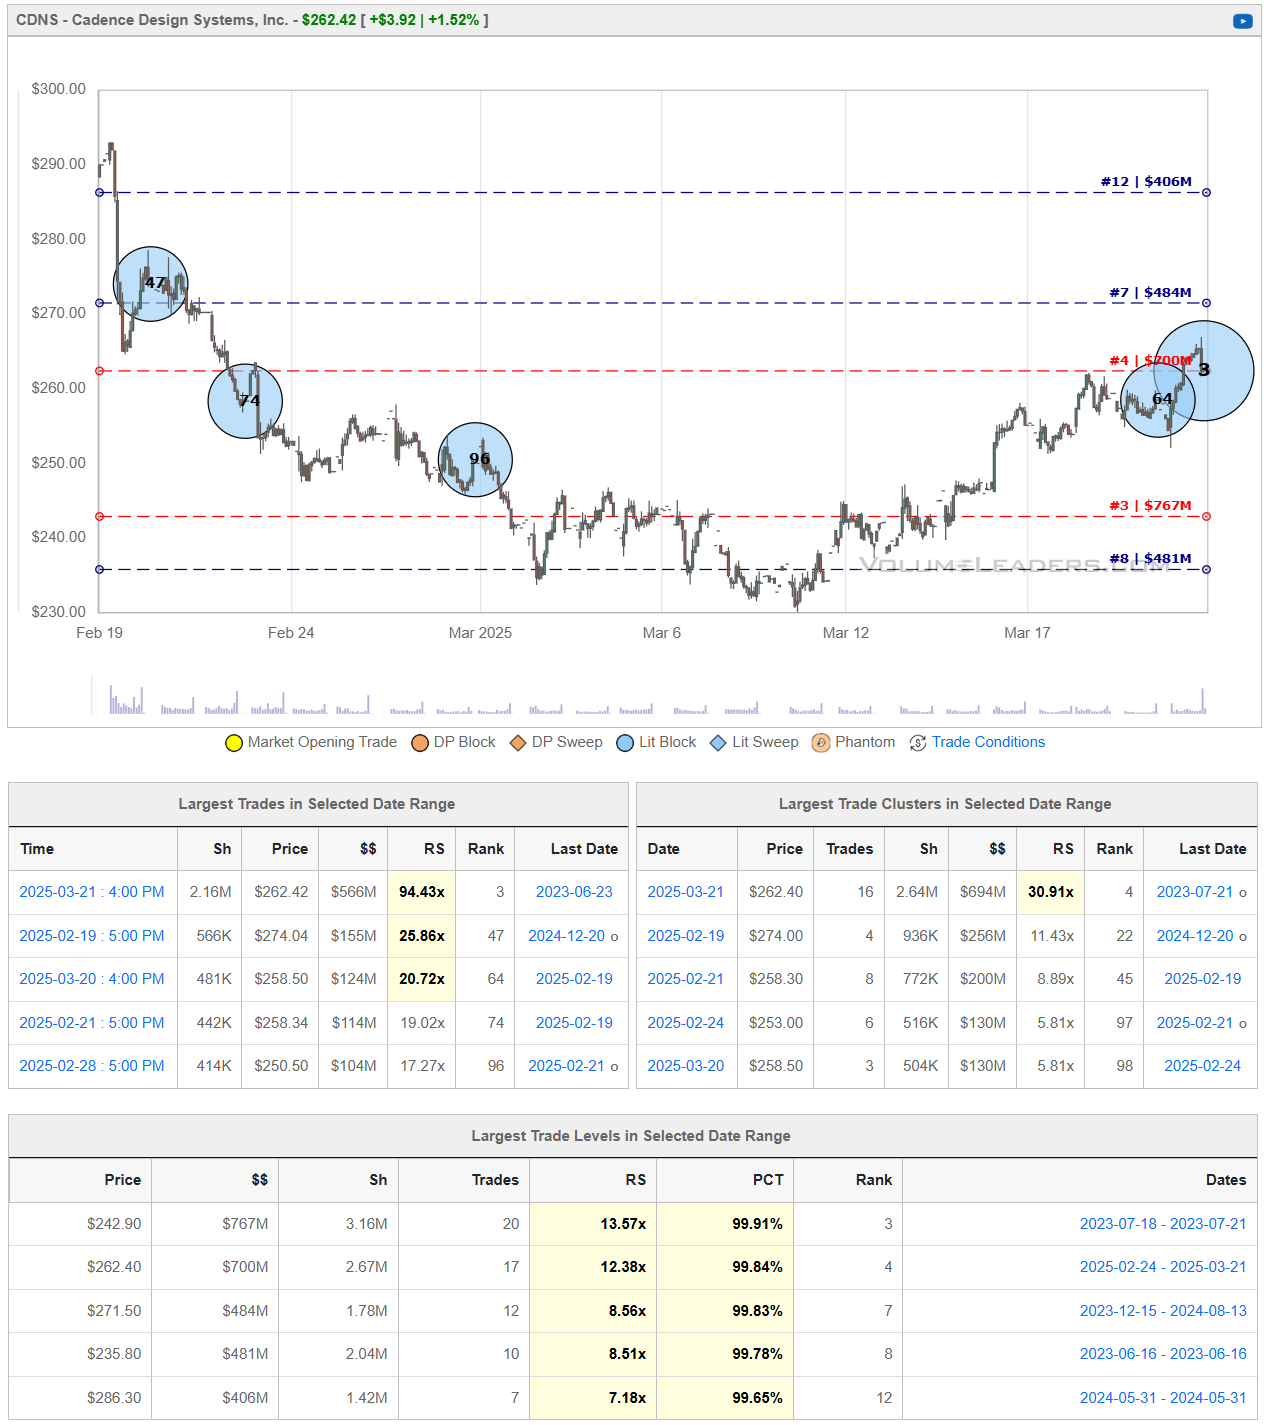
Cadence Design Systems, Inc. (NASDAQ: CDNS) is a leading provider of electronic design automation (EDA) software, hardware, and silicon intellectual property (IP) for designing integrated circuits and systems. The company's tools and services are essential for semiconductor and electronics companies to develop advanced chips and electronic systems.
Recent Developments:
Financial Performance:
Q4 2024 Results: Cadence reported revenue of $1.36 billion for the fourth quarter of 2024, marking a 26.8% year-over-year increase. Adjusted earnings per share (EPS) were $1.88, surpassing analyst expectations of $1.82.
Full-Year 2024: The company achieved annual revenue of $4.641 billion, reflecting a 13.48% increase from the previous year.
2025 Outlook:
Cadence projects fiscal 2025 revenue between $5.14 billion and $5.22 billion, slightly below analysts' expectations of $5.25 billion. The anticipated annual profit is in the range of $6.65 to $6.75 per share, compared to the predicted $6.83 per share.
Market Performance:
On March 21, 2025, Cadence's stock closed at $262.42, up 1.52% from the previous day. Despite this uptick, the stock remains 20.23% below its 52-week high of $328.99, reached on June 20, 2024.
Bullish Perspective:
Robust Financial Growth: Cadence's consistent revenue and earnings growth demonstrate strong demand for its EDA tools and IP offerings, positioning the company well in the semiconductor industry's expansion.
AI Integration: The company's focus on AI-driven design tools caters to the increasing complexity of chip designs, potentially attracting a broader customer base seeking advanced solutions.
Market Leadership: Cadence's comprehensive suite of design tools and IP positions it as a leader in the EDA industry, with a strong reputation for innovation and reliability.
Bearish Perspective:
Soft 2025 Guidance: The company's conservative revenue and profit forecasts for 2025 suggest potential challenges in maintaining its growth trajectory, possibly due to market saturation or increased competition.
Stock Volatility: The significant gap between the current stock price and its 52-week high indicates potential volatility, which may concern investors seeking stable returns.
Competitive Pressures: The EDA industry is competitive, with players like Synopsys and emerging startups potentially challenging Cadence's market share, necessitating continuous innovation and strategic positioning.
In summary, Cadence Design Systems exhibits strong financial performance and a commitment to integrating advanced technologies like AI into its product offerings. However, cautious 2025 projections and a competitive landscape present challenges that investors should consider when evaluating the company's future prospects.
RDFN 0.00%↑
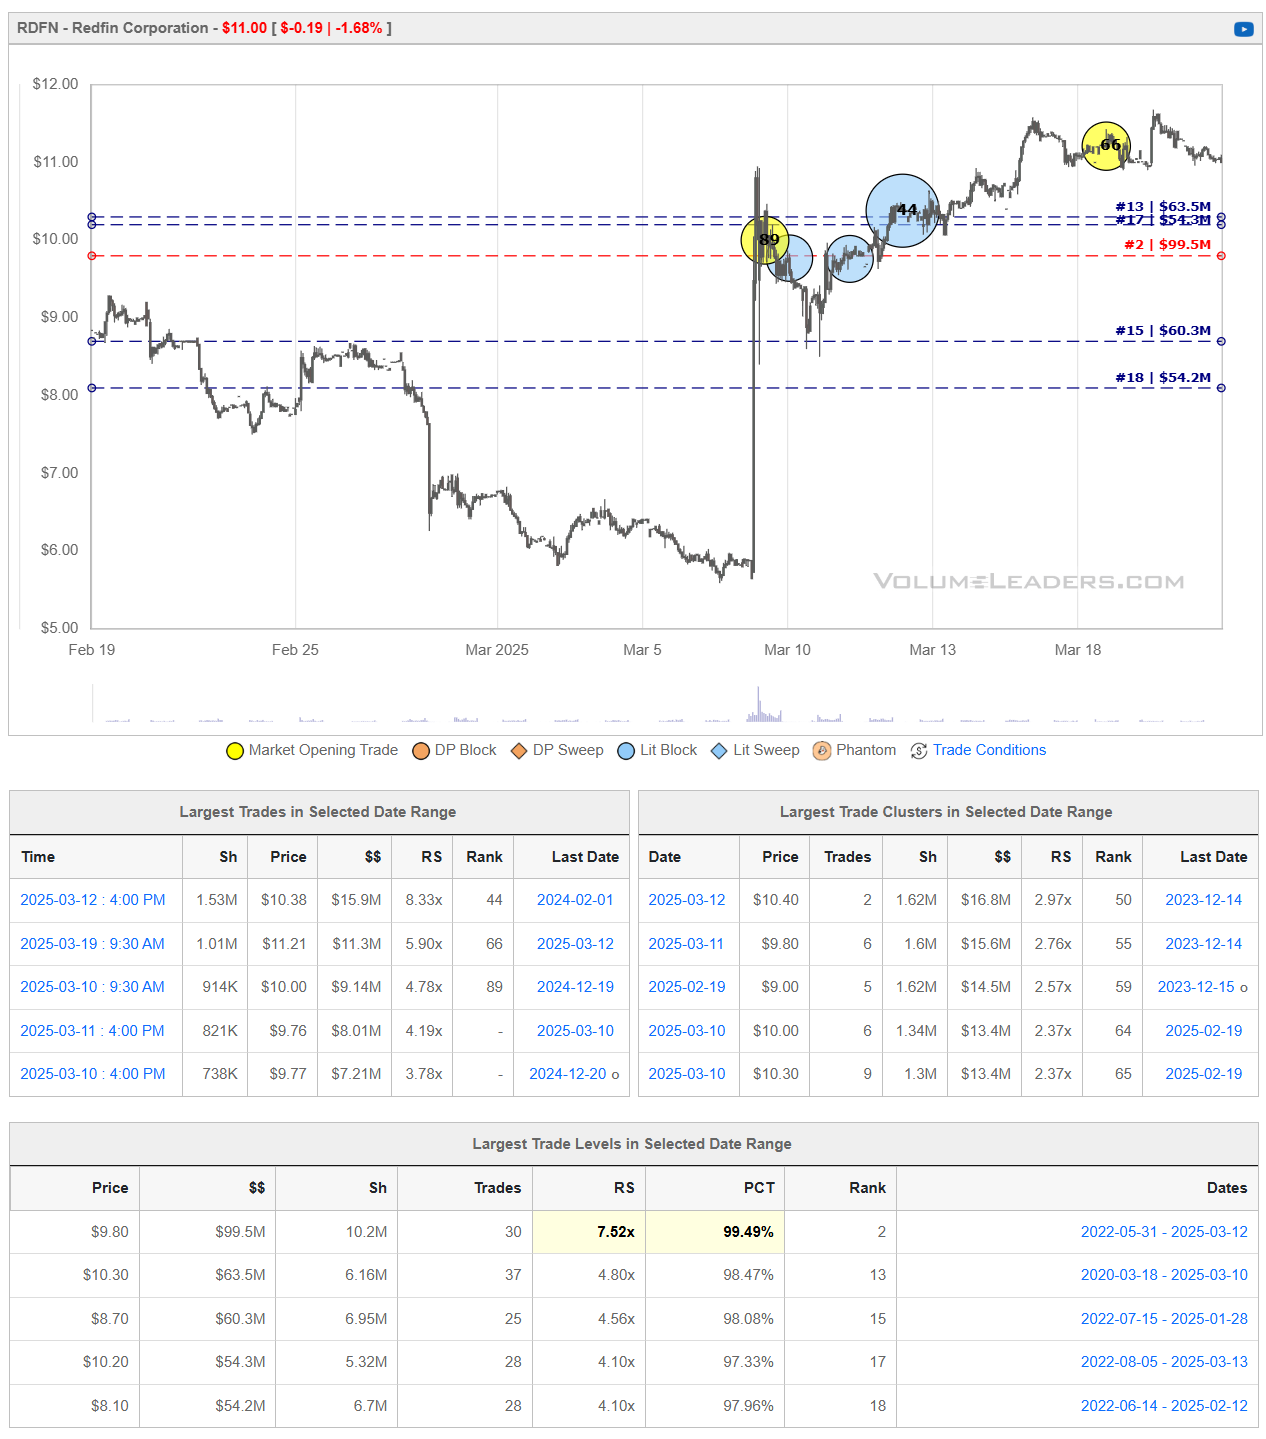
Redfin Corporation (NASDAQ: RDFN) is a technology-powered real estate brokerage offering residential real estate services across the United States and Canada.
Recent Developments:
Acquisition by Rocket Companies: On March 14, 2025, Rocket Companies announced plans to acquire Redfin in an all-stock transaction valued at $1.75 billion, equating to $12.50 per Redfin share. This merger aims to integrate Rocket's mortgage offerings with Redfin's real estate platform, streamlining the home-buying process for consumers.
Financial Performance: In the fourth quarter of 2024, Redfin reported revenue of $244.3 million, a 12% increase compared to the same period in 2023. The company's gross profit also rose by 12% year-over-year, reaching $81.9 million.
Market Reaction: Following the acquisition announcement, Redfin's stock surged by approximately 68%, reflecting investor optimism about the potential synergies between the two companies.
Bullish Perspective:
Strategic Synergy: The merger with Rocket Companies is expected to create a more seamless home-buying experience by combining real estate services with mortgage financing, potentially attracting a larger customer base.
Enhanced Financial Position: The acquisition could provide Redfin with additional resources and capital, enabling further technological advancements and expansion into new markets.
Market Expansion: Integrating Rocket's extensive mortgage services with Redfin's platform may lead to increased cross-selling opportunities and a broader market reach.
Bearish Perspective:
Integration Challenges: Merging operations of two large companies can be complex, potentially leading to operational disruptions and challenges in aligning corporate cultures.
Regulatory Scrutiny: The acquisition may attract regulatory attention, potentially delaying the merger and adding compliance costs.
Market Competition: The real estate and mortgage industries are highly competitive, with established players like Zillow and traditional banks posing significant challenges to the combined entity's market share.
In summary, Redfin's planned acquisition by Rocket Companies presents opportunities for growth and enhanced service offerings through integrated real estate and mortgage solutions. However, potential challenges related to integration, regulatory scrutiny, and competition should be carefully considered by investors.
WOLF 0.00%↑
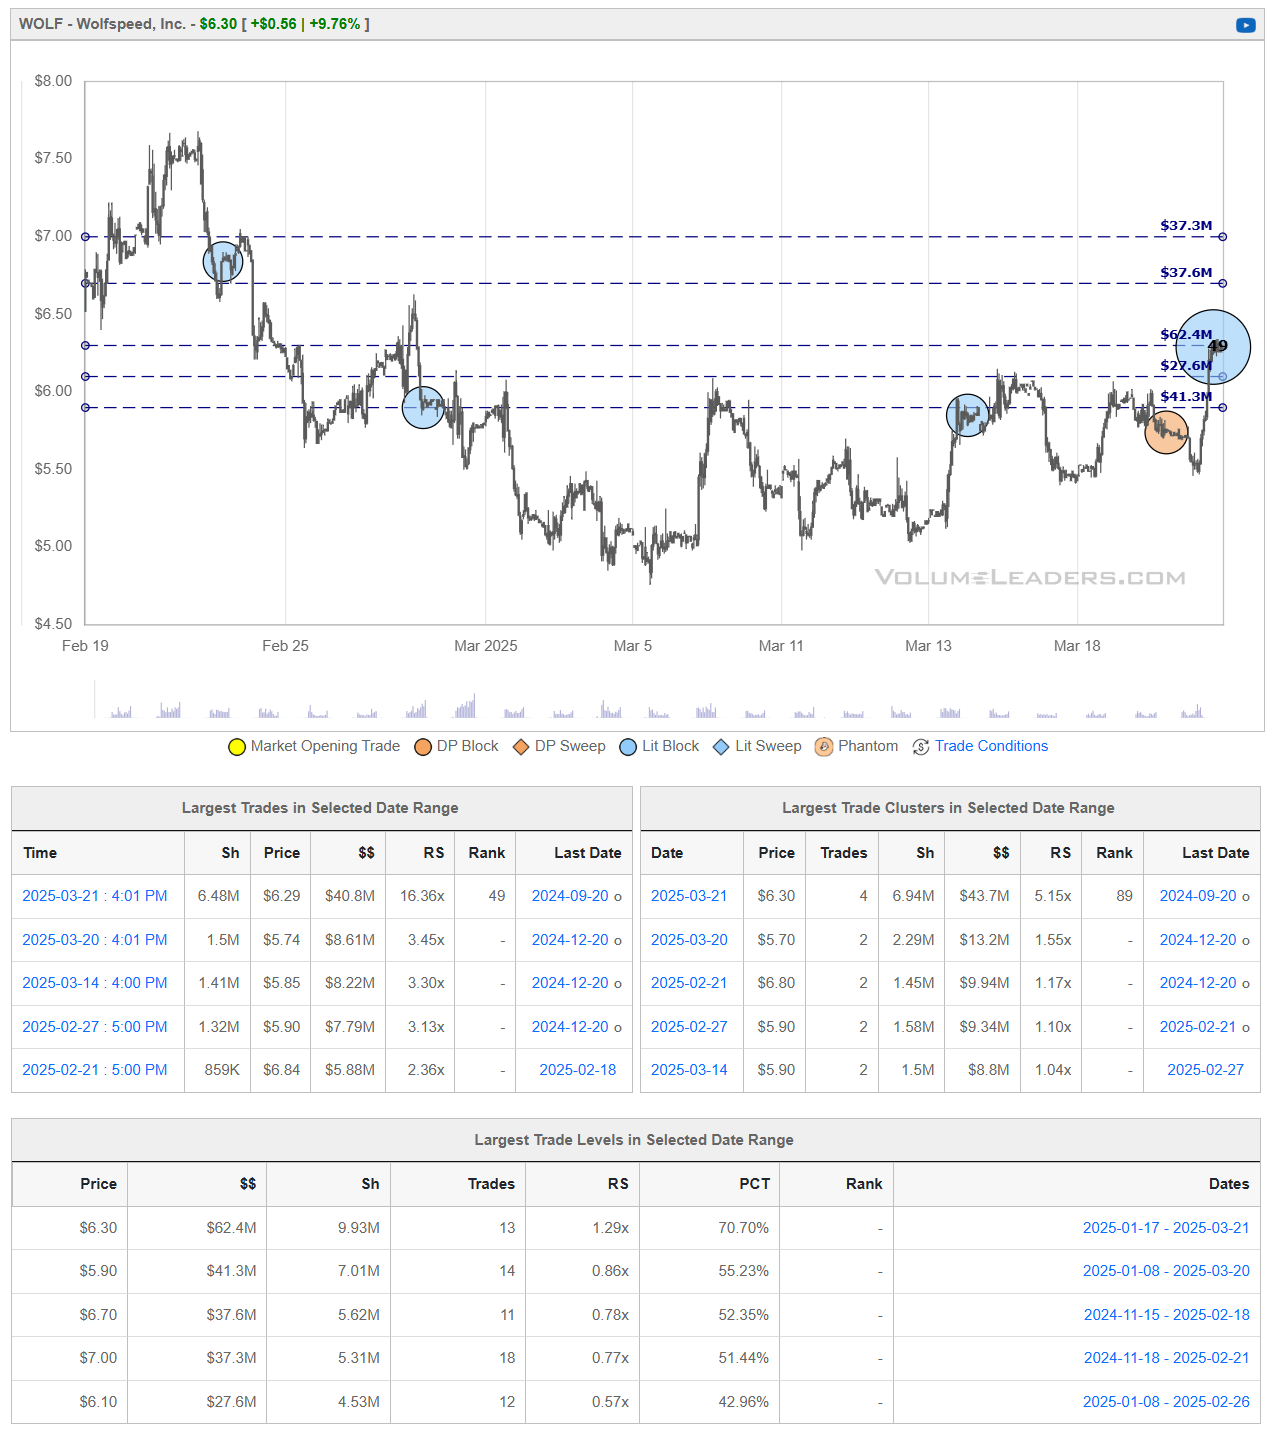
Wolfspeed, Inc. (NYSE: WOLF) specializes in silicon carbide (SiC) and gallium nitride (GaN) technologies, providing materials and devices for power applications such as electric vehicles (EVs), renewable energy, and storage systems.Wolfspeed+3Reuters+3Seeking Alpha+3
Recent Developments:
Financial Performance:
Q2 FY2025 Results: Wolfspeed reported revenue of $180.5 million for the second quarter of fiscal year 2025, slightly surpassing Wall Street expectations of $179.9 million. However, this represents a decrease from $208.4 million in the same period the previous year. The net loss widened to $372.2 million, or $2.88 per share, compared to a loss of $144.7 million, or $1.15 per share, year-over-year.
Technological Advancements:
Gen 4 MOSFET Technology: On January 22, 2025, Wolfspeed launched its fourth-generation metal-oxide-semiconductor field-effect transistor (MOSFET) technology platform. This advancement aims to deliver enhanced performance in real-world conditions for high-power applications, reinforcing the company's commitment to innovation in SiC technology.
Strategic Investments:
CHIPS Act Funding: In October 2024, the Biden administration announced up to $750 million in direct funding to support Wolfspeed's new SiC factory in North Carolina and its facility in Marcy, New York. This investment underscores the company's pivotal role in advancing U.S. semiconductor manufacturing capabilities.
Bullish Perspective:
Market Leadership in SiC Technology: Wolfspeed's focus on SiC materials positions it advantageously in markets like EVs and renewable energy, where SiC components are critical for efficiency and performance.
Government Support: The substantial funding from the CHIPS Act enhances Wolfspeed's capacity to scale operations and meet growing demand, particularly in the EV sector.
Technological Innovation: The introduction of the Gen 4 MOSFET platform demonstrates Wolfspeed's commitment to advancing SiC technology, potentially attracting a broader customer base seeking high-performance solutions.
Bearish Perspective:
Financial Losses: The widening net loss in Q2 FY2025 raises concerns about the company's profitability and operational efficiency.
Stock Performance: Wolfspeed's stock has experienced significant declines, reflecting investor apprehension regarding its financial trajectory and market challenges.
Operational Challenges: Delays in projects, such as the postponed semiconductor plant in Germany, indicate potential hurdles in execution and market demand uncertainties.
In summary, while Wolfspeed holds a leadership position in SiC technology with strong governmental backing and ongoing innovations, investors should remain cautious of its financial losses, stock volatility, and operational challenges that could impact long-term growth.
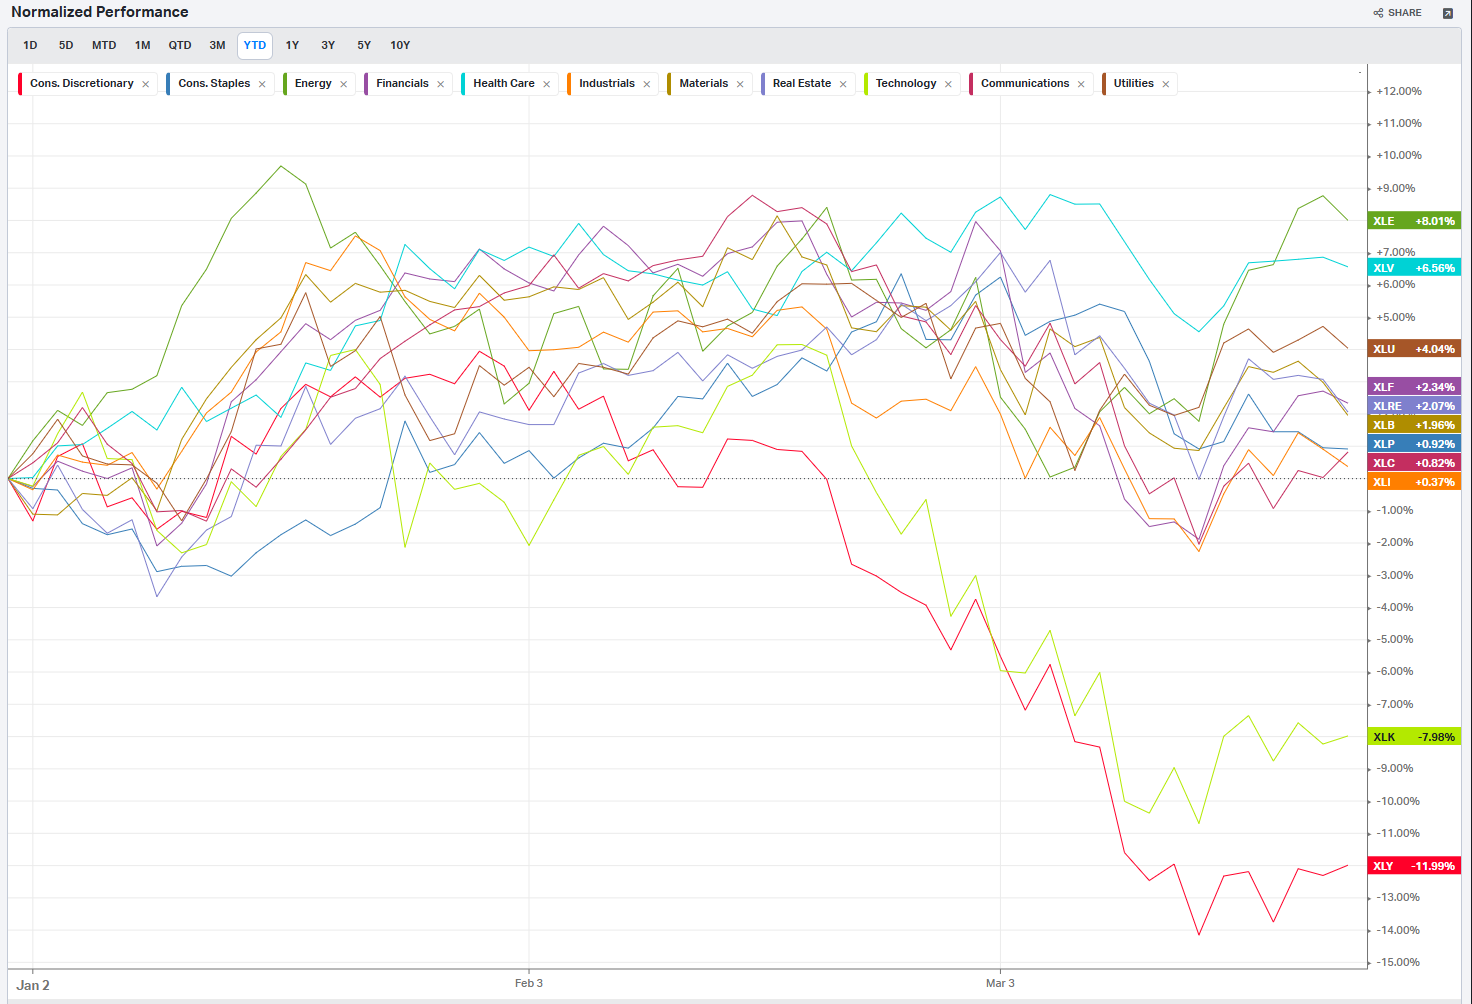
Summary Of Thematic Performance YTD
VolumeLeaders.com provides a lot of pre-built filters for thematics so that you can quickly dive into specific areas of the market. These performance overviews are provided here only for inspiration. Consider targeting leaders and/or laggards in the best and worst sectors, for example.
S&P By Sector
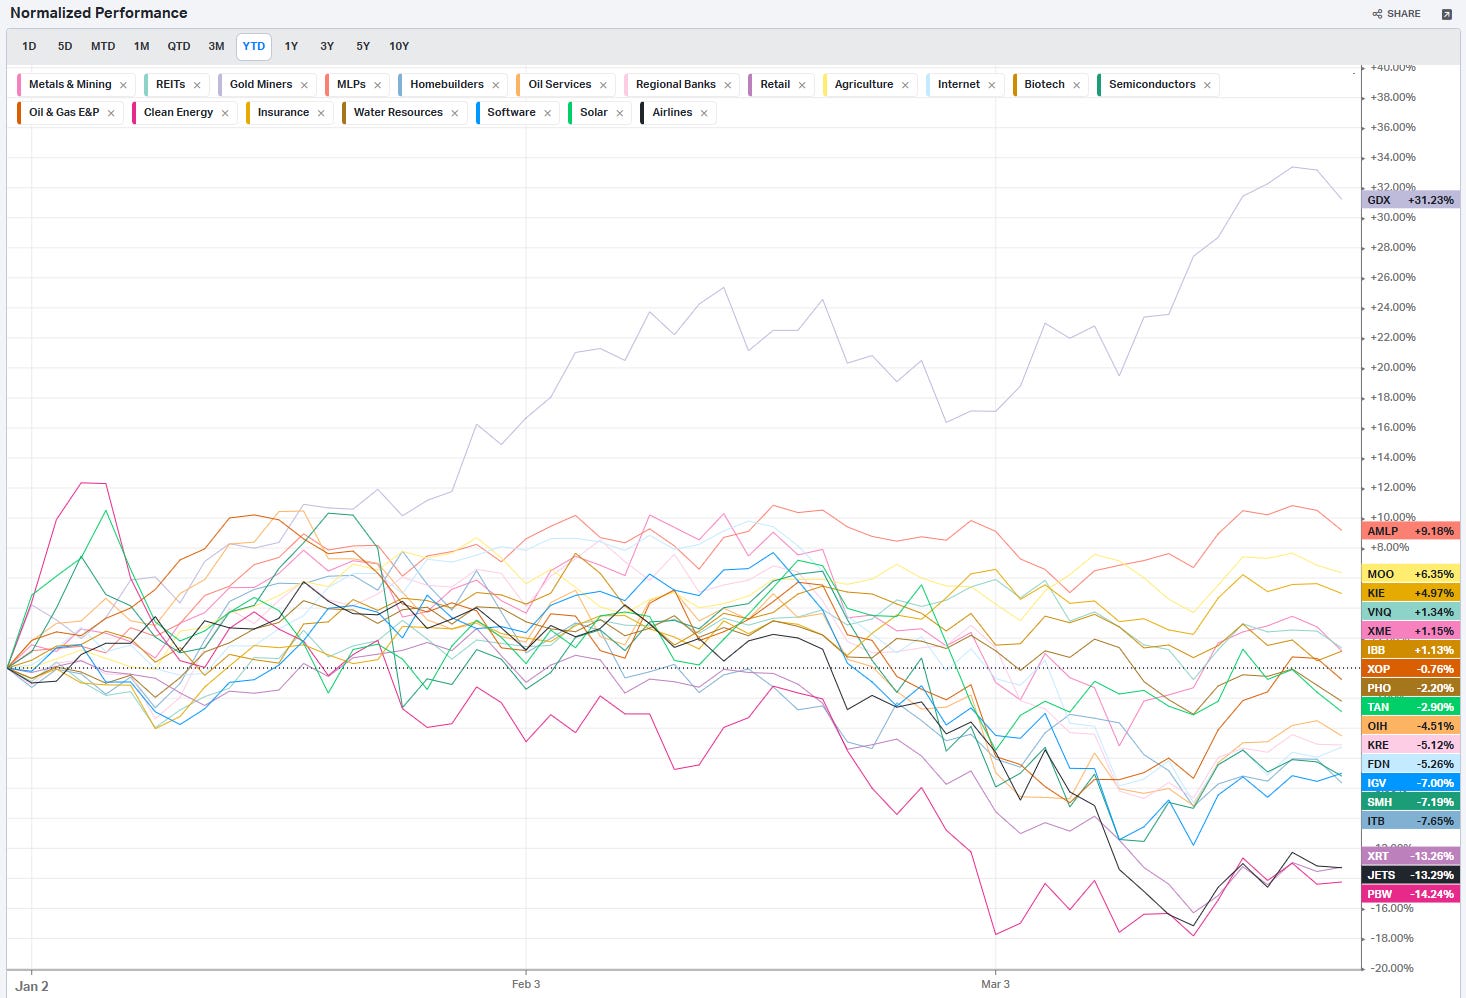
S&P By Industry
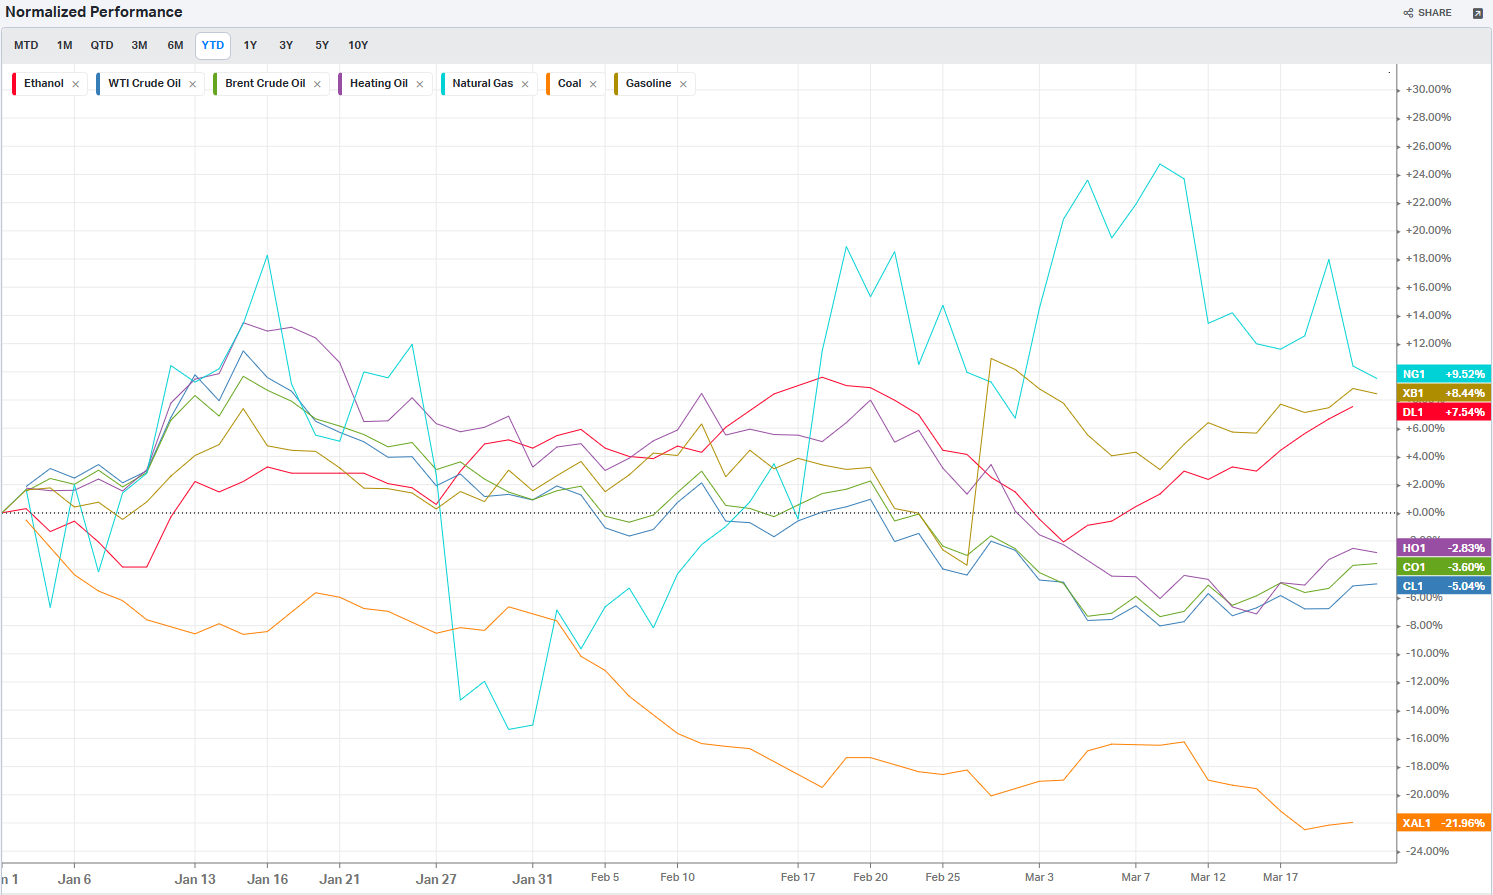
Commodities: Energy
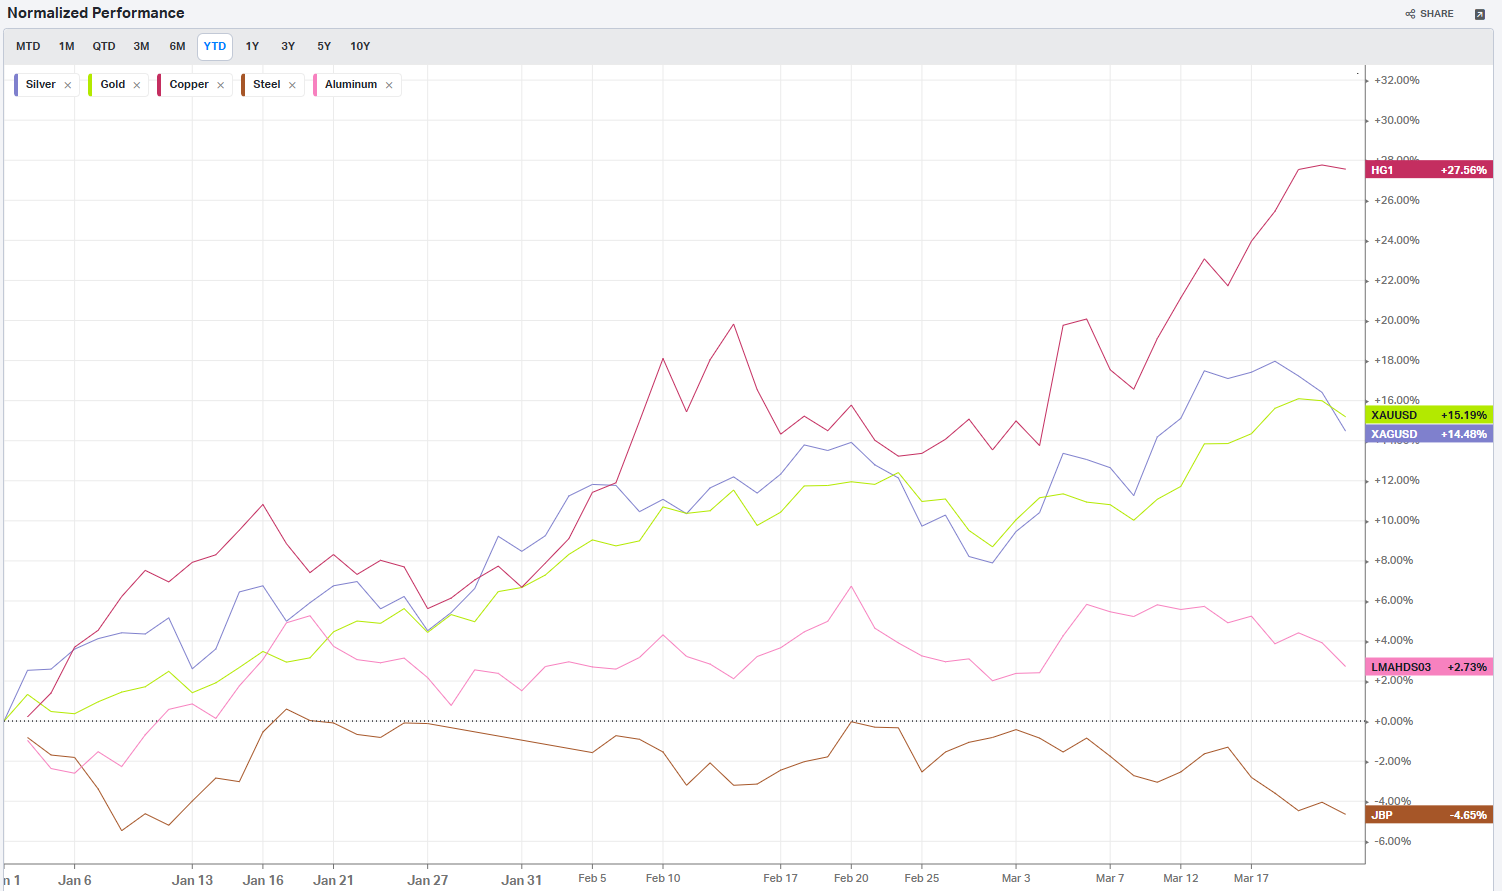
Commodities: Metals
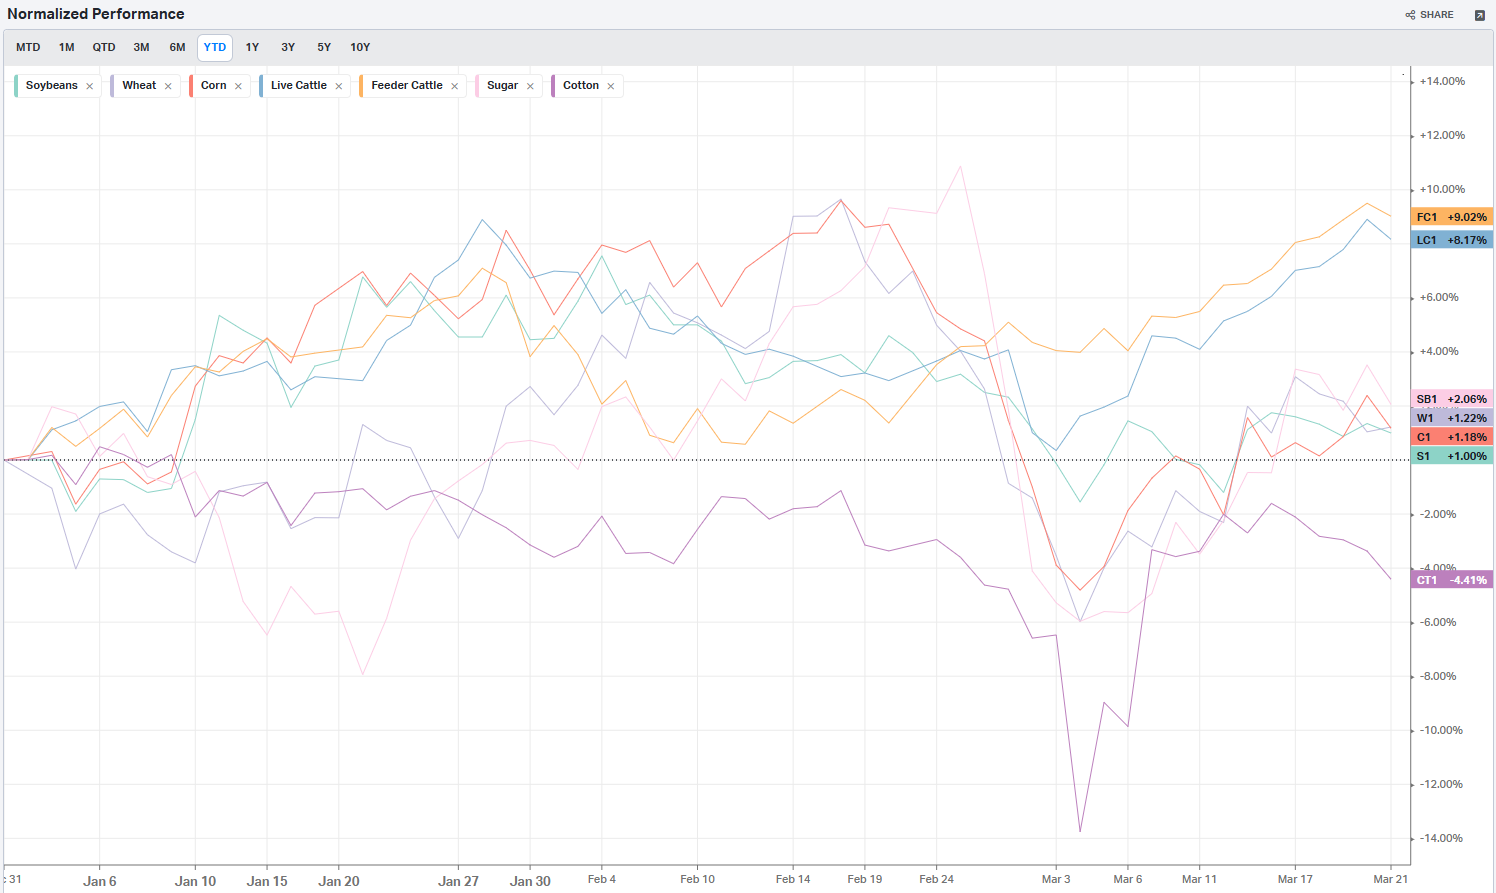
Commodities: Agriculture
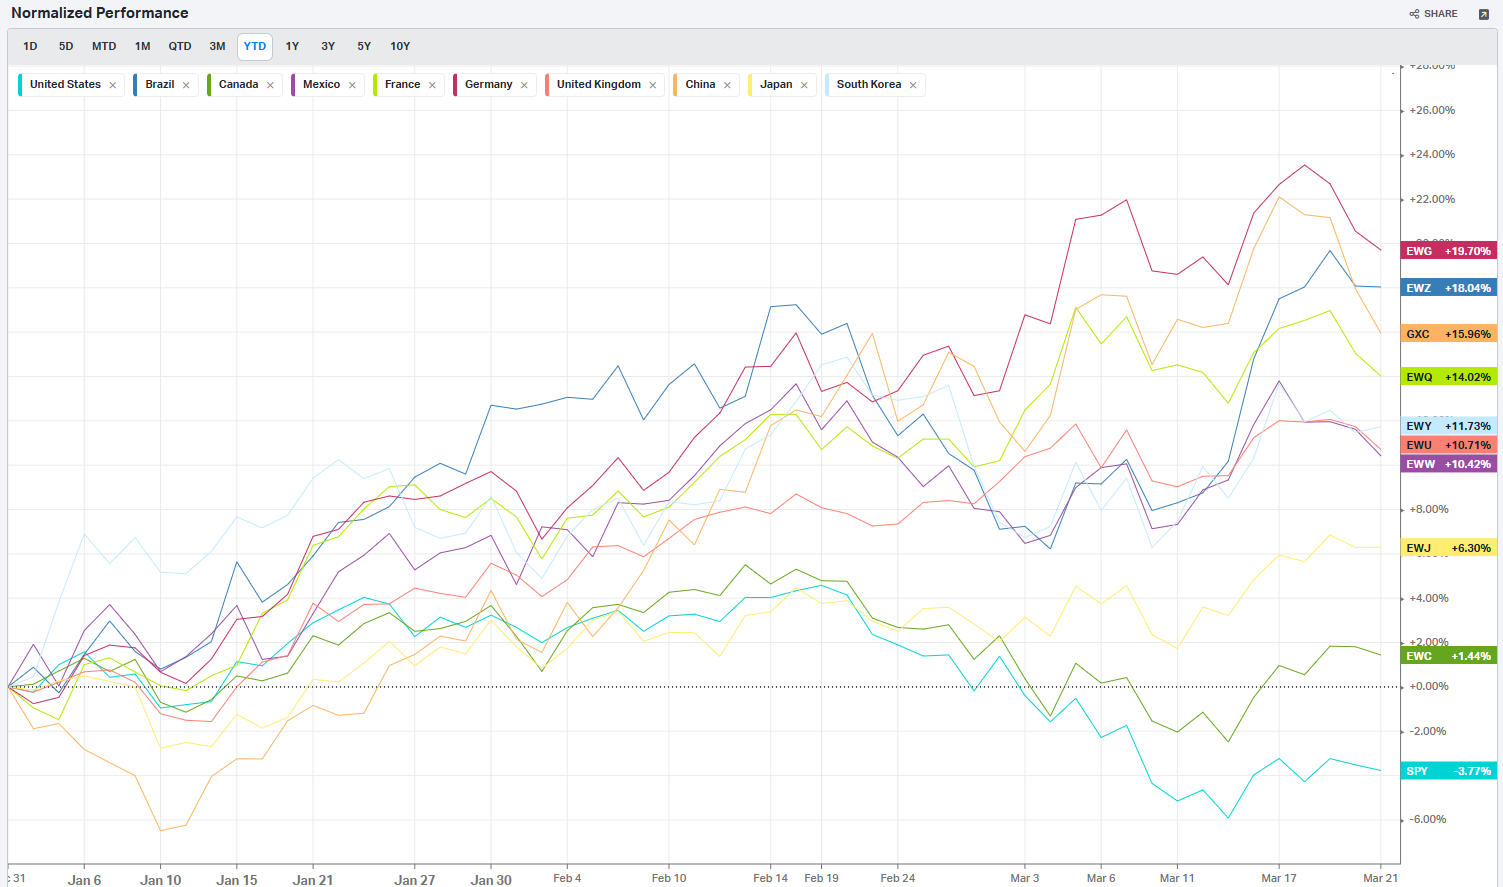
Country ETFs
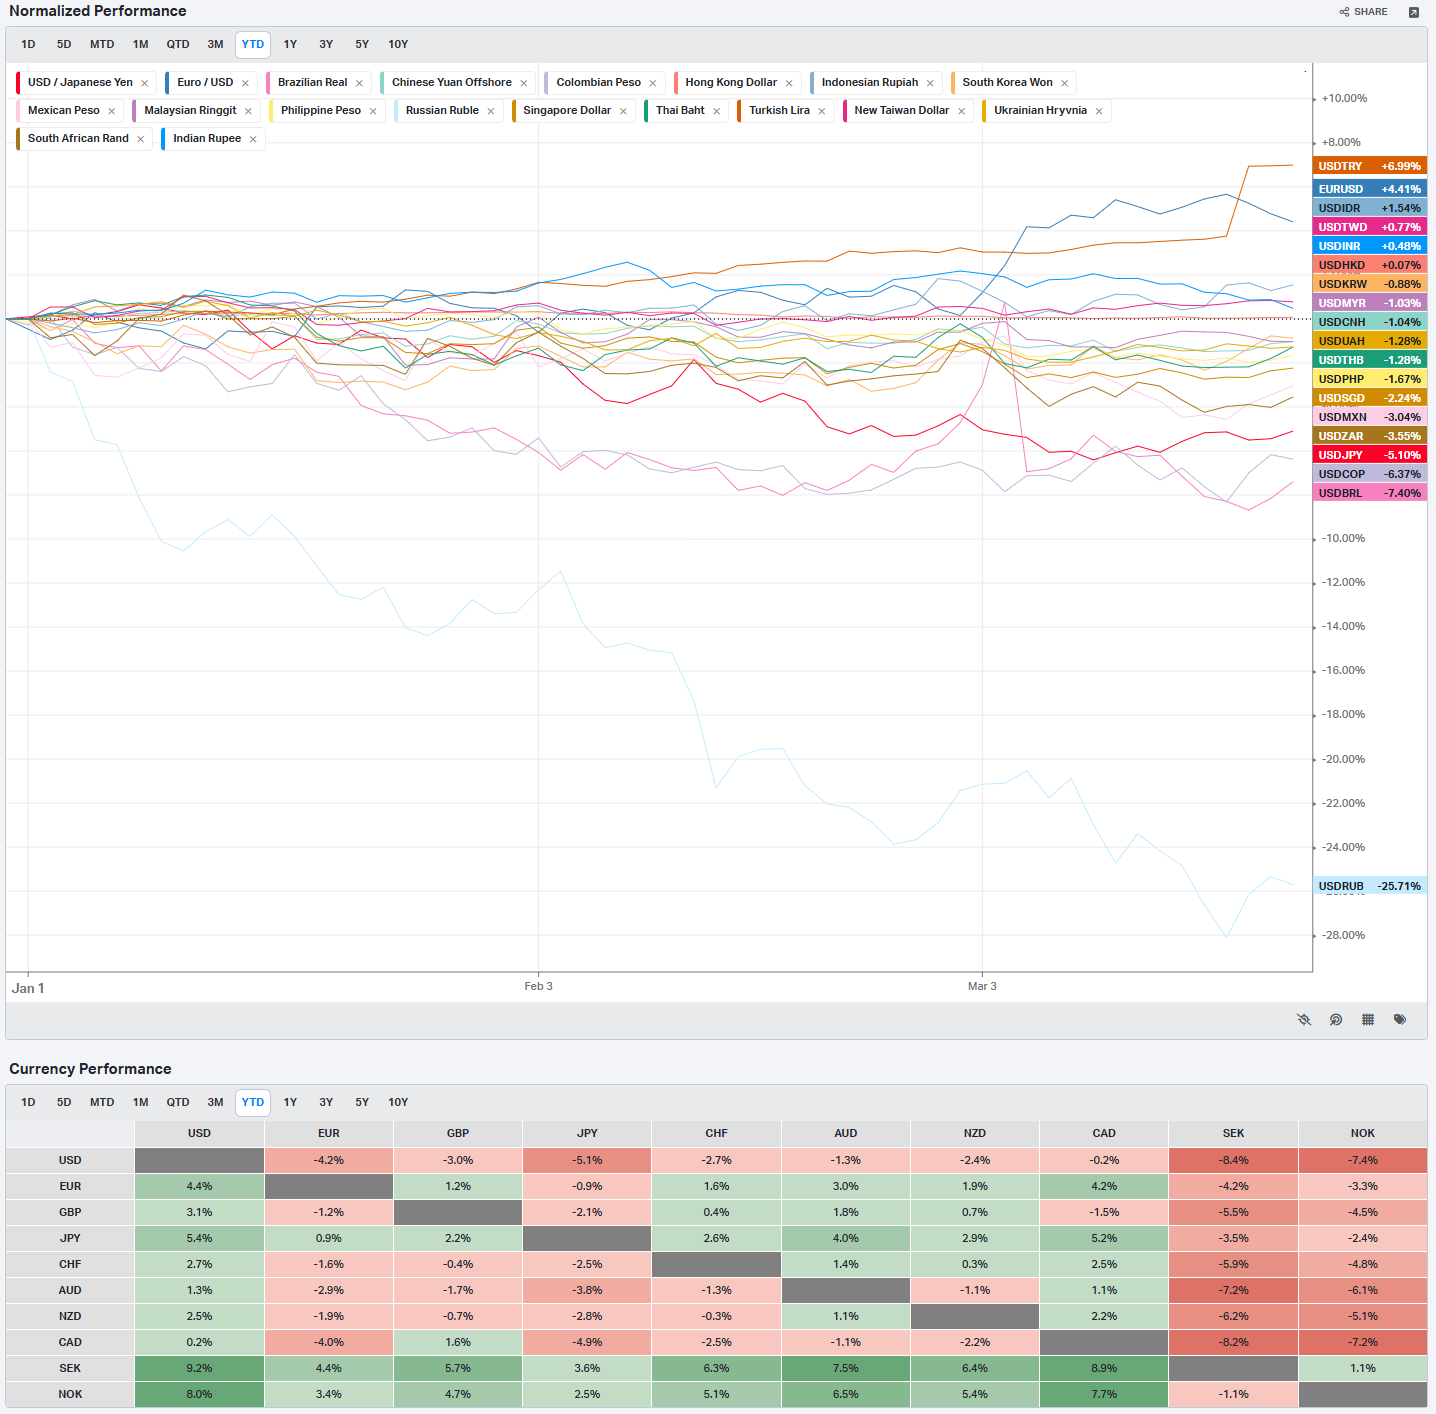
Currencies
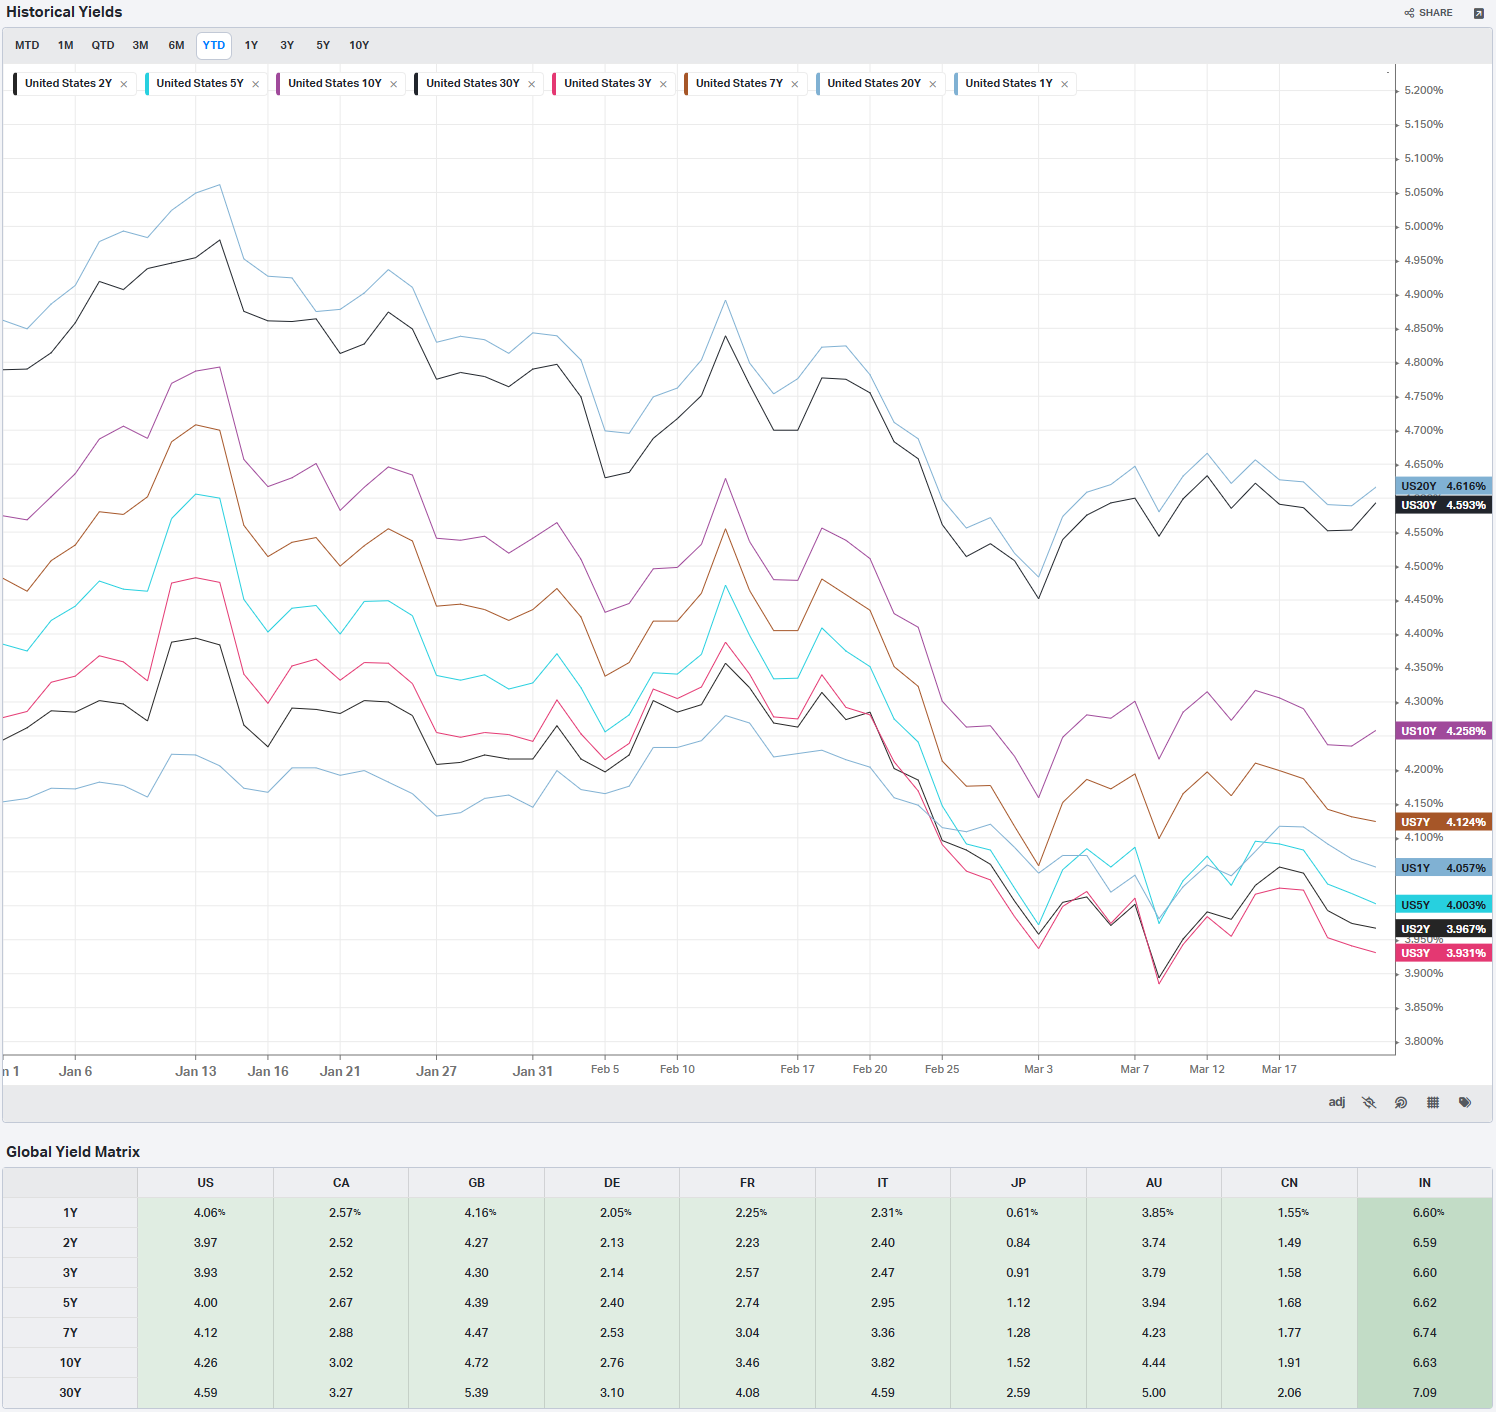
Global Yields
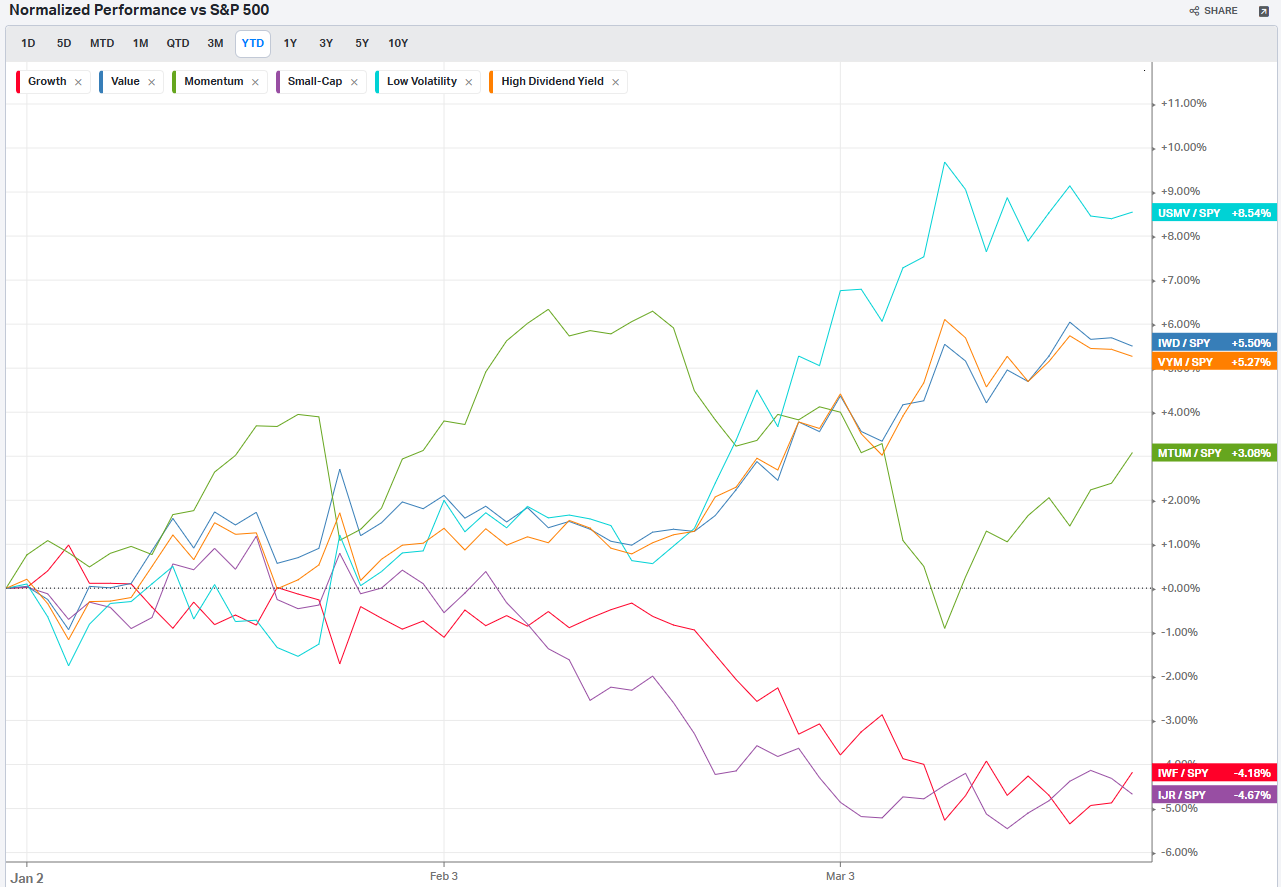
Factors: Style
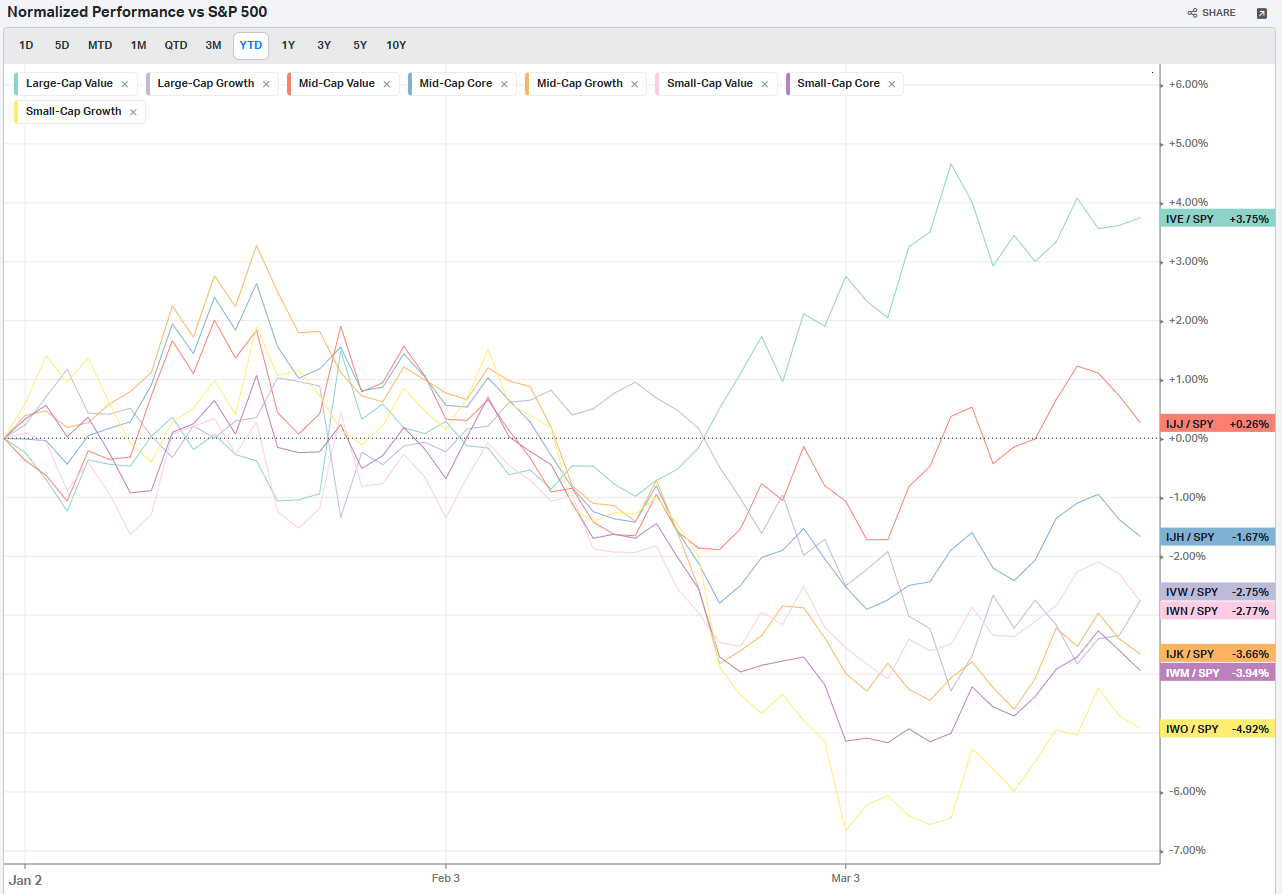
Factors: Size vs Value
Factors: Qualitative
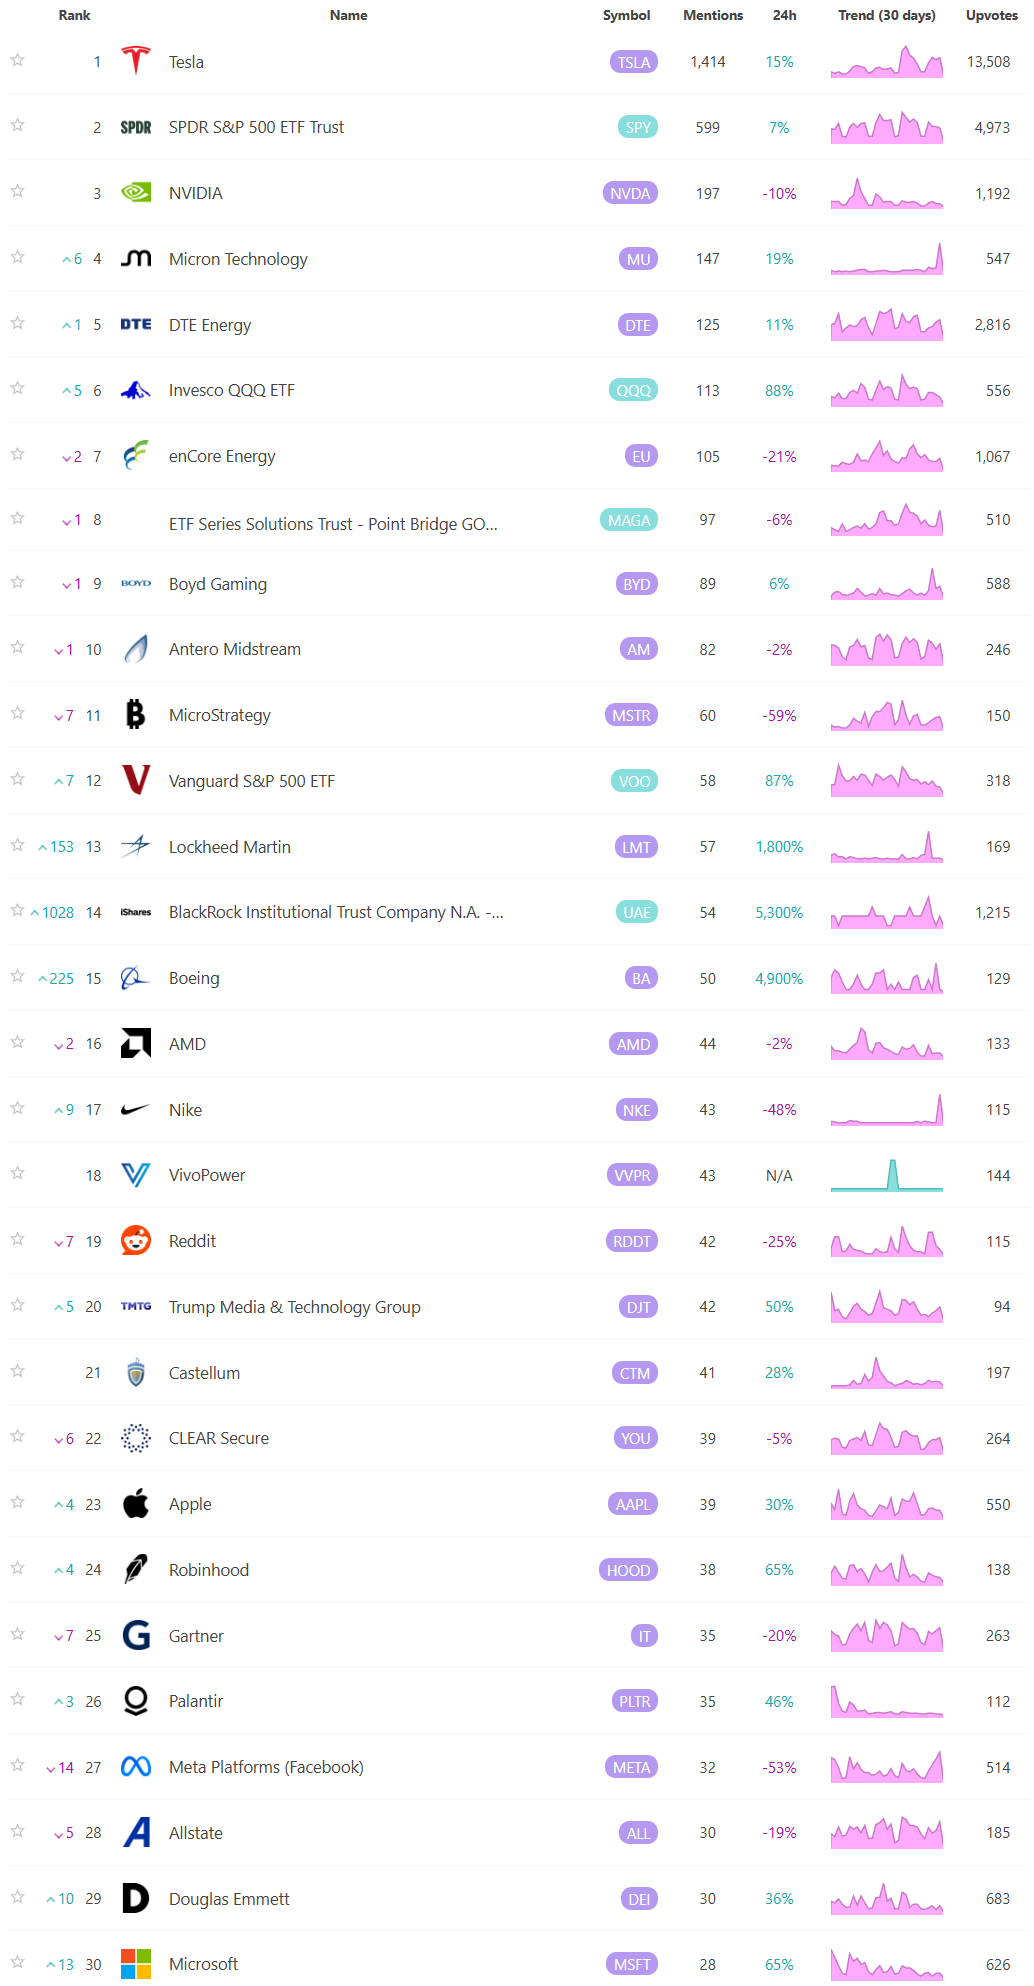
Social Media Favs
Analyzing social sentiment can provide valuable insights for investment strategies by offering a pulse on public perception, mood, and market sentiment that traditional financial indicators might not capture. Here’s how social sentiment analysis can enhance investment decisions:
Market Momentum: Positive or negative social sentiment can signal impending momentum shifts. When public opinion on a stock, sector, or asset class changes sharply, it can create buying or selling pressure, especially if that sentiment becomes widespread.
Early Detection of Trends: Social sentiment data can help investors spot trends before they show up in technical or fundamental data. For example, increased positive chatter around a particular company or sector might indicate growing interest or excitement, which could lead to price appreciation.
Gauge Retail Investor Impact: With the rise of retail investor platforms, collective sentiment on social media can lead to significant price movements (e.g., meme stocks). Understanding how retail investors view certain stocks can help in identifying high-volatility opportunities.
Event Reaction Monitoring: Social sentiment can provide real-time reactions to news events, product releases, or earnings reports. Investors can use this information to gauge market reaction quickly and adjust their strategies accordingly.
Complementing Quantitative Models: By adding a social sentiment layer to quantitative models, investors can enhance predictions. For example, a model that tracks historical price and volume data might perform even better when factoring in sentiment trends as a measure of market psychology.
Risk Management: Negative sentiment spikes can be a signal of potential downturns or increased volatility. By monitoring sentiment, investors might avoid or hedge against investments in companies experiencing a public relations crisis or facing negative perceptions.
Long-Term Sentiment Trends: Sustained sentiment trends, whether positive or negative, often mirror longer-term market cycles. Tracking sentiment trends over time can help identify shifts in investor psychology that could affect longer-term investments or sector rotations.
For these reasons, sentiment analysis, when combined with other tools, can provide a comprehensive view of both immediate market reactions and underlying investor attitudes, helping investors position themselves strategically across various time frames. Here are the most mentioned/discussed tickers on Reddit from some of the most active Subreddits for trading:
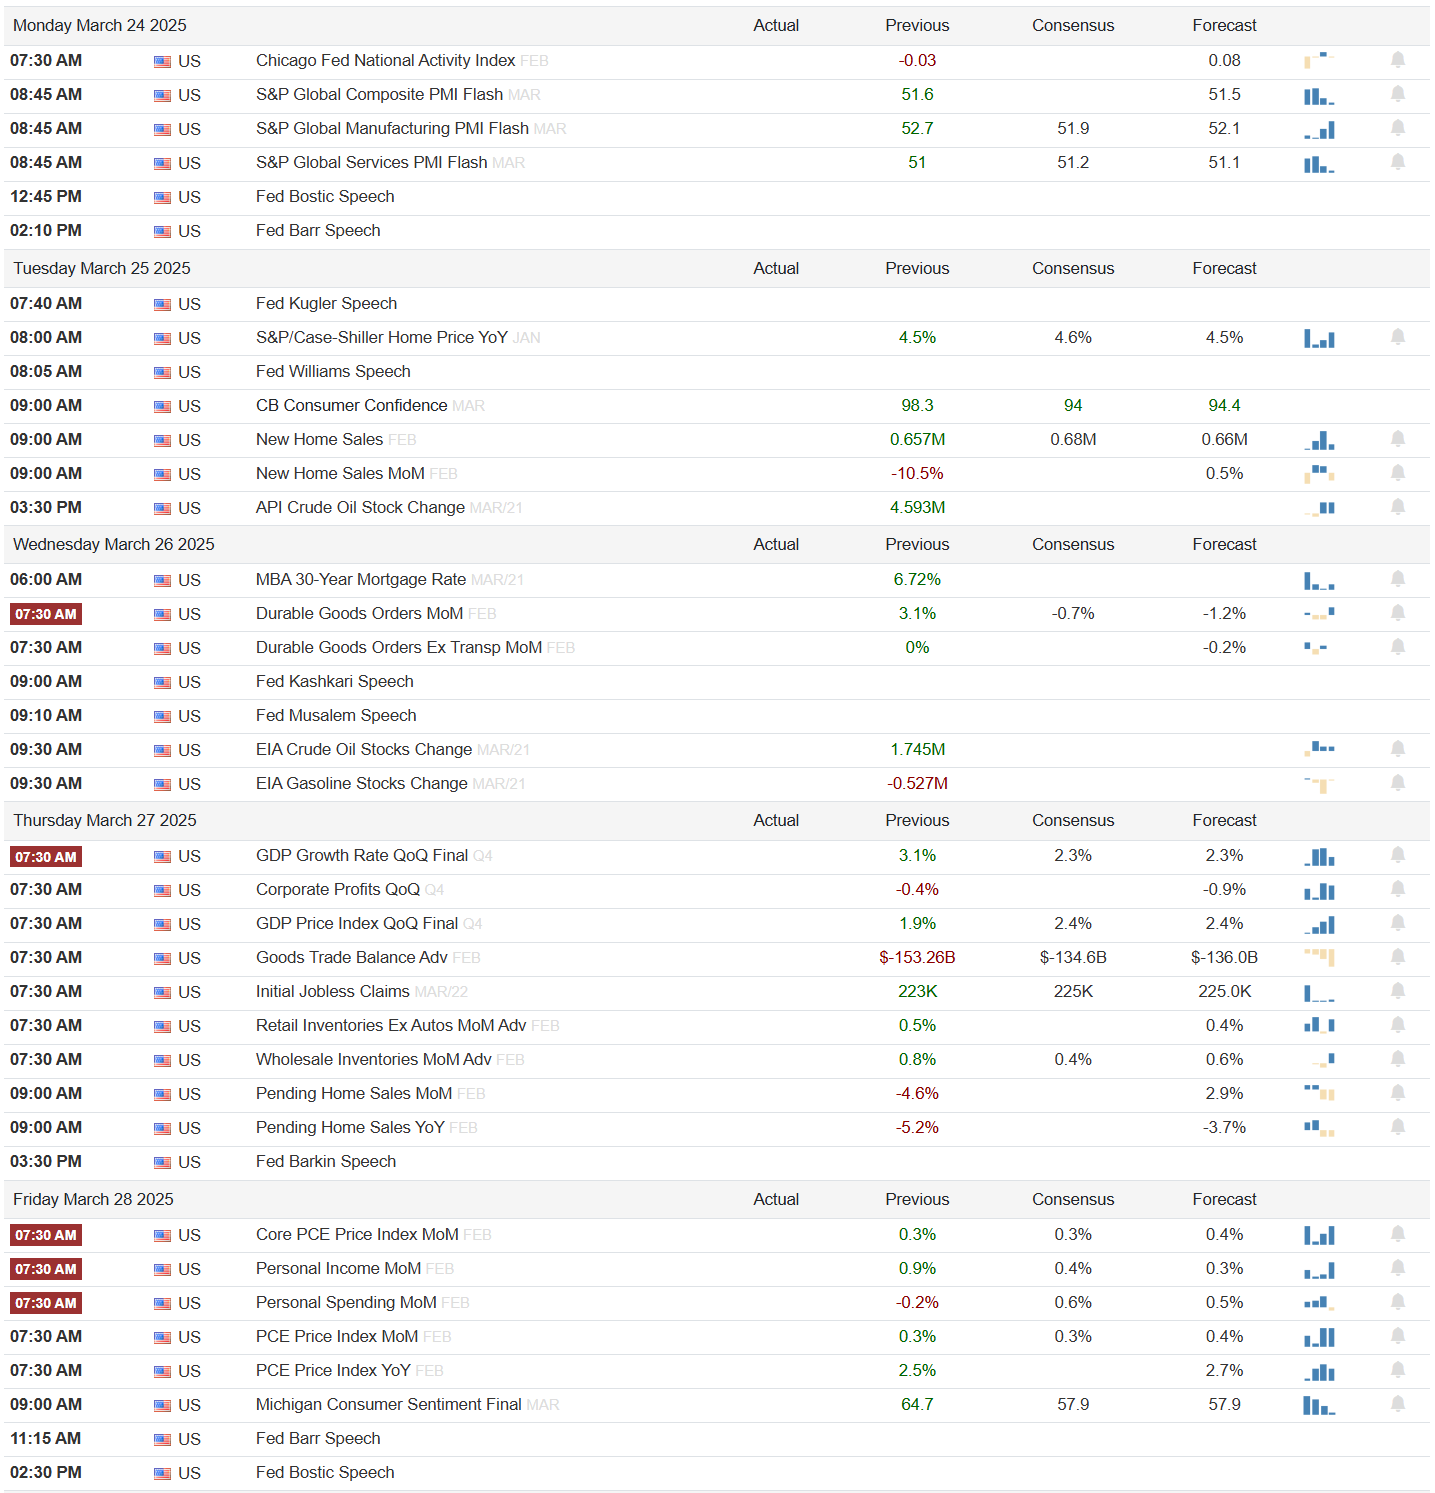
Events On Deck This Week
Here are key events happening this week that have the potential to cause outsized moves in the market or heightened short-term volatility.
Econ Events By Day of Week
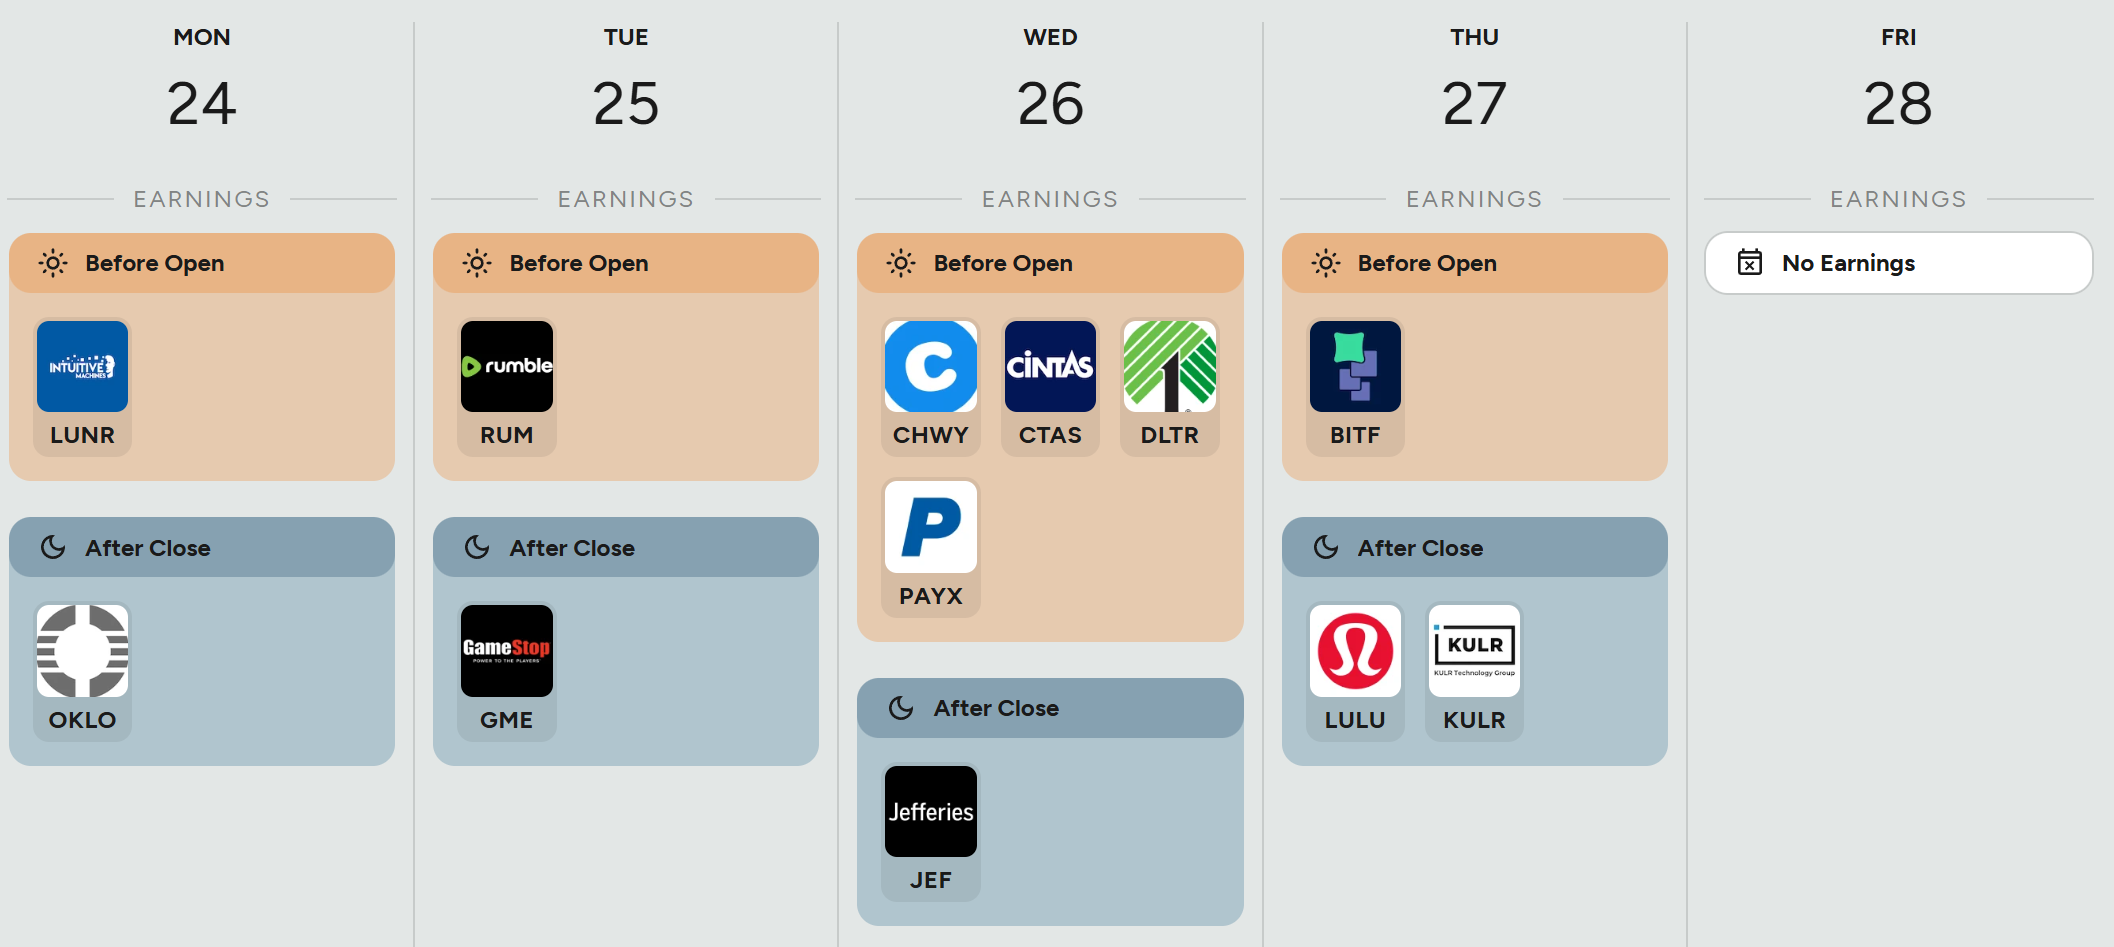
Anticipated Earnings By Day of Week